
0 ITEMS

Content Marketing Agency Financial Model Excel Template
The Marketing Agency Financial Model is a ready-to-use financial model template built to help agency founders, consultants, analysts, and business owners turn an agency concept into a structured financial forecast. Instead of starting with a blank spreadsheet, users can work from a model designed around the economics of a marketing agency, including client acquisition, service pricing, billable hours, recurring revenue, startup costs, operating expenses, payroll, cash flow, profitability, and investor-facing outputs.


Financial Model Overview
The Marketing Agency Financial Model is a ready-to-use financial model template designed for planning, launching, funding, or scaling a marketing agency. It gives entrepreneurs, business owners, consultants, analysts, and agency founders a structured way to forecast revenue, startup investment, operating expenses, payroll, profitability, cash flow, and investor returns without building a complex workbook from scratch. A marketing agency depends on a clear relationship between client acquisition, billable work, service pricing, staff capacity, delivery costs, and recurring overhead, and this template brings those drivers into one organized planning tool. Users can customize assumptions for SEO services, social media management, content marketing, PPC advertising, strategy consulting, or other agency services, then review how those assumptions affect financial performance over a multi-year forecast. The model is useful for business plans, loan applications, investor conversations, internal budgeting, expansion planning, and strategic decision-making because it converts operational assumptions into financial outputs that are easier to review, explain, and update.
All-in-One Dashboard
The all-in-one dashboard gives users a central view of the most important inputs and outputs in the Marketing Agency Financial Model. It is designed to reduce spreadsheet clutter by bringing together the agency’s core financial assumptions, performance indicators, and forecast results in one accessible place. Users can review high-level figures such as revenue, expenses, EBITDA, cash balance, profitability, investment needs, and growth trends without moving through every individual worksheet. The dashboard is especially useful for founders and stakeholders who need quick answers during planning meetings, investor discussions, or internal reviews. It helps connect the operating plan to the financial plan by showing how assumptions around client count, pricing, marketing spend, customer acquisition cost, staffing, and overhead flow into the broader forecast. For a marketing agency, this matters because decisions are often made quickly around hiring, campaigns, retainers, freelancers, and service expansion. A clear dashboard helps users see whether the agency is moving toward sustainable profitability, whether cash reserves are sufficient, and which areas of the model may require deeper review. The result is a more practical planning experience where the user can manage the forecast from a focused control center instead of searching through disconnected calculations.
Low, Base, and High Scenario Analysis
The low, base, and high scenario analysis component allows users to compare different possible outcomes for the agency under changing business conditions. A marketing agency’s financial results can vary significantly depending on client acquisition speed, client retention, billable hours, hourly rates, marketing efficiency, payroll growth, and delivery costs. This section lets users stress-test those assumptions by reviewing conservative, expected, and optimistic cases in the same financial model. In a low case, users may test slower client growth, higher customer acquisition costs, lower utilization, or delayed profitability. In a base case, they can review the most realistic operating plan based on current assumptions. In a high case, they can evaluate what happens if the agency signs clients faster, improves billable hours, raises prices, or expands into higher-margin services. The outputs help show how revenue, cash flow, EBITDA, margins, and funding needs shift across scenarios. This is valuable for decision-making because it prevents the plan from depending on a single forecast that may not happen exactly as expected. It also supports investor and lender conversations by showing that the founder has considered risk, upside, and operational flexibility. For agency leaders, scenario analysis helps identify which variables have the greatest impact and which decisions deserve the most attention.
Professional Charts
The professional charts component turns the financial forecast into presentation-ready visual outputs that are easier for stakeholders to understand. Financial models often contain many formulas, rows, and supporting schedules, but decision-makers usually need a clear visual summary of the story behind the numbers. This section helps display key trends such as revenue growth, expense movement, EBITDA development, cash balance, margin improvement, and performance across forecast years. For a marketing agency, charts can make it easier to show how the business moves from early investment and client acquisition into stronger recurring revenue and improved profitability. Users can use these visuals in pitch meetings, business plans, internal presentations, loan packages, or strategic reviews. Inputs from the model, such as revenue streams, operating expenses, startup costs, payroll, and cash flow, feed into visual reports that highlight the most important financial outcomes. This helps users explain the impact of growth assumptions, hiring plans, pricing changes, and cost control strategies without overwhelming the audience with raw spreadsheet detail. Professional charts are also useful for reviewing whether the forecast is internally consistent. If revenue rises but margins decline, or if cash drops while profit improves, the visuals can prompt a deeper review. This makes the model more useful not only for presentation, but also for analysis and planning discipline.
ROE Components and DuPont Analysis
The ROE components and DuPont analysis section helps users understand the drivers behind return on equity and overall financial performance. Instead of looking only at net income or EBITDA, this component breaks down performance into underlying factors that can explain how efficiently the agency uses its capital and generates returns. DuPont analysis typically connects profitability, asset efficiency, and leverage to show what is contributing to return on equity. For a marketing agency, this can be useful because the business may not require the same level of physical assets as other industries, but it still depends on thoughtful use of startup capital, working capital, software investment, payroll, and retained earnings. Users can review how margins, revenue growth, expense control, asset utilization, and financing structure influence the agency’s return profile over time. The inputs may include projected revenue, net profit, total assets, equity, debt, and other balance sheet data generated by the financial statements. The outputs help investors and owners evaluate whether the agency is creating value relative to the capital invested. This is particularly helpful when preparing funding documents because it provides a more sophisticated view of performance than a simple profit forecast. It also supports management decisions by showing whether return improvement is coming from stronger margins, better efficiency, or changes in capital structure.
Revenue Inputs
The revenue inputs section is where users define the main commercial assumptions that drive the agency’s top-line forecast. For a marketing agency, revenue is usually influenced by the number of active clients, the mix of services offered, average billable hours per client, pricing by service, customer acquisition cost, marketing budget, retention, and the speed at which new clients are added. This component allows users to model services such as SEO, social media management, content marketing, PPC advertising, strategy consulting, or other agency offerings in a structured way. Rather than entering a single revenue number, users can build the forecast from operational drivers that reflect how an agency actually earns money. Inputs may include hourly rates, monthly retainers, service package prices, expected client counts, conversion assumptions, campaign spend, and capacity limits. The resulting output helps estimate monthly and annual revenue, growth rates, and the impact of changes in pricing or client volume. This is useful for financial planning because it forces the user to think through how revenue will be generated, not just what revenue target they hope to reach. It is also useful for investor discussions because it shows the logic behind the forecast and makes assumptions easier to defend. By adjusting the revenue inputs, users can test whether growth goals are realistic and whether the agency has enough delivery capacity to support planned sales.
Bank-Ready Reports
The bank-ready reports component provides lender-friendly financial outputs that can support loan applications, funding requests, and formal business planning. Banks and financing partners often expect clear financial statements, organized assumptions, and a credible explanation of how borrowed capital will be used and repaid. This section helps package the agency forecast into polished reports that summarize projected revenue, operating costs, profit, cash flow, balance sheet movement, and key funding metrics. For a marketing agency seeking startup capital or expansion financing, this can include the initial investment required for office setup, technology, website development, CRM implementation, software tools, marketing campaigns, and working capital. The reports help show whether the business can generate enough cash to cover ongoing expenses and meet repayment obligations. Inputs across the model, including startup costs, revenue assumptions, payroll plans, cost of services, overhead, and financing assumptions, flow into the reporting outputs. This makes it easier to present a complete and consistent financial case. The value of this component is that it saves users from manually preparing separate lender summaries and reduces the risk of inconsistencies between the business plan and the financial forecast. For founders, consultants, and analysts, bank-ready reports provide a more professional way to communicate the financial structure of the agency and demonstrate that the plan has been reviewed through a practical funding lens.
Revenue Breakdown
The revenue breakdown component gives users a detailed view of how each agency revenue stream contributes to total sales. Marketing agencies often generate income from multiple services, and a blended revenue number can hide which offerings are driving growth, margin, and client value. This section separates revenue by service category, such as SEO services, social media management, content marketing, PPC advertising, strategy consulting, or other custom service lines. Users can review how each revenue stream performs over time based on pricing, client count, hours, retainers, or project-based assumptions. The outputs may show monthly revenue by category, annual totals, contribution mix, and growth patterns across the forecast period. This helps users identify which services are most important to the business model and which may need pricing adjustments, staffing support, or marketing attention. For example, if one service generates strong revenue but requires heavy freelancer support, the agency may need to examine margins and delivery capacity. If another service has lower early revenue but strong scalability, it may deserve investment as the agency matures. The revenue breakdown is useful for budgeting, staffing, sales strategy, and funding presentations because it explains the composition of growth. It also helps users avoid relying too heavily on a single offering and supports a more balanced agency strategy.
KPI Dashboard
The KPI dashboard component helps users monitor performance metrics that are especially relevant to a marketing agency. While financial statements show revenue, expenses, profit, and cash movement, KPIs help explain why those numbers are changing. This section may track metrics such as active clients, customer acquisition cost, revenue per client, billable hours, utilization, gross margin, EBITDA margin, cash runway, payback period, and other performance benchmarks. Users can compare planned performance against researched industry assumptions or internal targets, making it easier to validate whether the agency’s forecast is realistic. The KPI dashboard is valuable because agency performance depends on both financial and operational discipline. A company can grow revenue but still struggle if acquisition costs are too high, utilization is too low, or payroll expands faster than billable work. By presenting KPIs in a focused dashboard, the model helps users identify strengths, weaknesses, and warning signs before they become major financial problems. Inputs from the revenue plan, payroll schedule, operating expenses, marketing budget, and financial statements are translated into metrics that support decision-making. For founders and managers, this makes the template useful beyond a one-time business plan. It can become a working management tool for reviewing performance, setting targets, and communicating progress to advisors, lenders, investors, or team members.
Startup Costs and Initial Investment Planning
The startup costs and initial investment planning component helps users estimate the capital needed to launch or prepare the marketing agency for operations. A marketing agency may not require heavy manufacturing equipment, but it still needs a realistic budget for setup and early operating readiness. This section can include office setup and furnishings, computer hardware, website design and development, CRM implementation, design tools, analytics platforms, project management software, legal and accounting setup, branding, insurance, initial marketing, deposits, and working capital. Users can customize each cost category to match a remote agency, boutique office, hybrid team, or larger launch plan. The output helps calculate total startup investment and shows how much funding may be needed before the agency generates sufficient recurring revenue. This is useful for business planning because many early-stage agencies underestimate the cash required to acquire clients, hire talent, build systems, and operate through the first months of growth. It is also important for investor and lender conversations because a clear startup cost breakdown supports a precise funding request. By separating one-time investments from recurring expenses, the model helps users understand the difference between launch capital and ongoing burn rate. This makes the financial plan more transparent and helps founders make better decisions about what to buy immediately, what to delay, and what level of funding is appropriate.
File Types:
- Excel – Multi-User – .xlsx
- Excel – Single-User – .xlsx
Similar ProductsOther customers were also interested in...


 HenrySheykin
Direct Marketing Agency Financial Model Excel Temp...
The Direct Marketing Agency Financial Model helps turn an agency concept into a structured financial... Read more
Traditional Advertising Agency Financial Model Exc...
The Advertising Agency Financial Model helps founders, agency owners, consultants, analysts, and bus... Read more
 City Finance
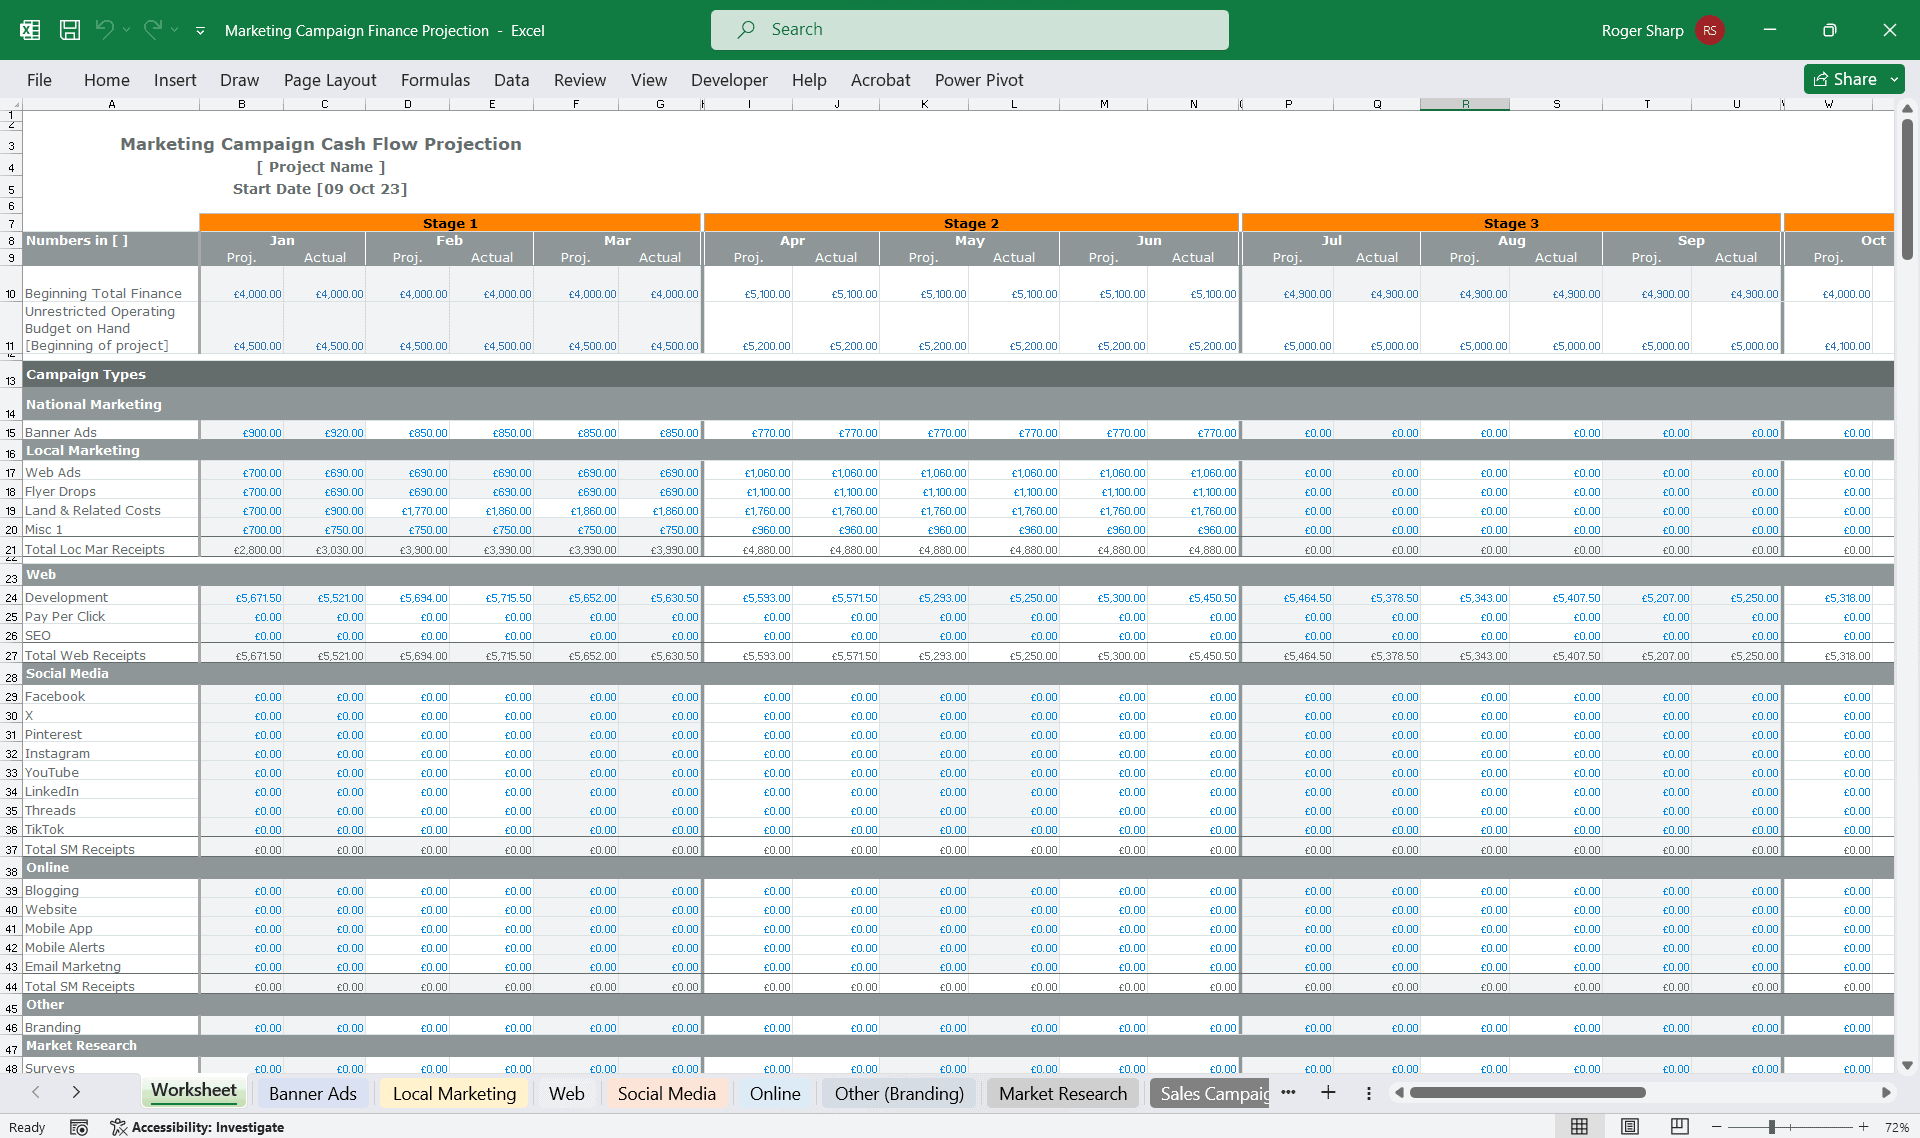
Marketing Campaign Financial Projection Model
Comprehensive editable, Excel spreadsheet for tracking marketing campaign financials in months or st... Read more
Digital Marketing Agency Financial Model Excel Tem...
The Digital Marketing Agency Financial Model helps agency founders, business owners, consultants, an... Read more
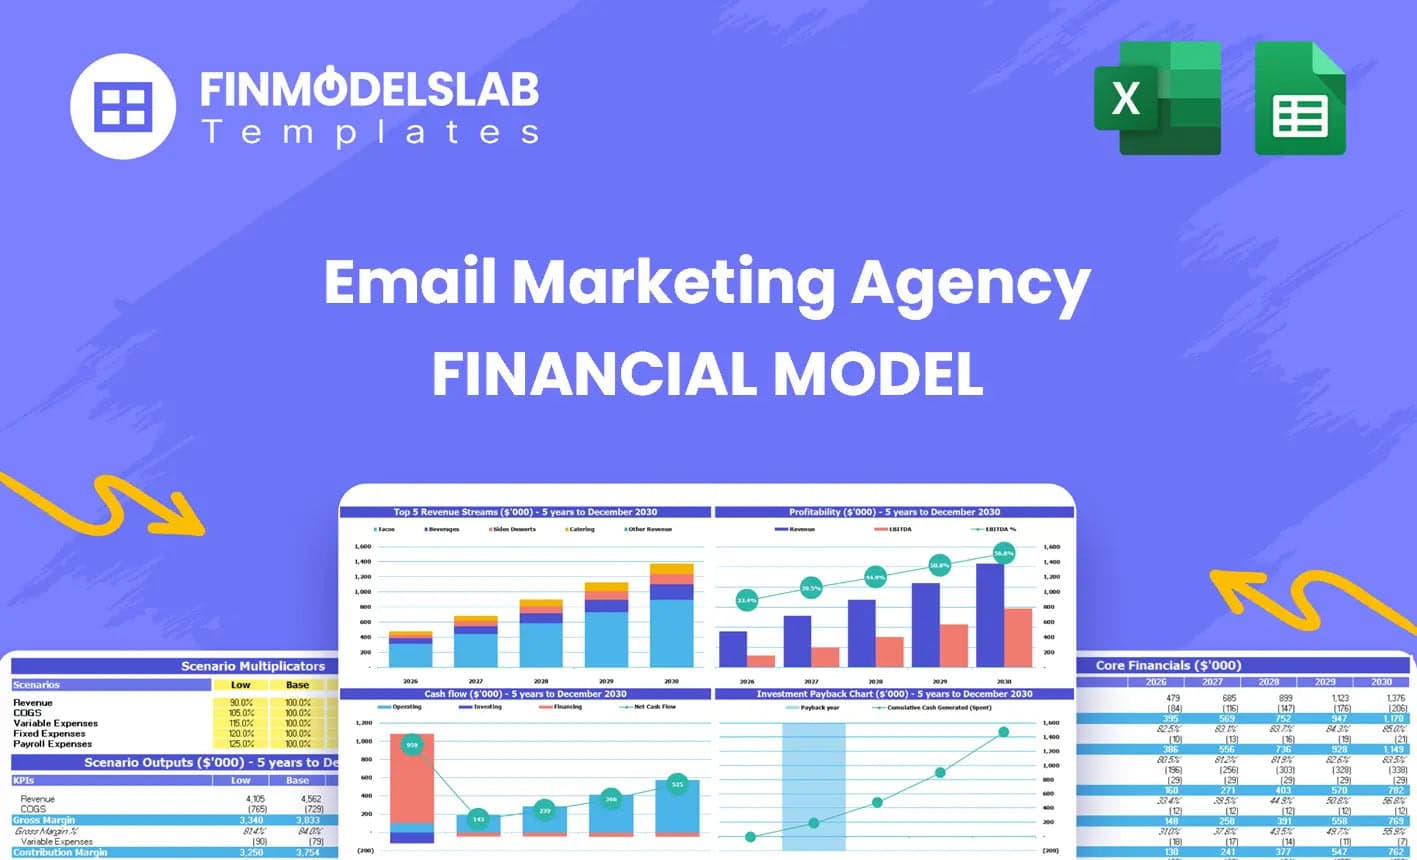
Email Marketing Agency Financial Model Excel Templ...
The Email Marketing Agency Financial Model helps founders, agency owners, consultants, analysts, and... Read more
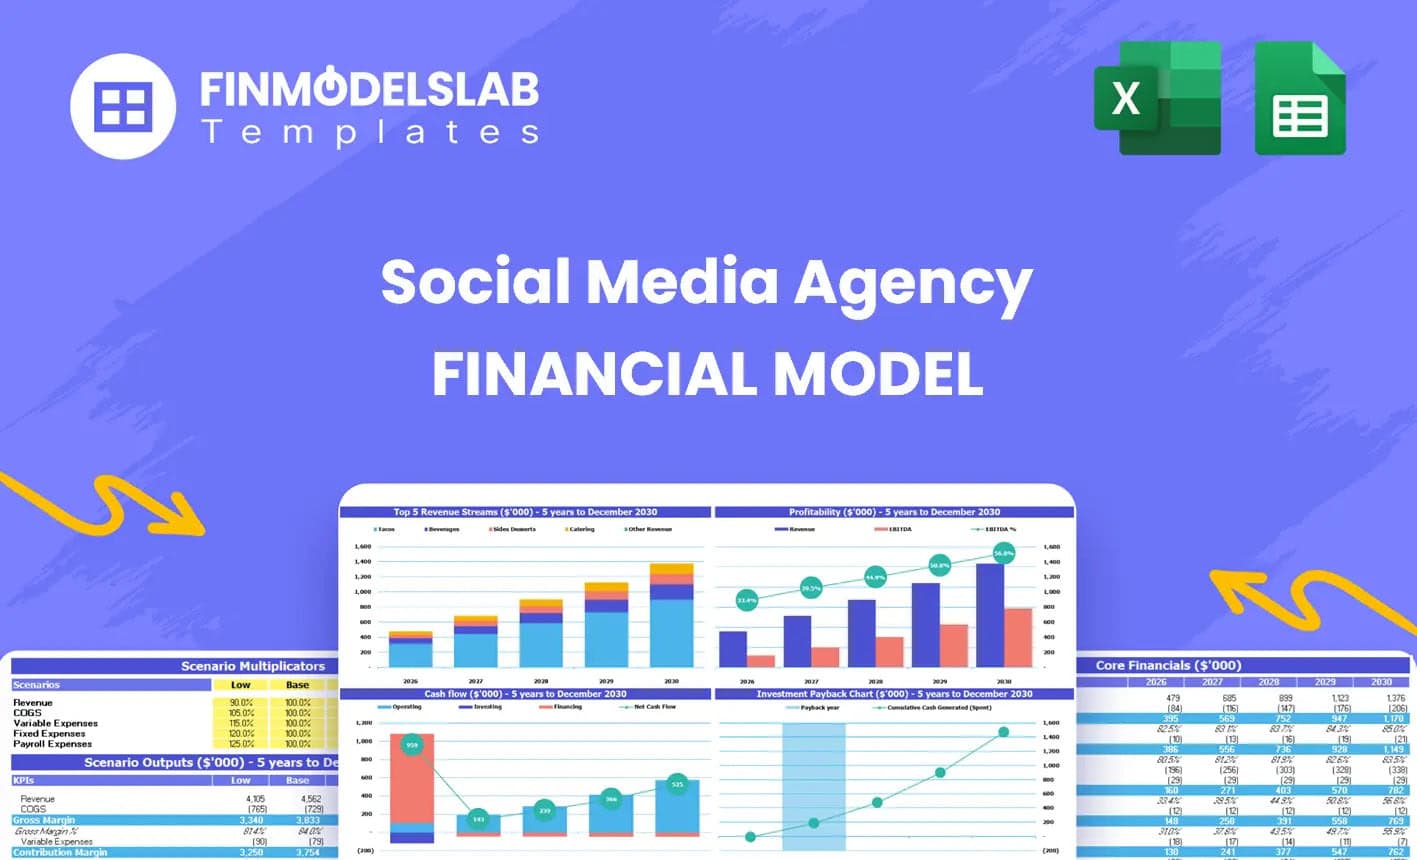
Social Media Agency Financial Model Excel Template
The Social Media Agency Financial Model helps users turn an agency concept, launch plan, or growth s... Read more

Photography Studio Financial Model Excel Template
The Photography Studio Financial Model helps users turn a studio concept into a structured, editable... Read more

Bookkeeping Agency Finance Model Excel Template
A comprehensive editable, MS Excel spreadsheet for tracking Bookkeeping services finances, including... Read more

Social Media Marketing Agency Finance Model 5 Year...
Comprehensive editable, 5-year 3 statement MS Excel spreadsheets for tracking Social Media Service f... Read more

Digital Advertising Agency Finance Model Excel Tem...
A comprehensive editable 5 Year 3 Statement, MS Excel spreadsheet for tracking Digital Advertising A... Read more
You must log in to submit a review.