
0 ITEMS

Gas Station Financial Model Excel Template
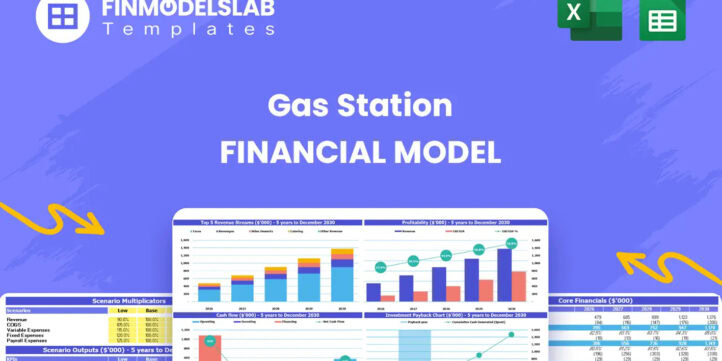
The Gas Station Financial Model Financial Model Template helps entrepreneurs, business owners, consultants, analysts, and founders turn a fuel retail concept into a structured financial forecast. Instead of starting with a blank spreadsheet, users get a ready-to-use model built around the real financial drivers of a gas station, including fuel sales, convenience store revenue, food and beverage sales, startup costs, operating expenses, payroll, cash flow, profitability, and break-even analysis. It is designed to support planning for a new station, evaluating an acquisition, preparing a funding request, or improving the financial structure of an existing service station. This template gives users a practical way to connect operating assumptions with financial outcomes. You can model revenue assumptions based on daily visitors, conversion rates, repeat customers, fuel purchases, in-store categories, and growth expectations. The model also helps organize major cost areas such as fuel cost of goods sold, inventory, staff wages, rent or lease costs, utilities, maintenance, insurance, payment processing, and other recurring expenses. By seeing how changes in traffic, pricing, margins, and expenses affect the forecast, users can make better decisions before committing capital. Built for financial planning, investor discussions, loan applications, and internal decision-making, the Gas Station Financial Model helps users evaluate whether the business can generate enough revenue and gross profit to support its cost structure. It includes a professional approach to forecasting revenue, expenses, profit, cash flow, and funding needs over multiple years. Users can review profitability trends, test different scenarios, estimate break-even timing, and understand how much startup investment may be required before launch. The template is fully customizable and suitable for both Excel and Google Sheets, making it useful for solo founders, management teams, advisors, and consultants working with clients. Editable assumptions allow the forecast to be tailored to a specific location, operating strategy, fuel mix, store format, staffing plan, supplier terms, and financing structure. With built-in outputs, charts, dashboards, and reporting views, this financial model template helps present a clearer financial story to banks, investors, partners, and stakeholders while saving time compared to building a model from scratch.


Financial Model Overview
The Gas Station Financial Model Financial Model Template is a ready-to-use planning tool designed to help users evaluate the financial performance of a fuel retail business with convenience store operations. A gas station has several moving parts, including fuel volume, fuel margins, store traffic, in-store product sales, staffing, inventory, utilities, maintenance, financing, and working capital needs. This template brings those drivers into one structured model so entrepreneurs, business owners, consultants, analysts, and founders can forecast revenue, expenses, cash flow, profitability, and funding requirements with more clarity. It is useful for preparing a business plan, supporting a loan application, presenting to investors, comparing strategic options, or managing an existing station. Instead of relying on rough estimates, users can input assumptions that reflect their location, customer traffic, product mix, operating schedule, payroll plan, supplier costs, and growth targets, then review the financial outputs in a professional format.
All-in-One Dashboard
The all-in-one dashboard gives users a central view of the most important inputs and outputs in the Gas Station Financial Model. This section is useful because gas station planning requires quick access to both operational assumptions and financial results, including customer traffic, conversion rates, fuel sales, store revenue, gross margin, operating expenses, EBITDA, net profit, and cash position. Users can adjust key assumptions and see how the model responds, helping them understand the relationship between daily operations and long-term financial performance. For a founder preparing a business plan, the dashboard provides a practical starting point for reviewing whether the station can generate enough sales to cover expenses and reach profitability. For an existing operator, it can help monitor the impact of changes in pricing, product mix, supplier costs, or staffing. The dashboard also supports stakeholder communication by condensing complex calculations into a more accessible view, making it easier to explain the business case to lenders, partners, advisors, or investors.
Low, Base, and High Scenario Analysis
The low, base, and high scenario analysis section helps users compare different possible outcomes for the gas station under varying market and operating conditions. A fuel retail business can be affected by traffic patterns, local competition, fuel margin changes, supplier pricing, wage increases, customer loyalty, and seasonal demand, so a single forecast is rarely enough for serious planning. This component allows users to test conservative, expected, and optimistic assumptions across the model, such as lower daily visitors, stronger convenience store conversion, higher fuel costs, reduced gross margins, or faster customer growth. The outputs help show how revenue, expenses, EBITDA, net profit, and cash flow may change under each case. This is valuable for decision-making because it helps users prepare contingency plans, set realistic expectations, and understand downside risk before investing. For funding discussions, scenario analysis also demonstrates that the business plan has been stress-tested rather than built on a single best-case assumption.
Professional Charts
The professional charts section turns the financial forecast into clear visual outputs that can be used for internal reviews, investor presentations, lender discussions, and strategic planning. Gas station financial models often include many connected assumptions, and charts help users quickly interpret trends that may be harder to understand in raw spreadsheet form. This component may visualize revenue growth, gross profit, EBITDA, net income, cash flow, operating expenses, margin trends, and business performance over the forecast period. By showing key metrics graphically, the model helps users communicate the financial story of the station in a cleaner and more persuasive way. This is especially useful when presenting to people who do not want to review every worksheet or formula. Professional charts can also help identify patterns, such as whether profit growth is being driven by fuel sales, convenience store revenue, cost control, or margin improvement. For planning purposes, visual reporting supports faster interpretation and better decisions.
ROE Components and DuPont Analysis
The ROE components and DuPont analysis section helps users understand the drivers behind return on equity rather than looking only at the final percentage. In a gas station business, profitability and returns can be influenced by net margin, asset efficiency, financing structure, capital investment, and the ability to convert traffic into profitable sales. DuPont analysis breaks return on equity into more meaningful parts, helping users see whether returns are being generated through strong margins, effective use of assets, or leverage. Inputs and outputs may include net income, revenue, total assets, equity, asset turnover, profit margin, and financial leverage. This is useful for investors, owners, and analysts because it provides a more detailed view of business performance and investment efficiency. A high return may look attractive, but DuPont analysis helps explain why that return exists and whether it is sustainable. For a gas station acquisition, expansion, or startup plan, this section can support deeper financial due diligence and stronger investor conversations.
Revenue Inputs
The revenue inputs section is where users define the operating assumptions that drive top-line performance in the Gas Station Financial Model. A gas station typically earns revenue from multiple streams, including fuel sales, snacks, drinks, coffee, prepared food, and other convenience store categories. This component may use assumptions such as daily visitors, customer conversion rate, repeat customer percentage, average transaction value, gallons sold, fuel pricing, in-store purchase rates, product category mix, and annual growth. By separating the key drivers, the model helps users understand which assumptions have the greatest influence on revenue and profitability. For example, a small increase in store conversion or coffee sales may improve margins because many in-store products carry higher profitability than fuel. This section is especially useful for building a location-specific plan, because traffic volume, commuter behavior, surrounding competition, and local purchasing habits can vary widely. Clear revenue inputs also make the forecast easier to explain, audit, and update as new information becomes available.
Bank-Ready Reports
The bank-ready reports section organizes financial outputs in a format that is easier to share with lenders, investors, partners, and other stakeholders. Gas station projects often require outside funding for land, equipment, pumps, underground tanks, store fixtures, inventory, working capital, and operating reserves, so clear reporting is essential. This component may include forecasted profit and loss statements, cash flow statements, balance sheet outputs, monthly or annual summaries, debt service views, and key financial metrics. The purpose is to help users present their plan in a professional, lender-friendly structure instead of providing disconnected assumptions or informal calculations. Banks and investors typically want to understand revenue logic, expense structure, profit potential, liquidity, repayment capacity, and risk. By consolidating the model’s outputs into organized reports, this section supports funding preparation and improves the quality of financial communication. It also saves time for consultants and analysts who need polished outputs for business plans, pitch decks, feasibility studies, or loan packages.
Revenue Breakdown
The revenue breakdown section gives users a more detailed view of how each revenue stream contributes to total sales and profitability. In a gas station, total revenue can be misleading if fuel sales dominate the top line but produce lower margins than convenience store categories. This component helps separate fuel sales from snacks, drinks, coffee, prepared food, and other retail items so users can evaluate the mix of revenue by category. Inputs may include product-specific pricing, customer purchase behavior, transaction frequency, sales volume, margin assumptions, and growth rates. Outputs may show revenue by stream, category contribution, margin impact, and the changing balance between fuel and in-store sales over time. This is important because many gas stations improve profitability by increasing higher-margin store purchases, optimizing inventory, expanding food and beverage offerings, or improving customer loyalty. A detailed revenue breakdown helps users identify which categories deserve more attention and where operational improvements may have the biggest financial effect.
KPI Dashboard
The KPI dashboard section focuses on the performance metrics that matter most for monitoring and improving a gas station business. While financial statements show the overall results, key performance indicators help users understand what is happening underneath those results. This component may track metrics such as daily visitors, conversion rate, average transaction value, repeat customer share, fuel sales volume, store sales per customer, gross margin, EBITDA margin, net profit margin, operating expense ratio, cash balance, payback period, and return on equity. It may also support comparison against industry benchmarks, helping users test whether their assumptions and projected performance are realistic. For owners and managers, the KPI dashboard can guide operational decisions such as adjusting staffing, improving product mix, renegotiating supplier terms, or launching promotions. For investors and lenders, it provides a concise view of business health and operating discipline. By bringing performance metrics together, the KPI dashboard makes the model more actionable and easier to review.
Startup Cost and Capital Expenditure Planning
The startup cost and capital expenditure planning section helps users estimate the initial investment required to open, acquire, or upgrade a gas station. This is a critical component because fuel retail businesses often require significant upfront spending before revenue begins. Inputs may include fuel pumps and dispensers, underground fuel tanks, point-of-sale systems, store fixtures, shelving, refrigeration units, signage, lighting, security systems, permits, licenses, professional fees, site preparation, initial inventory, deposits, pre-opening marketing, and working capital reserves. The outputs help users calculate total funding needs and separate one-time launch costs from ongoing operating expenses. This section is useful for budgeting because it reduces the chance of overlooking major capital items that can create funding gaps later. It also supports investor and lender discussions by showing how capital will be used and why the requested funding amount is justified. For expansion planning, the same structure can help evaluate upgrades, new equipment, additional locations, or renovations.
Cash Flow Forecast and Liquidity Planning
The cash flow forecast and liquidity planning section helps users understand whether the gas station can maintain enough cash to operate, grow, and meet obligations over time. Profitability does not always mean liquidity, especially in a business with inventory purchases, supplier payments, payroll, debt service, taxes, seasonal traffic changes, and capital expenditures. This component may use inputs from revenue, cost of goods sold, operating expenses, payroll, capital spending, loan proceeds, debt repayment, tax assumptions, and working capital timing to project monthly and annual cash movement. Outputs may include opening cash balance, cash inflows, cash outflows, net cash flow, ending cash balance, minimum cash balance, and periods where additional funding may be needed. This is valuable for planning because it helps users identify cash crunches before they happen, evaluate the need for a line of credit, and decide how much reserve capital should be maintained. For lenders, a cash flow forecast also helps demonstrate repayment capacity and financial discipline.
File types:
Excel – Single-User: .xlsx
Excel – Multi-User: .xlsx
Similar ProductsOther customers were also interested in...


 Giorgos
Gas Station Financial Model – Dynamic 10 Year Fo...
Financial model presenting a business scenario of a Gas Station, which is either purchased or leased... Read more

 City Finance
EV Charging Station Finance Model
Provides a comprehensive analysis of the financial viability and potential returns on investment for... Read more

 CFO Templates
Retail Business Financial Model
The Retail Financial Plan is an all-inclusive financial planning template for the retail industry. W... Read more
 HenrySheykin
Grocery Store Financial Model Excel Template
The Grocery Store Financial Model helps entrepreneurs, founders, consultants, analysts, and retail b... Read more
Spa Financial Model Excel Template
The Spa Financial Model helps entrepreneurs, spa owners, consultants, analysts, and business planner... Read more

Gift Shop Financial Model Excel Template
The Gift Shop Financial Model helps users build a structured financial forecast for a retail gift st... Read more
Candy Store Financial Model Excel Template
The Candy Store Financial Model helps entrepreneurs and planners turn a retail confectionery concept... Read more
Bakery Financial Model Excel Template
The Bakery Financial Model helps entrepreneurs, bakery owners, consultants, analysts, and business p... Read more
Bike Shop Financial Model Excel Template
The Bicycle Shop Financial Model helps entrepreneurs, business owners, consultants, analysts, and fo... Read more
Flower Shop Financial Model Excel Template
The Flower Shop Financial Model helps entrepreneurs, florists, business owners, consultants, and ana... Read more
You must log in to submit a review.