
0 ITEMS

Budget vs Actual Excel Template
The Personal Budgeting App Financial Model Financial Model Template helps founders, entrepreneurs, consultants, analysts, and business planners turn a personal finance app concept into a structured five-year forecast. Instead of starting with a blank spreadsheet, users can work from a ready-to-use model built around the economics of a subscription-based budgeting app, including recurring revenue, user growth, conversion assumptions, churn, startup costs, operating expenses, payroll, cash flow, and profitability. It is designed to support business planning, funding preparation, internal budgeting, and strategic decision-making. This financial model template is especially useful for anyone preparing to launch or scale a personal budgeting app, expense tracking app, money management platform, or related fintech product. It gives users a practical way to estimate how the app may generate revenue through subscription tiers, premium plan activations, and future monetization opportunities while also accounting for the costs required to acquire users, maintain technology infrastructure, process payments, support customers, and operate the business. The model helps connect commercial assumptions with financial results so users can evaluate whether their pricing, marketing, and growth strategy can support sustainable profitability. The template also helps buyers understand the financial implications of their decisions before committing capital. Users can review startup investment needs, forecast monthly and annual cash flow, test low, base, and high scenarios, monitor profitability, and assess break-even timing. This is valuable for founders speaking with investors, lenders, or advisors because it provides organized assumptions, investor-friendly outputs, and a clearer view of expected financial performance. It can also help established app businesses compare growth plans, evaluate new pricing tiers, or prepare budgets for expansion. Built for Excel and Google Sheets, the Personal Budgeting App Financial Model is fully editable and structured for practical use. Users can update pricing, subscriber counts, conversion rates, churn, marketing spend, staffing, vendor costs, and other key assumptions to reflect their own strategy. The template combines detailed calculations with visual dashboards and financial reports, making it easier to identify risks, evaluate profitability, manage liquidity, and make better decisions with a complete financial planning framework.
Financial Model Overview
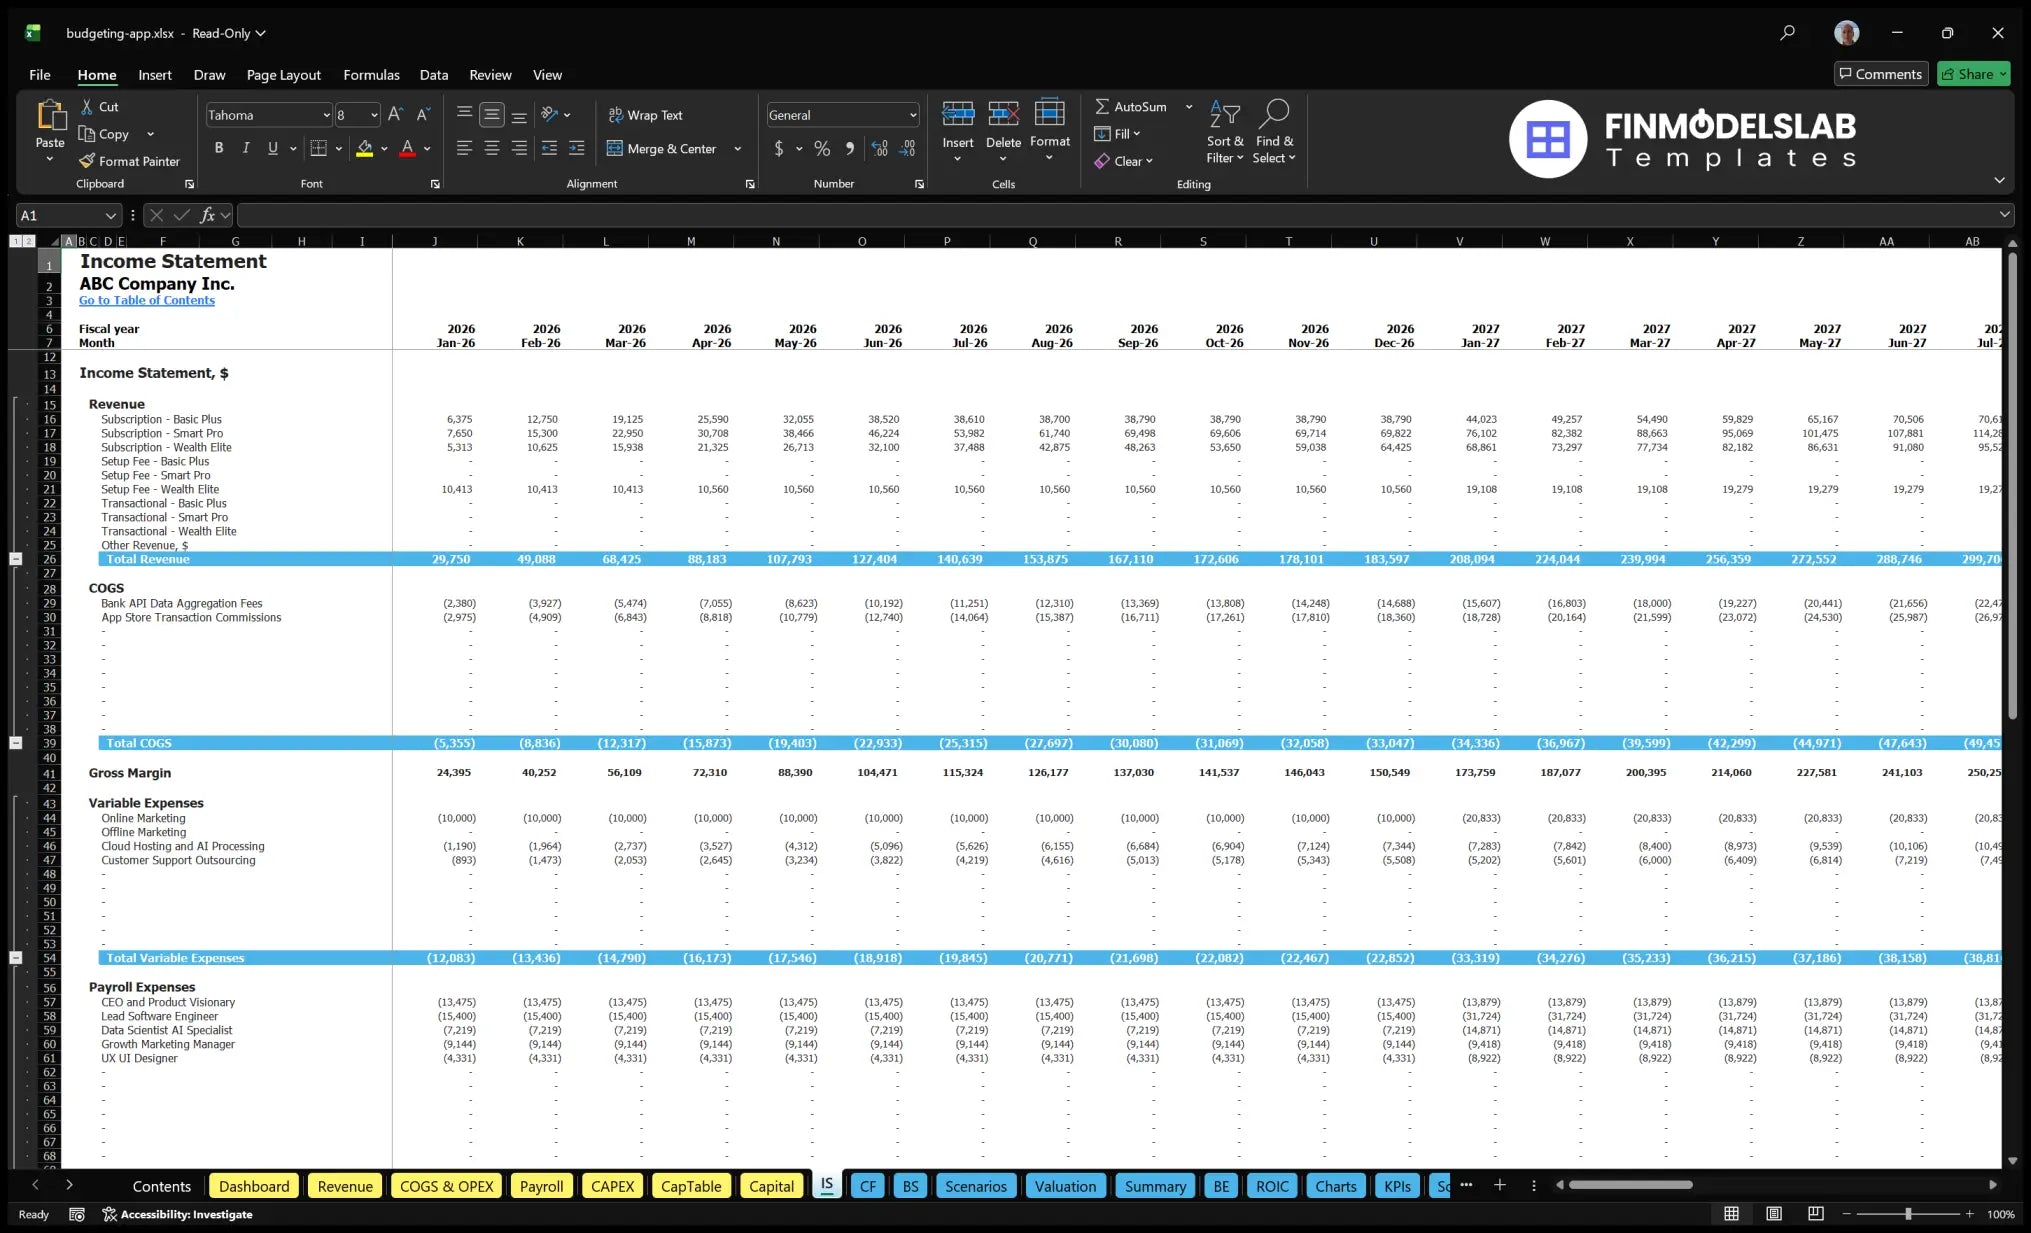
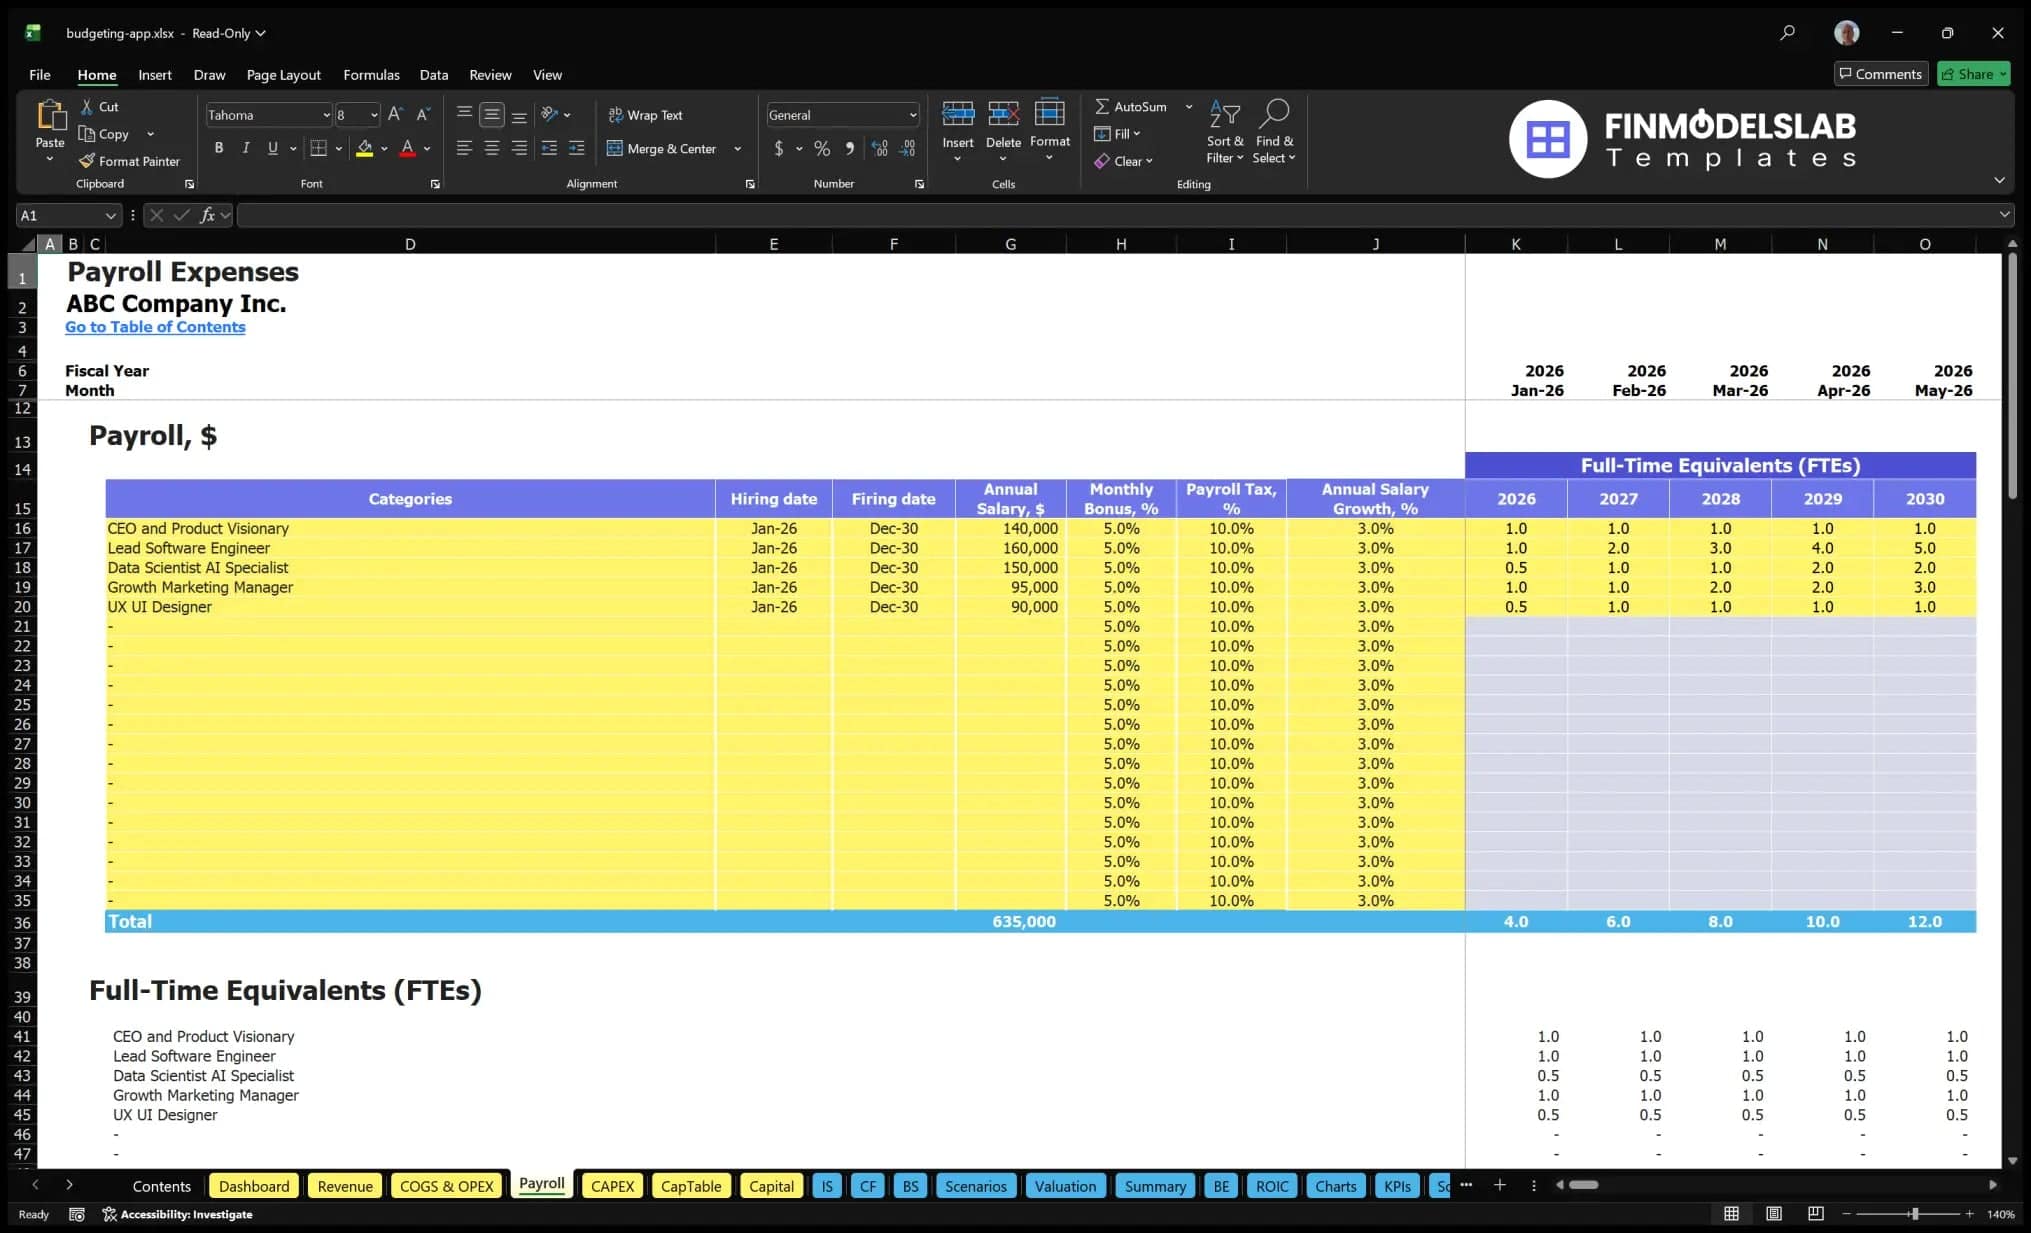
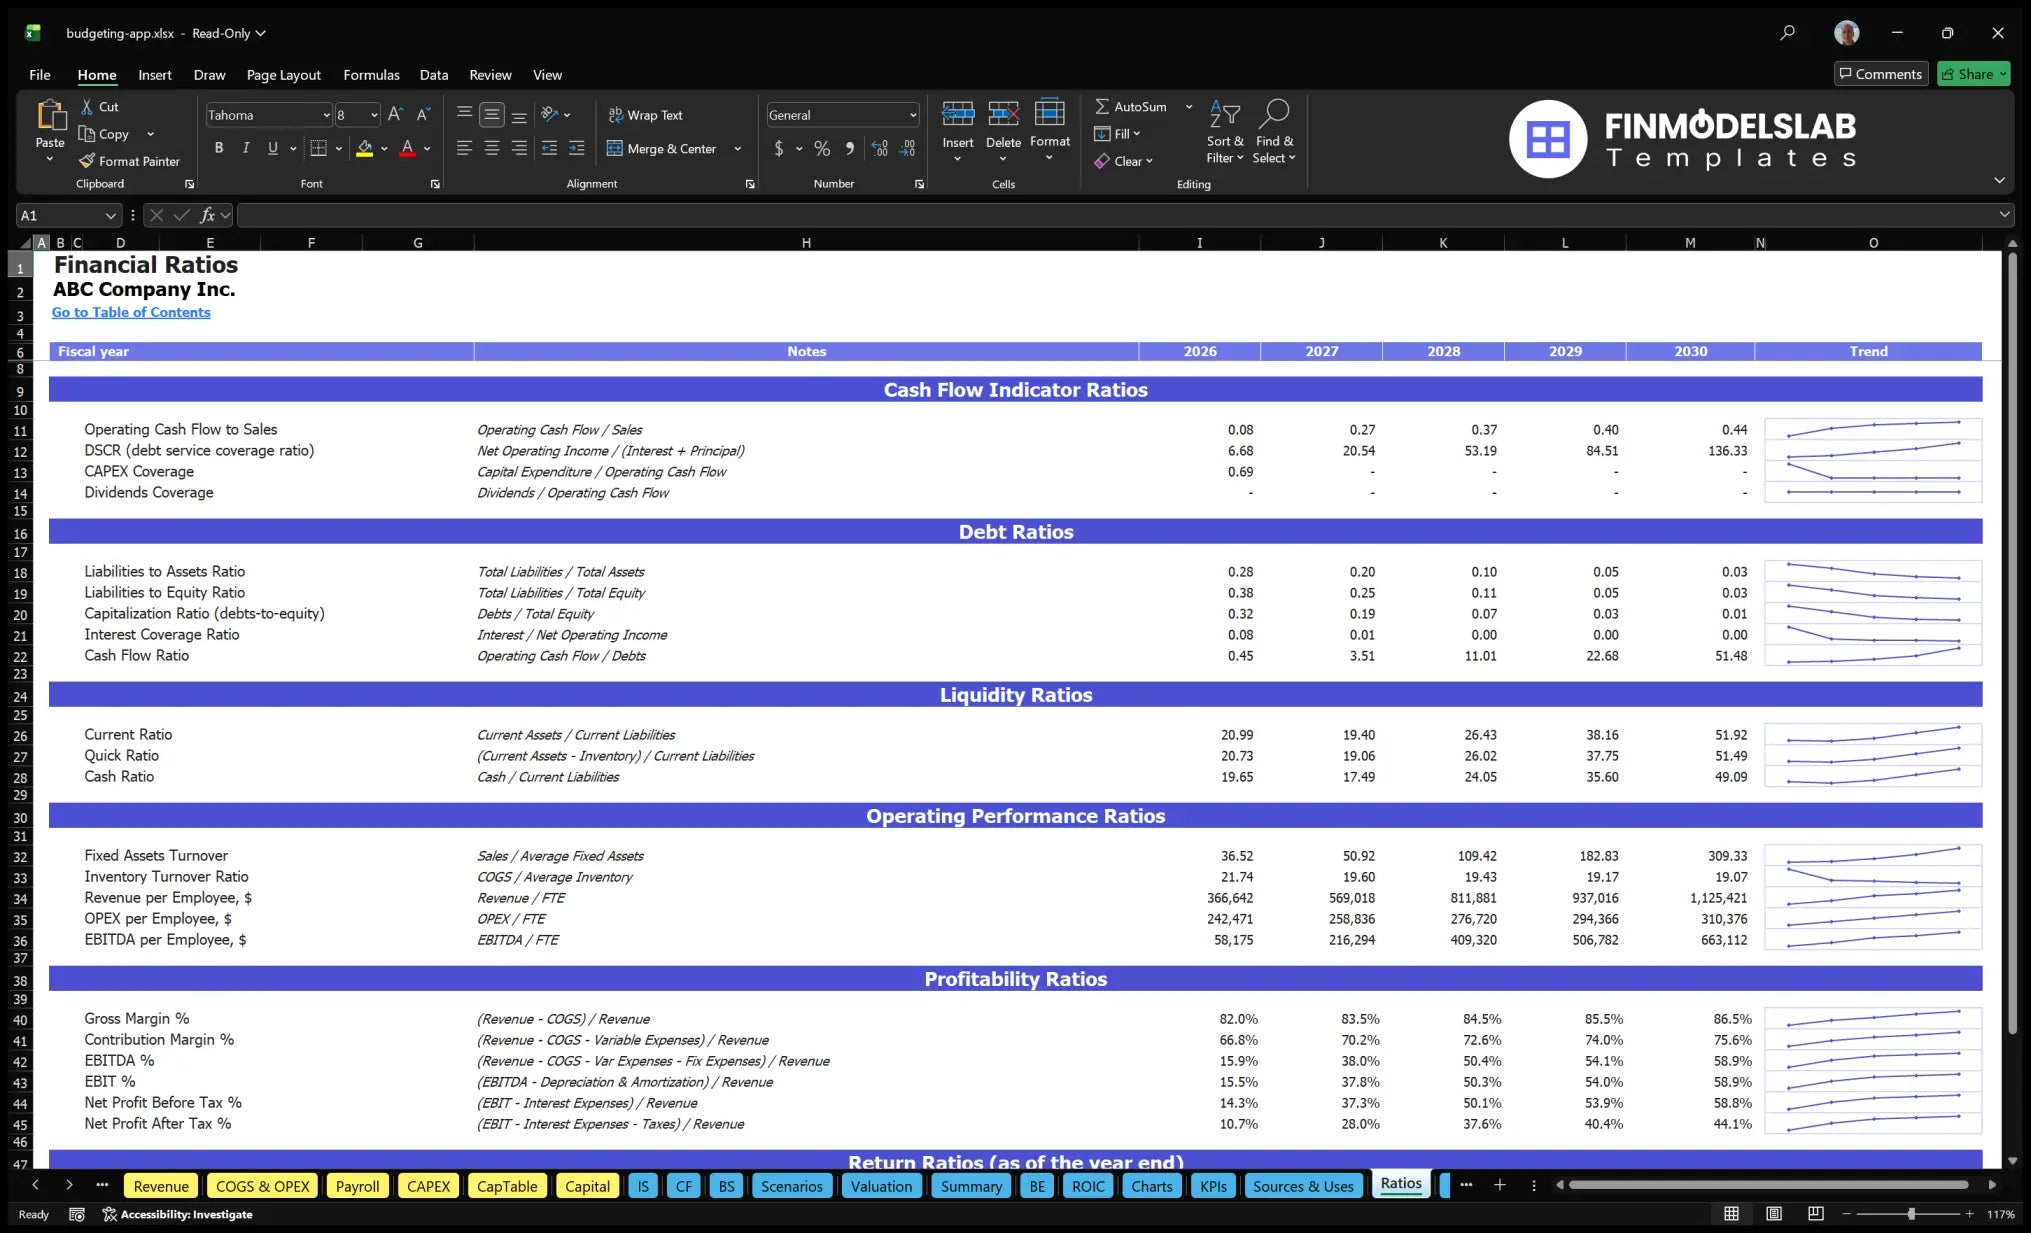
The Personal Budgeting App Financial Model Financial Model Template gives founders, entrepreneurs, consultants, analysts, and business planners a structured way to evaluate the financial potential of a subscription-based personal finance app. It is built to help users forecast how a budgeting app may perform over a five-year period by connecting user growth, pricing tiers, conversion rates, churn, startup costs, operating expenses, payroll, cash flow, and profitability in one organized model. For a personal budgeting app, financial planning requires more than estimating app downloads; users need to understand how many free users convert to paid subscribers, how long customers stay, how marketing spend affects acquisition, how app store commissions and bank API costs impact margins, and when the business can cover its fixed and variable expenses. This template provides a ready-to-use framework that can be customized for a new startup, an app expansion plan, a pitch deck, a funding request, or an internal budget. With editable assumptions, automated calculations, professional outputs, and compatibility with Excel and Google Sheets, it helps replace guesswork with a practical financial planning tool designed for decision-making and stakeholder communication.
All-in-One Dashboard
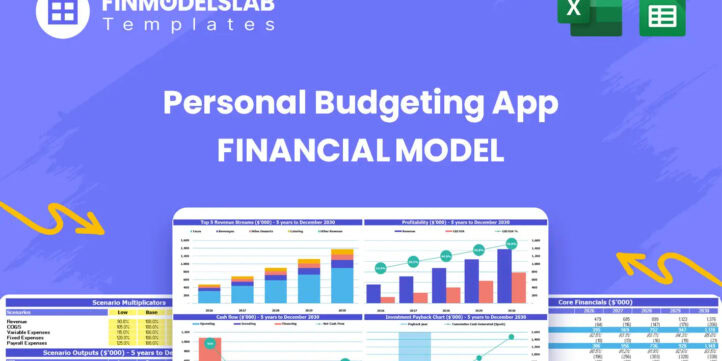
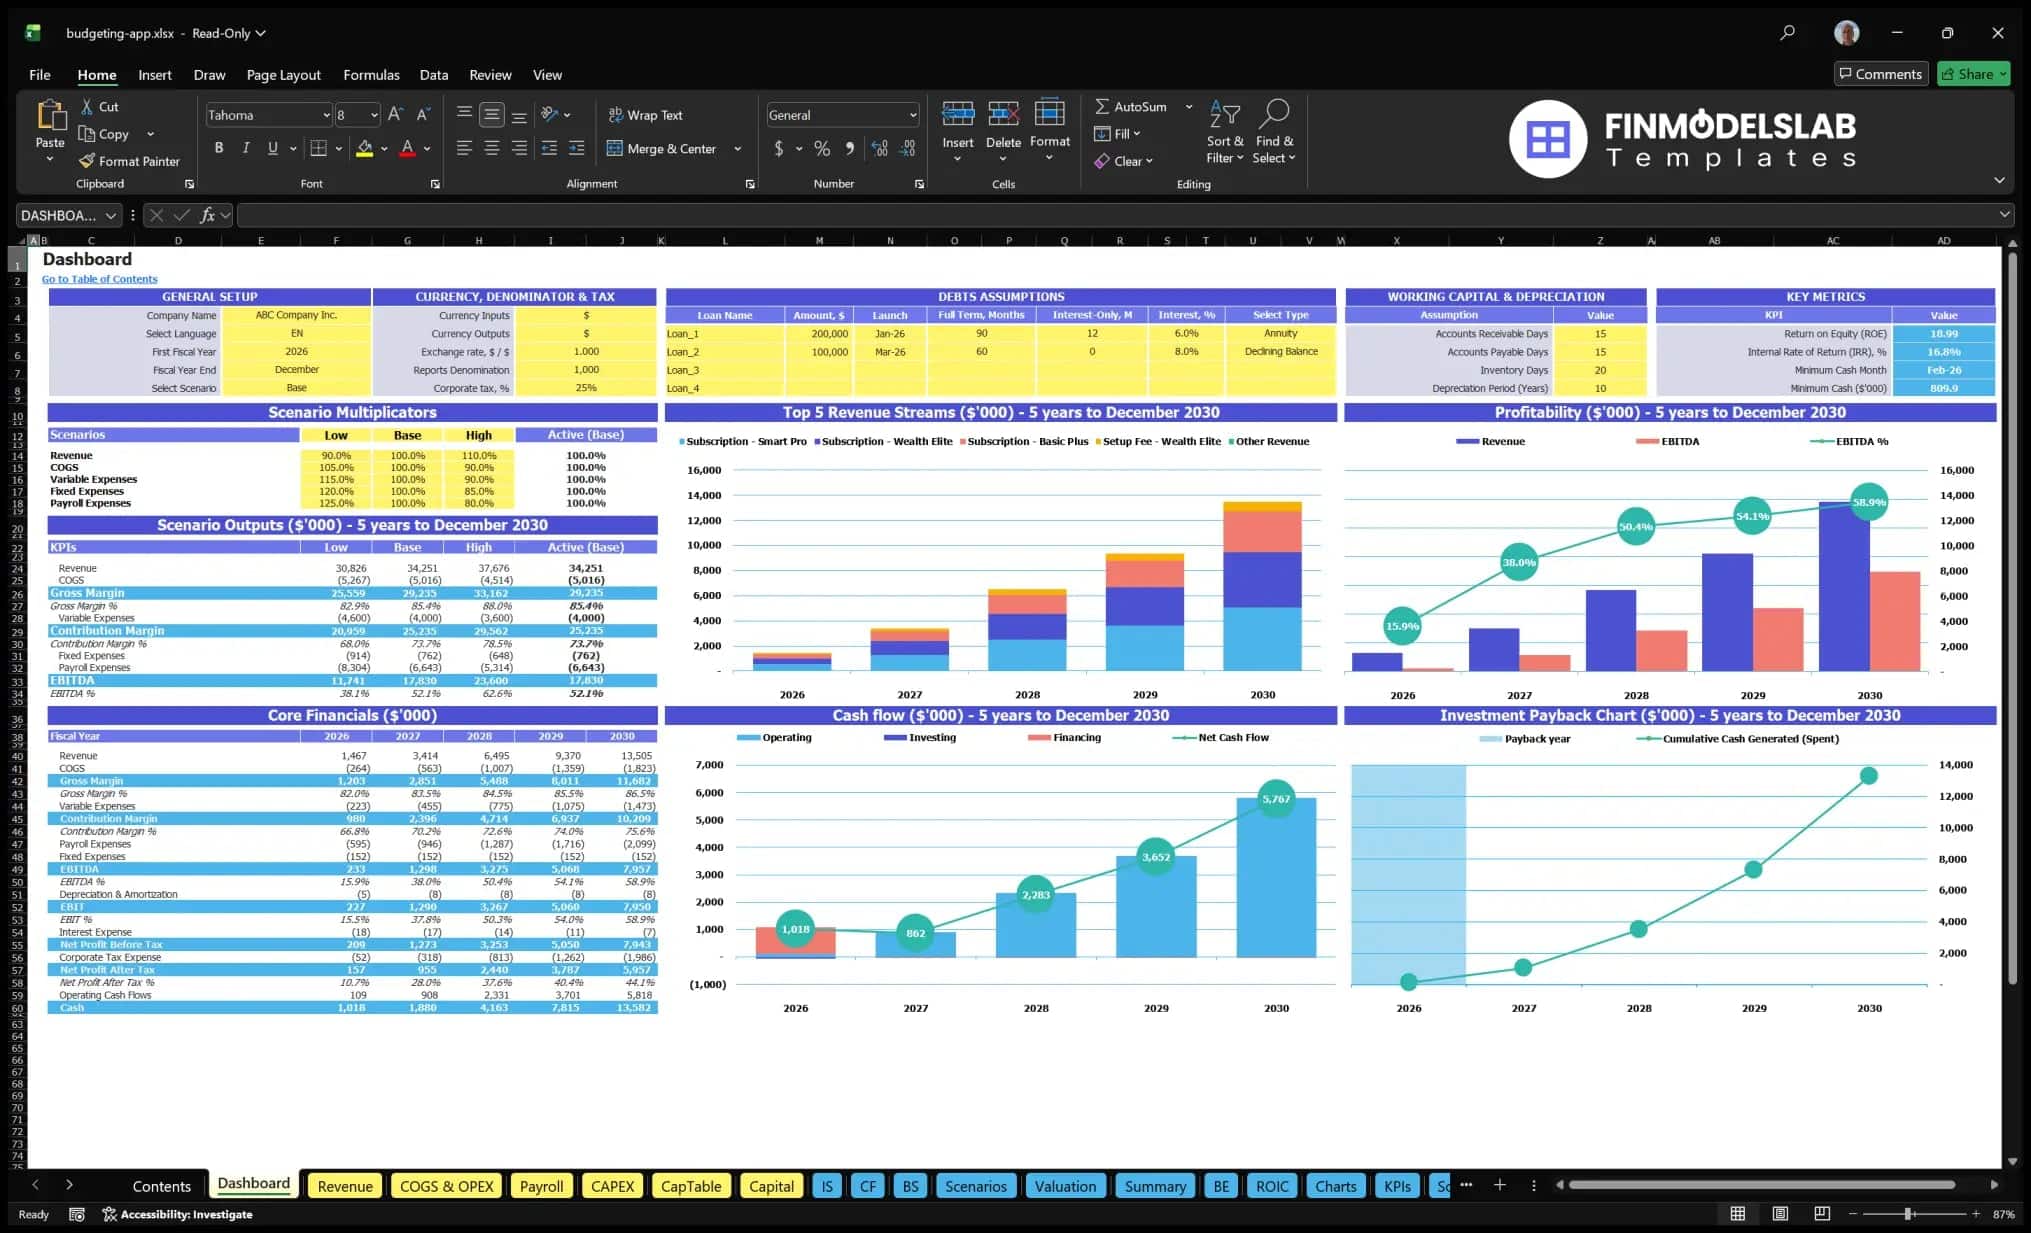
The all-in-one dashboard gives users a centralized view of the most important inputs and outputs in the Personal Budgeting App Financial Model. This section is designed to help users quickly understand how the business plan translates into financial performance without searching through multiple worksheets or disconnected calculations. Key inputs may include launch timing, pricing assumptions, subscription tiers, subscriber growth, trial-to-paid conversion rates, churn, customer acquisition costs, payroll, operating expenses, and capital investment requirements. The dashboard then summarizes the outputs that matter most for planning and funding, such as projected revenue, gross profit, EBITDA, net income, cash balance, break-even timing, payback period, and return metrics. For a personal budgeting app, this is especially useful because management decisions often depend on the interaction between user acquisition, recurring revenue, retention, and technology costs. By bringing core assumptions and financial results into one view, the dashboard helps founders and stakeholders see whether the model is financially viable, where the key risks are, and which assumptions should be adjusted before presenting the plan to investors, lenders, or internal decision-makers.
Low Base High Scenario Analysis
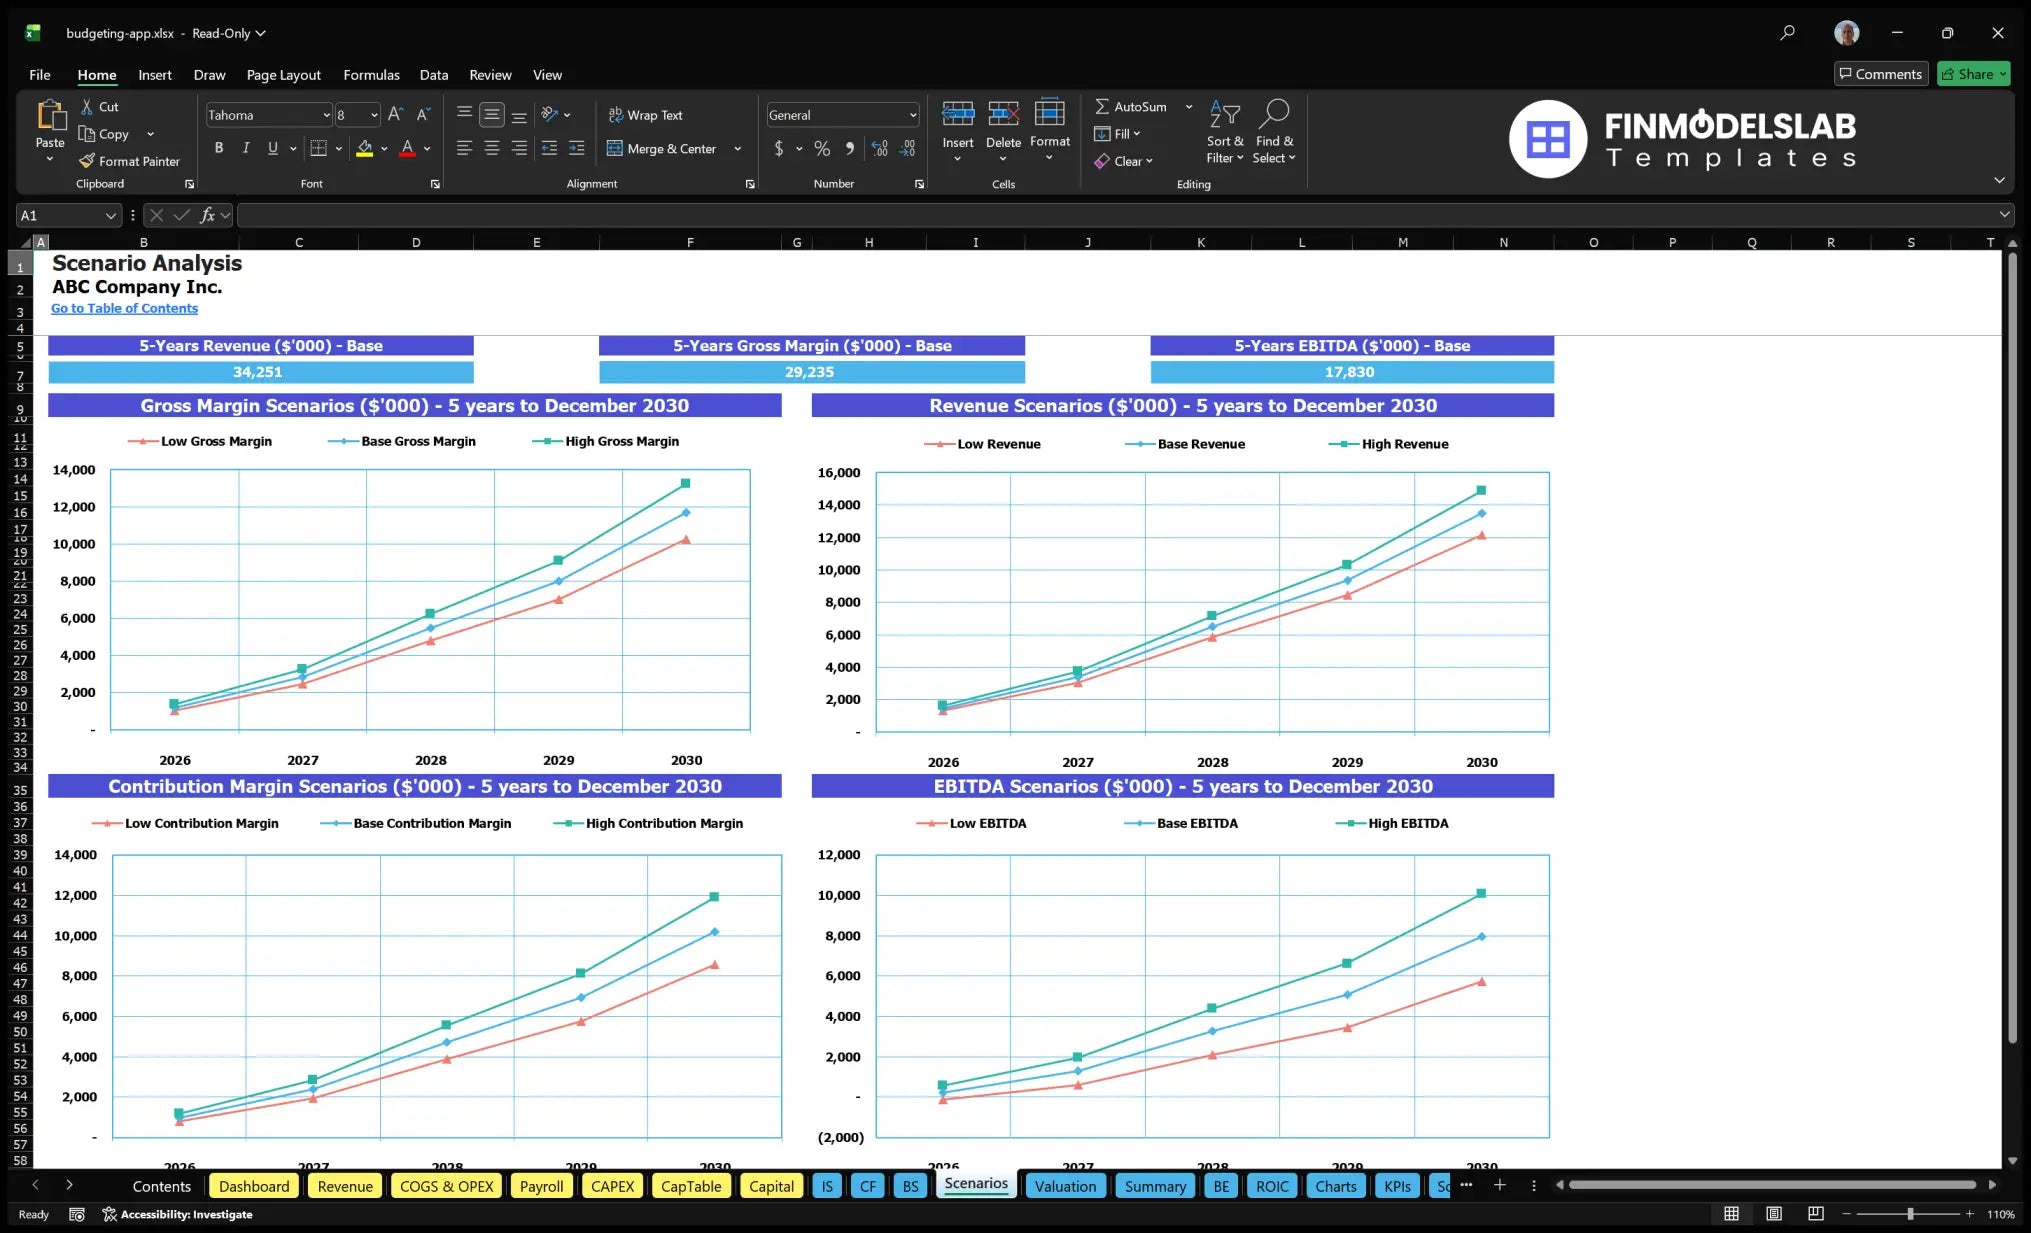
The low, base, and high scenario analysis section helps users evaluate how the personal budgeting app may perform under different market and operating conditions. Rather than relying on a single forecast, this component allows users to compare conservative, expected, and optimistic outcomes by adjusting assumptions such as marketing spend, customer acquisition cost, conversion rate, monthly churn, subscription pricing, app store fees, bank API costs, staffing levels, and customer support needs. The outputs may show changes in revenue, gross margin, EBITDA, cash flow, funding needs, break-even timing, and investor return metrics across each scenario. This is important for a personal budgeting app because growth can vary significantly depending on onboarding quality, market competition, financial wellness trends, paid advertising efficiency, and user willingness to upgrade to premium features. Scenario analysis helps users stress-test the plan, identify the assumptions that have the greatest impact on financial results, and prepare more credible conversations with investors or lenders. It also supports better decision-making by showing what happens if customer growth is slower than expected, acquisition costs rise, churn increases, or a higher marketing budget creates faster subscriber growth.
Professional Charts
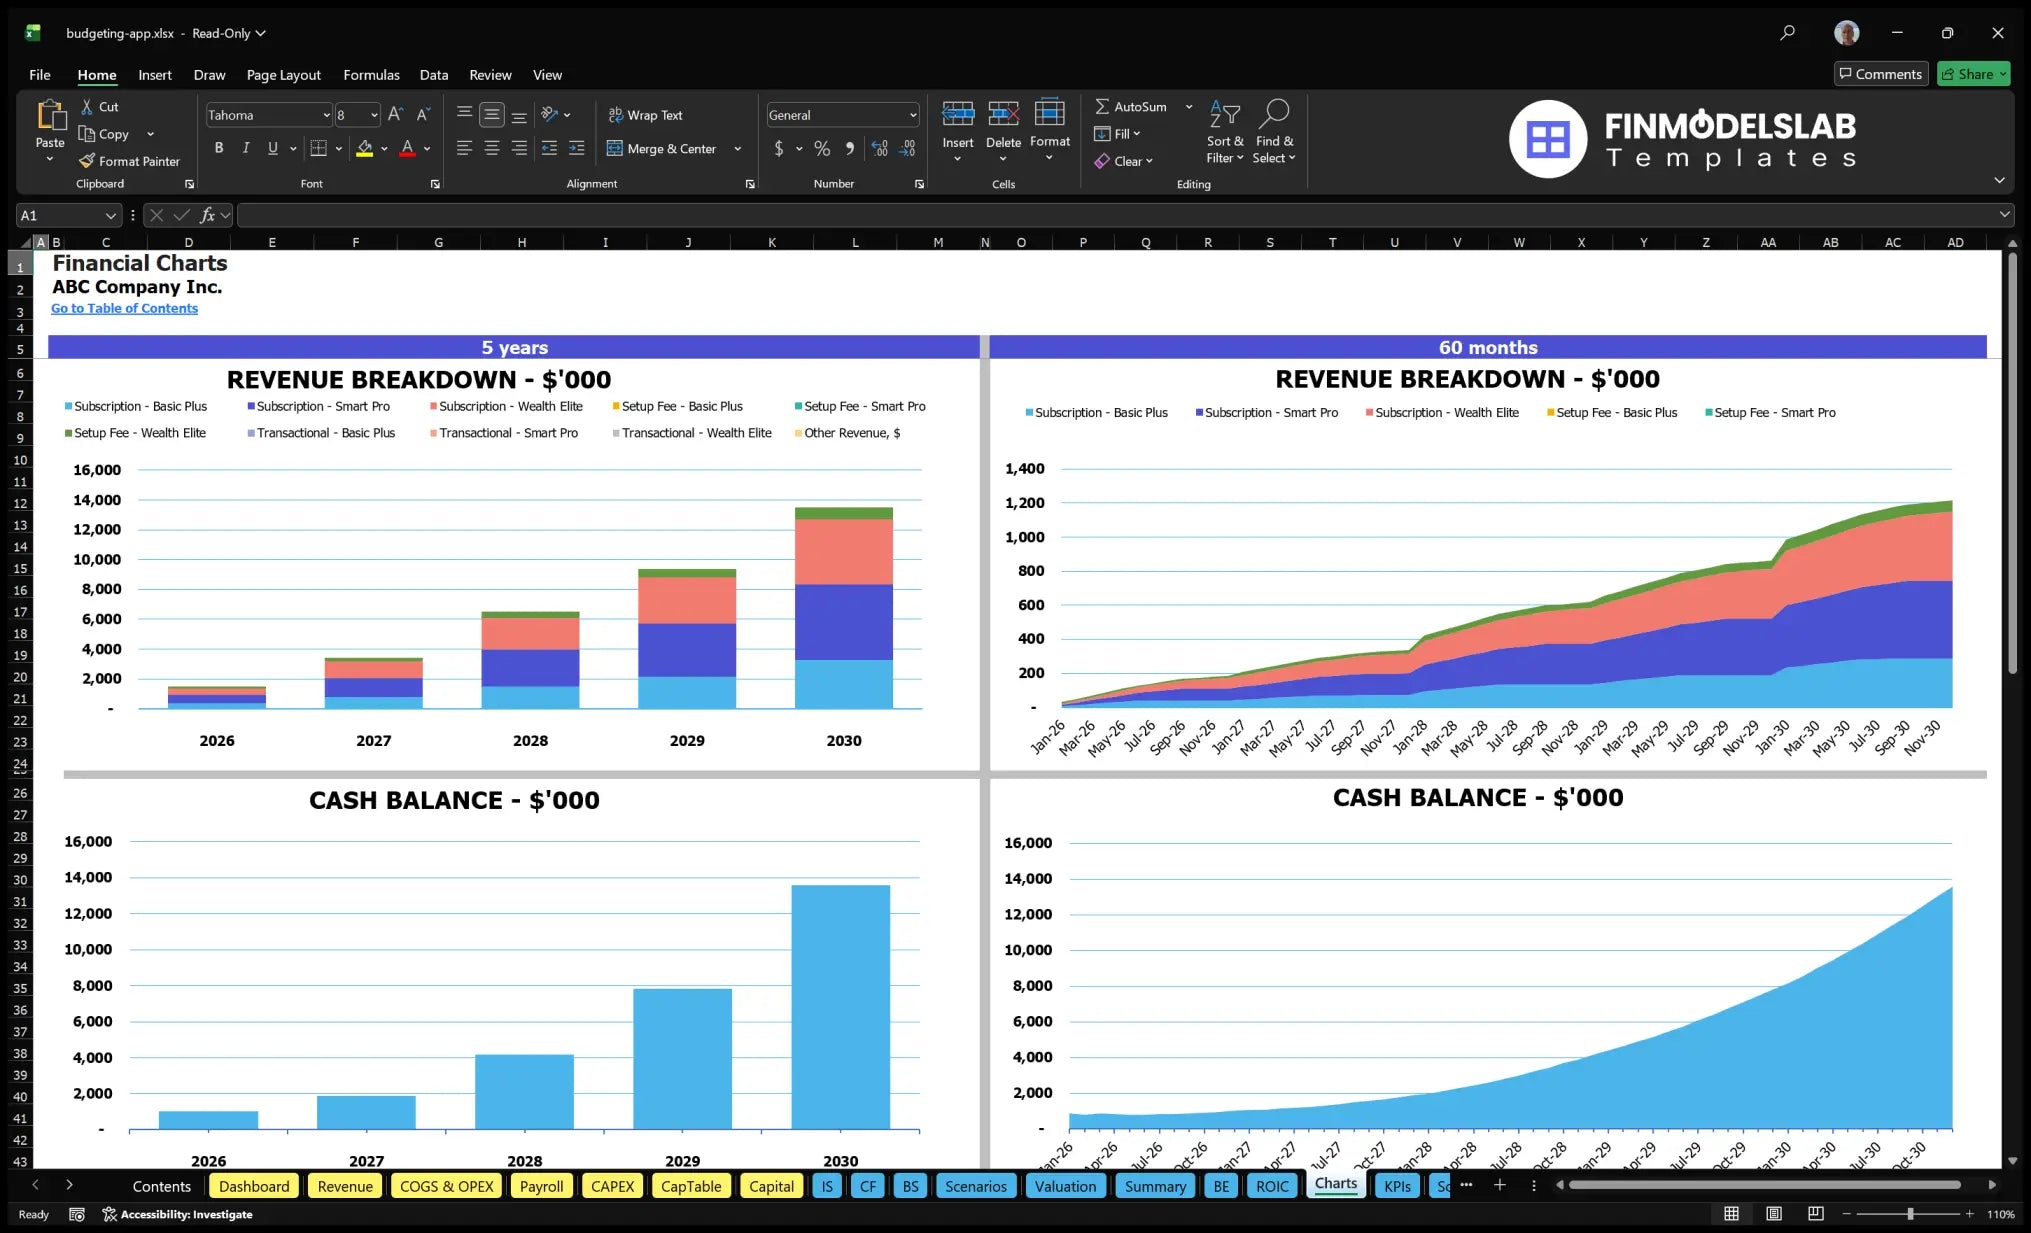
The professional charts section converts the financial model’s calculations into presentation-ready visuals that make the app’s financial story easier to communicate. Charts may display revenue growth, recurring subscription income, cash balance, EBITDA, net profit, subscriber growth, cost structure, margin development, and scenario comparisons over the forecast period. For a personal budgeting app, visual reporting is valuable because investors and stakeholders often want to understand the relationship between user growth, monetization, profitability, and cash requirements quickly. Instead of reviewing rows of numbers, users can present clear graphs that show how revenue scales from subscription tiers, how profitability improves as the subscriber base grows, and how cash flow behaves during the early launch and growth stages. The charting component can support pitch decks, lender meetings, board updates, internal planning sessions, and business plan documents. It also helps users spot trends, pressure points, and inconsistencies in the forecast. When the model assumptions are updated, the charts can reflect those changes, giving users a more dynamic and practical way to communicate financial projections with a clean, professional format.
ROE Components and DuPont Analysis
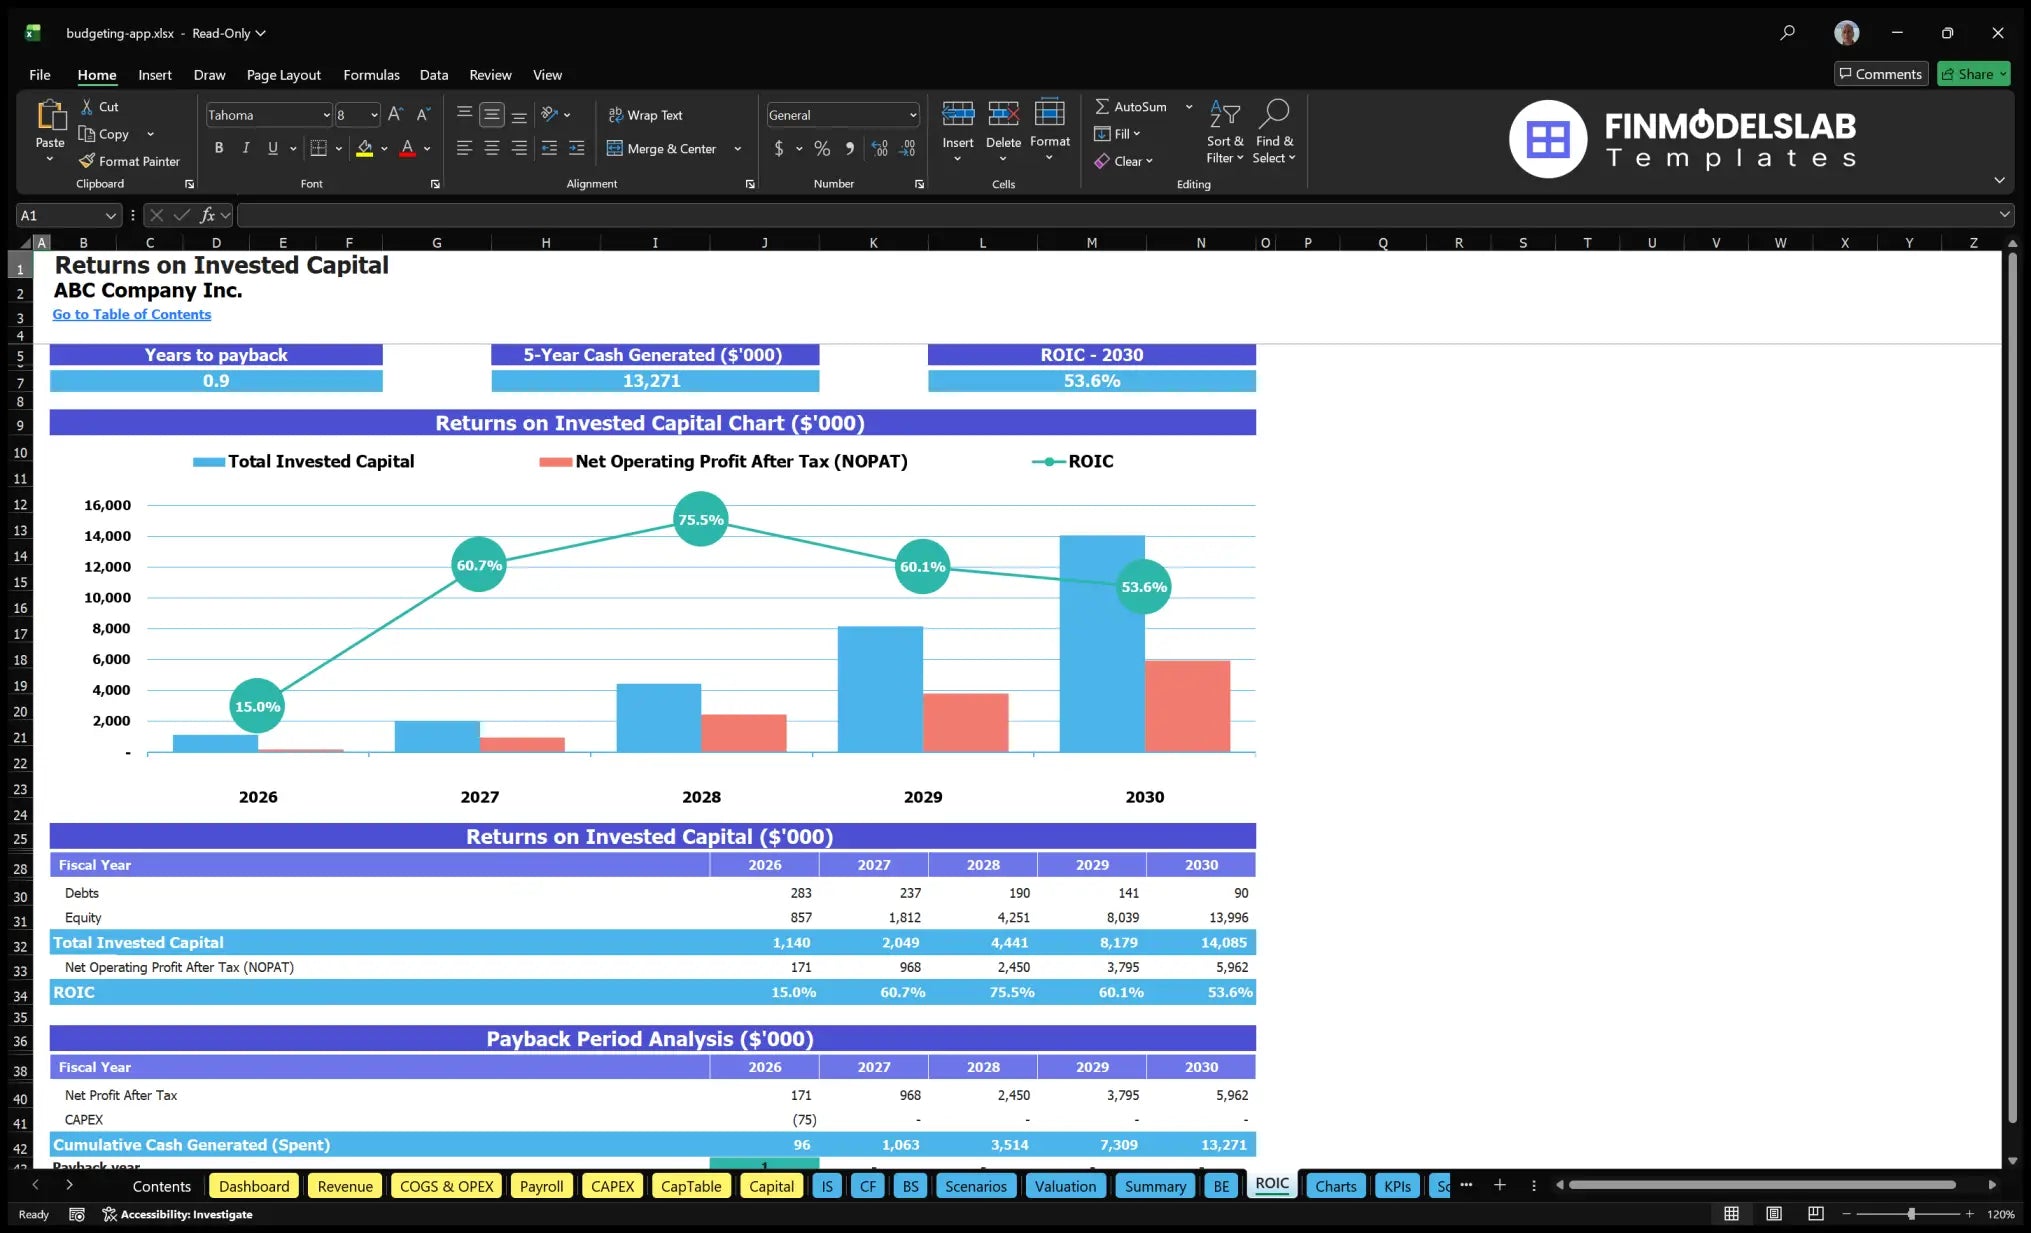
The ROE components and DuPont analysis section helps users understand the drivers behind return on equity rather than viewing investor return as a single isolated figure. This component breaks return on equity into underlying financial drivers such as profitability, asset efficiency, and leverage, helping users see how margins, operating performance, asset use, and financing structure influence overall returns. Inputs may include net income, revenue, total assets, equity investment, liabilities, and forecasted financial statement balances. Outputs can include return on equity, net profit margin, asset turnover, equity multiplier, and related ratio trends over time. For a personal budgeting app, this analysis is useful because the business may be asset-light compared with traditional businesses, but it still requires capital for development, infrastructure, marketing, and staffing. DuPont analysis helps founders and investors evaluate whether returns are being generated from strong operating margins, efficient scaling, or financing assumptions. It can also reveal whether growth is creating genuine economic value or simply increasing revenue without improving profitability. This makes the section helpful for investor discussions, strategic reviews, and financial performance analysis as the app moves from launch to scale.
Revenue Inputs
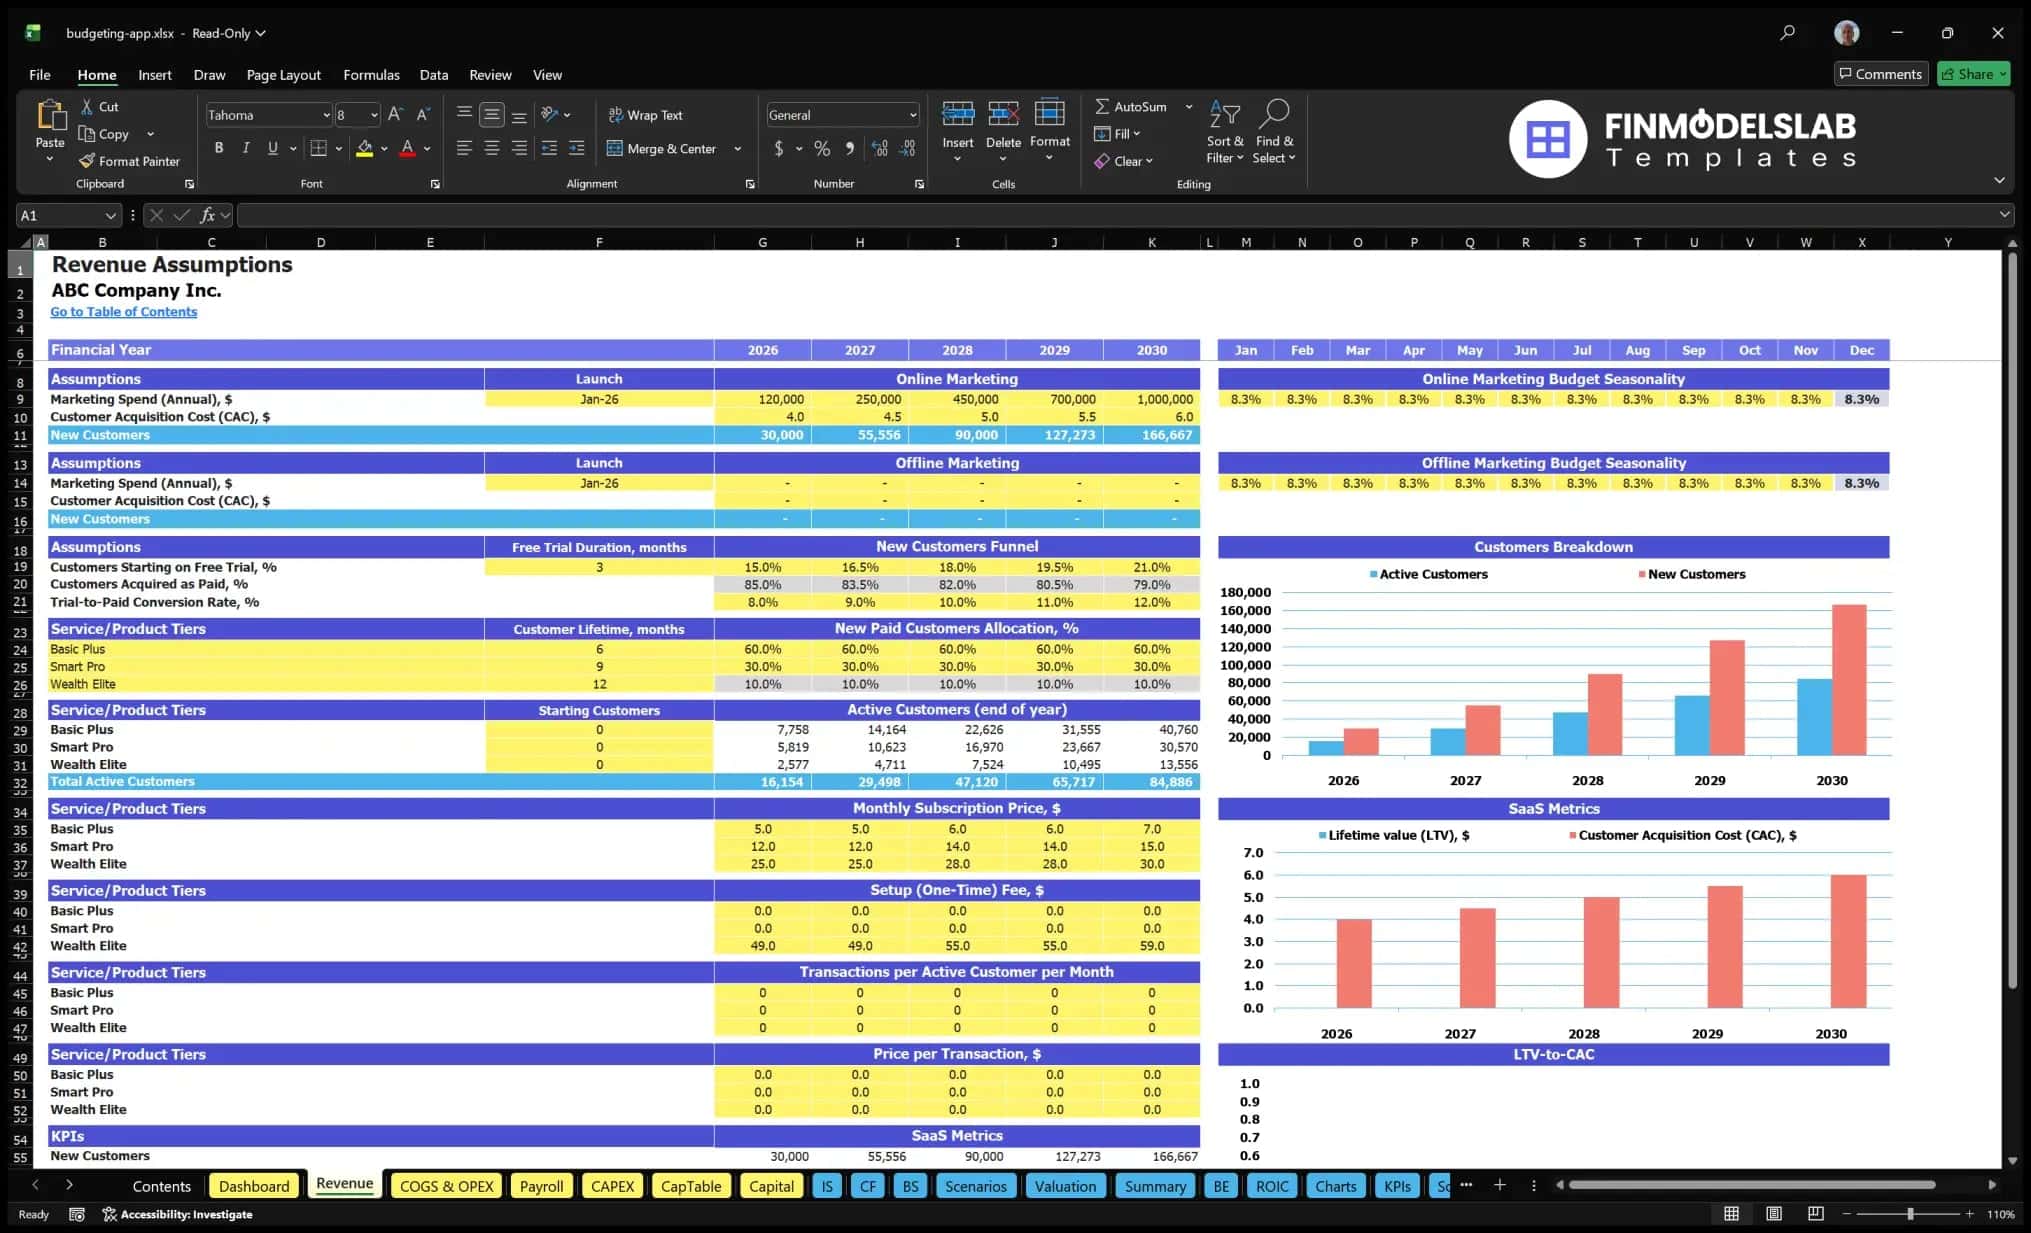
The revenue inputs section is where users define the commercial assumptions that drive the Personal Budgeting App Financial Model. This component may include subscription pricing, plan mix, trial signups, conversion rates, active users, paid subscribers, churn, upgrades, downgrades, one-time setup fees, and future revenue opportunities such as premium add-ons or usage-based fees. For example, a personal budgeting app may use a tiered subscription model with entry-level, professional, and premium plans designed for different user segments. The model can use these assumptions to calculate monthly recurring revenue, annual recurring revenue, one-time revenue, total revenue, and growth over the forecast period. This section is particularly important because revenue is not only a function of price; it depends on how efficiently the app attracts users, converts them into paying customers, retains them, and encourages upgrades to higher-value tiers. By making these assumptions editable, the template allows users to test different pricing strategies, customer acquisition plans, onboarding improvements, and retention initiatives. The revenue inputs section gives founders and planners a clear way to connect product strategy with financial outcomes and evaluate whether the monetization model can support the cost structure.
Bank-Ready Reports
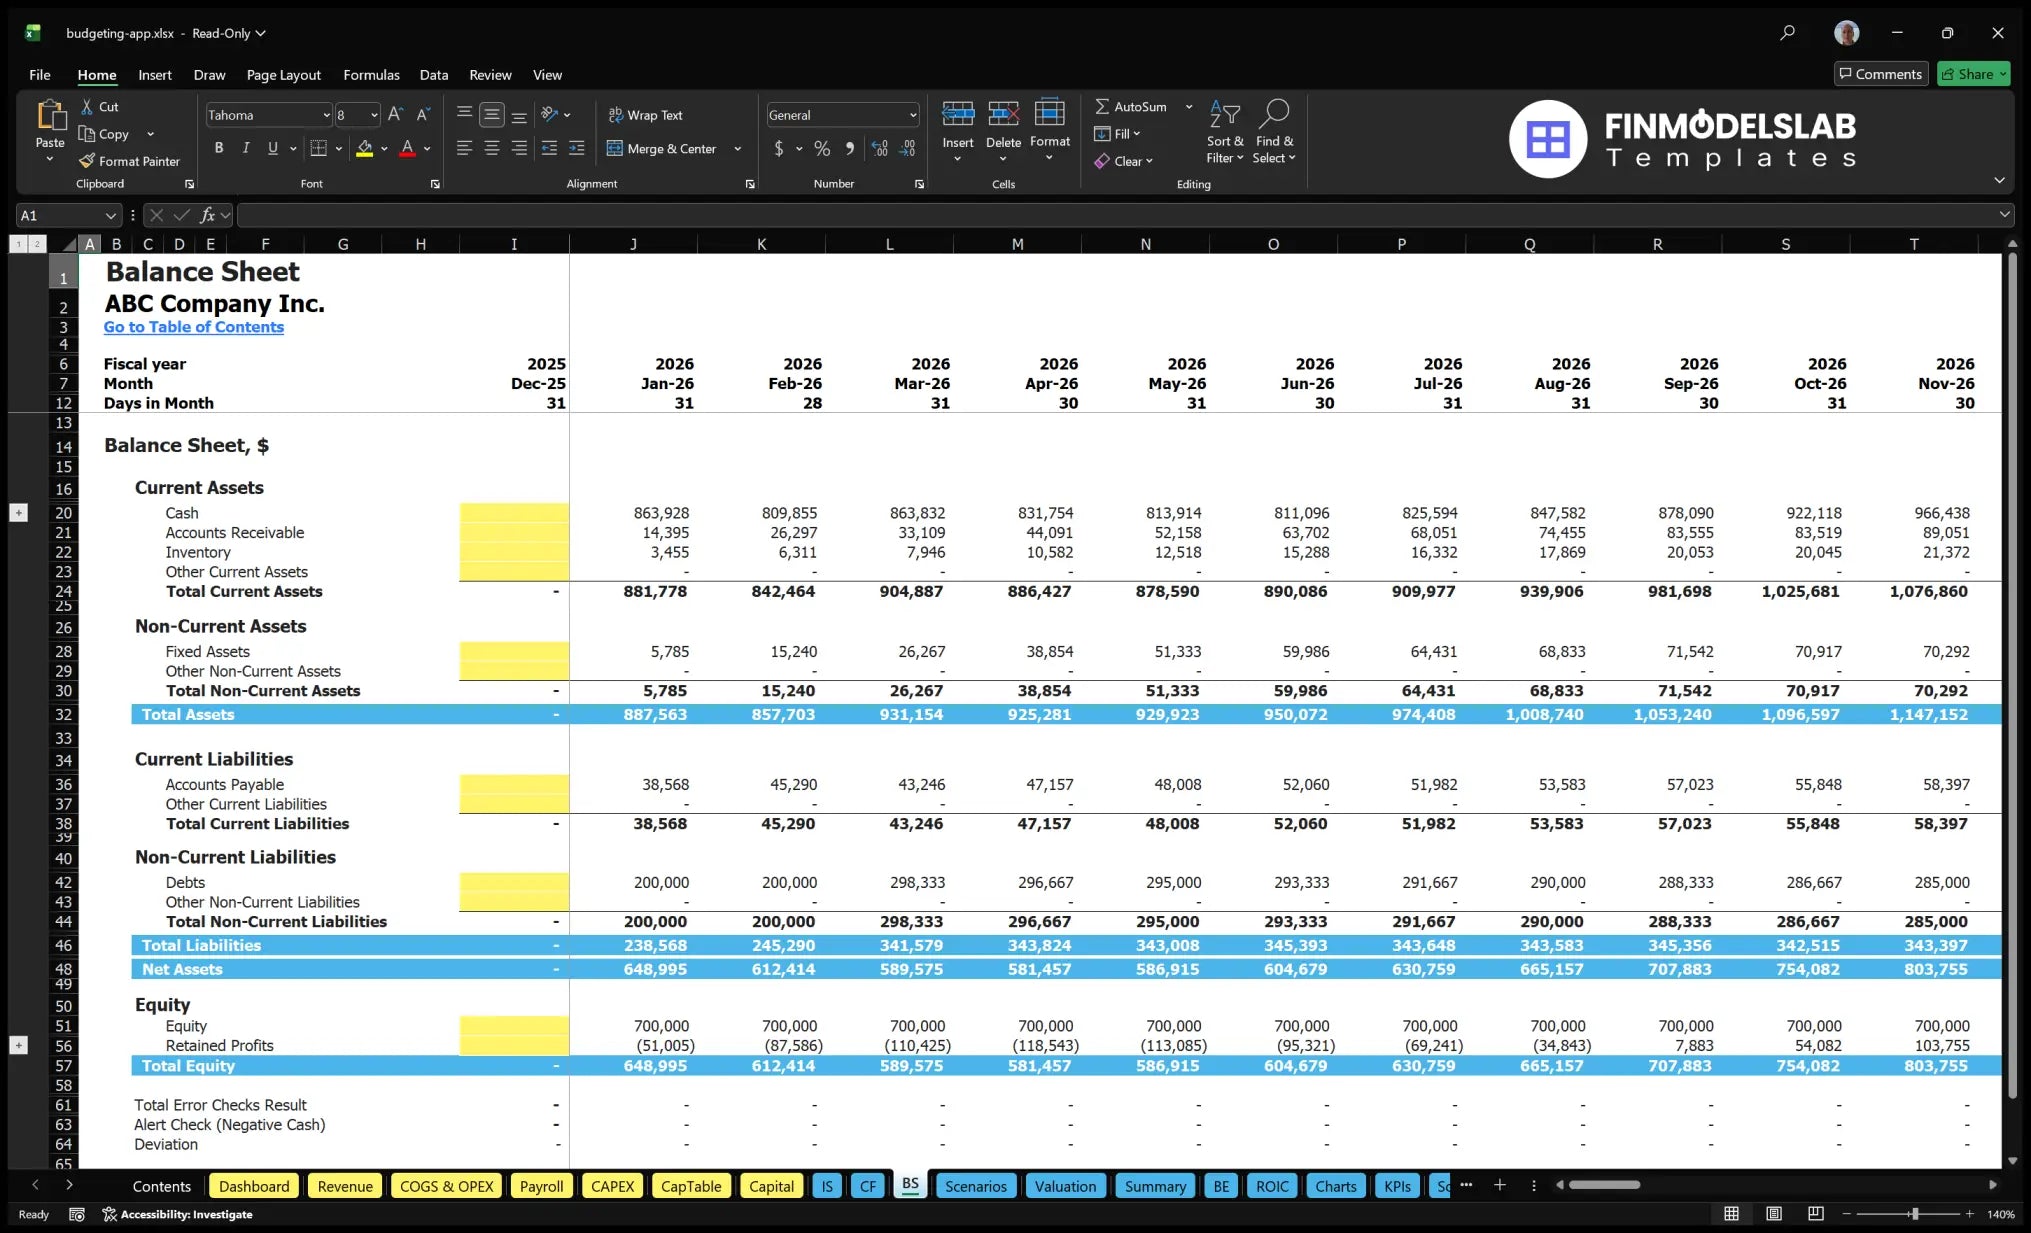
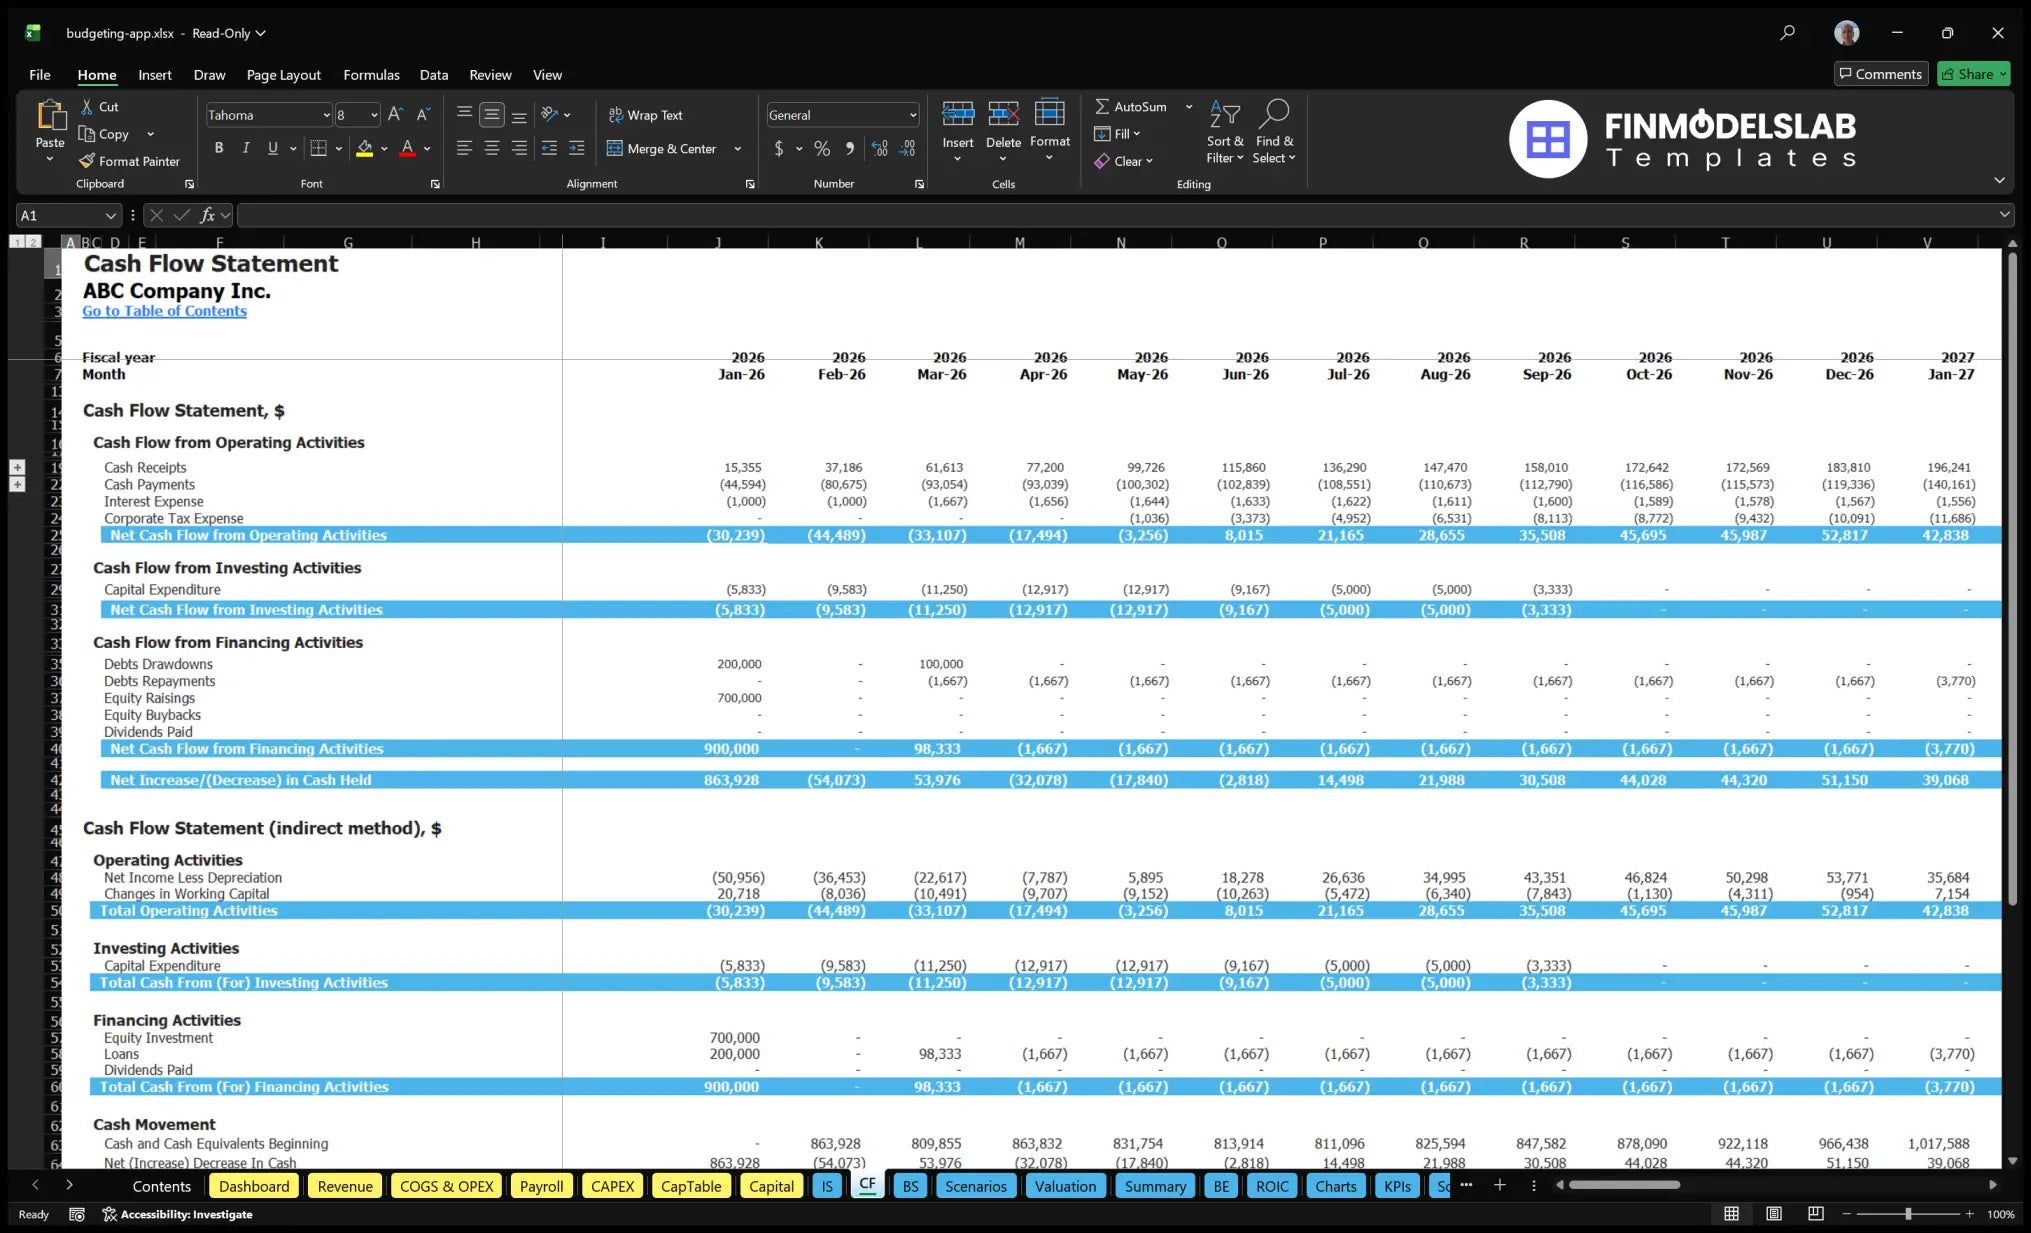
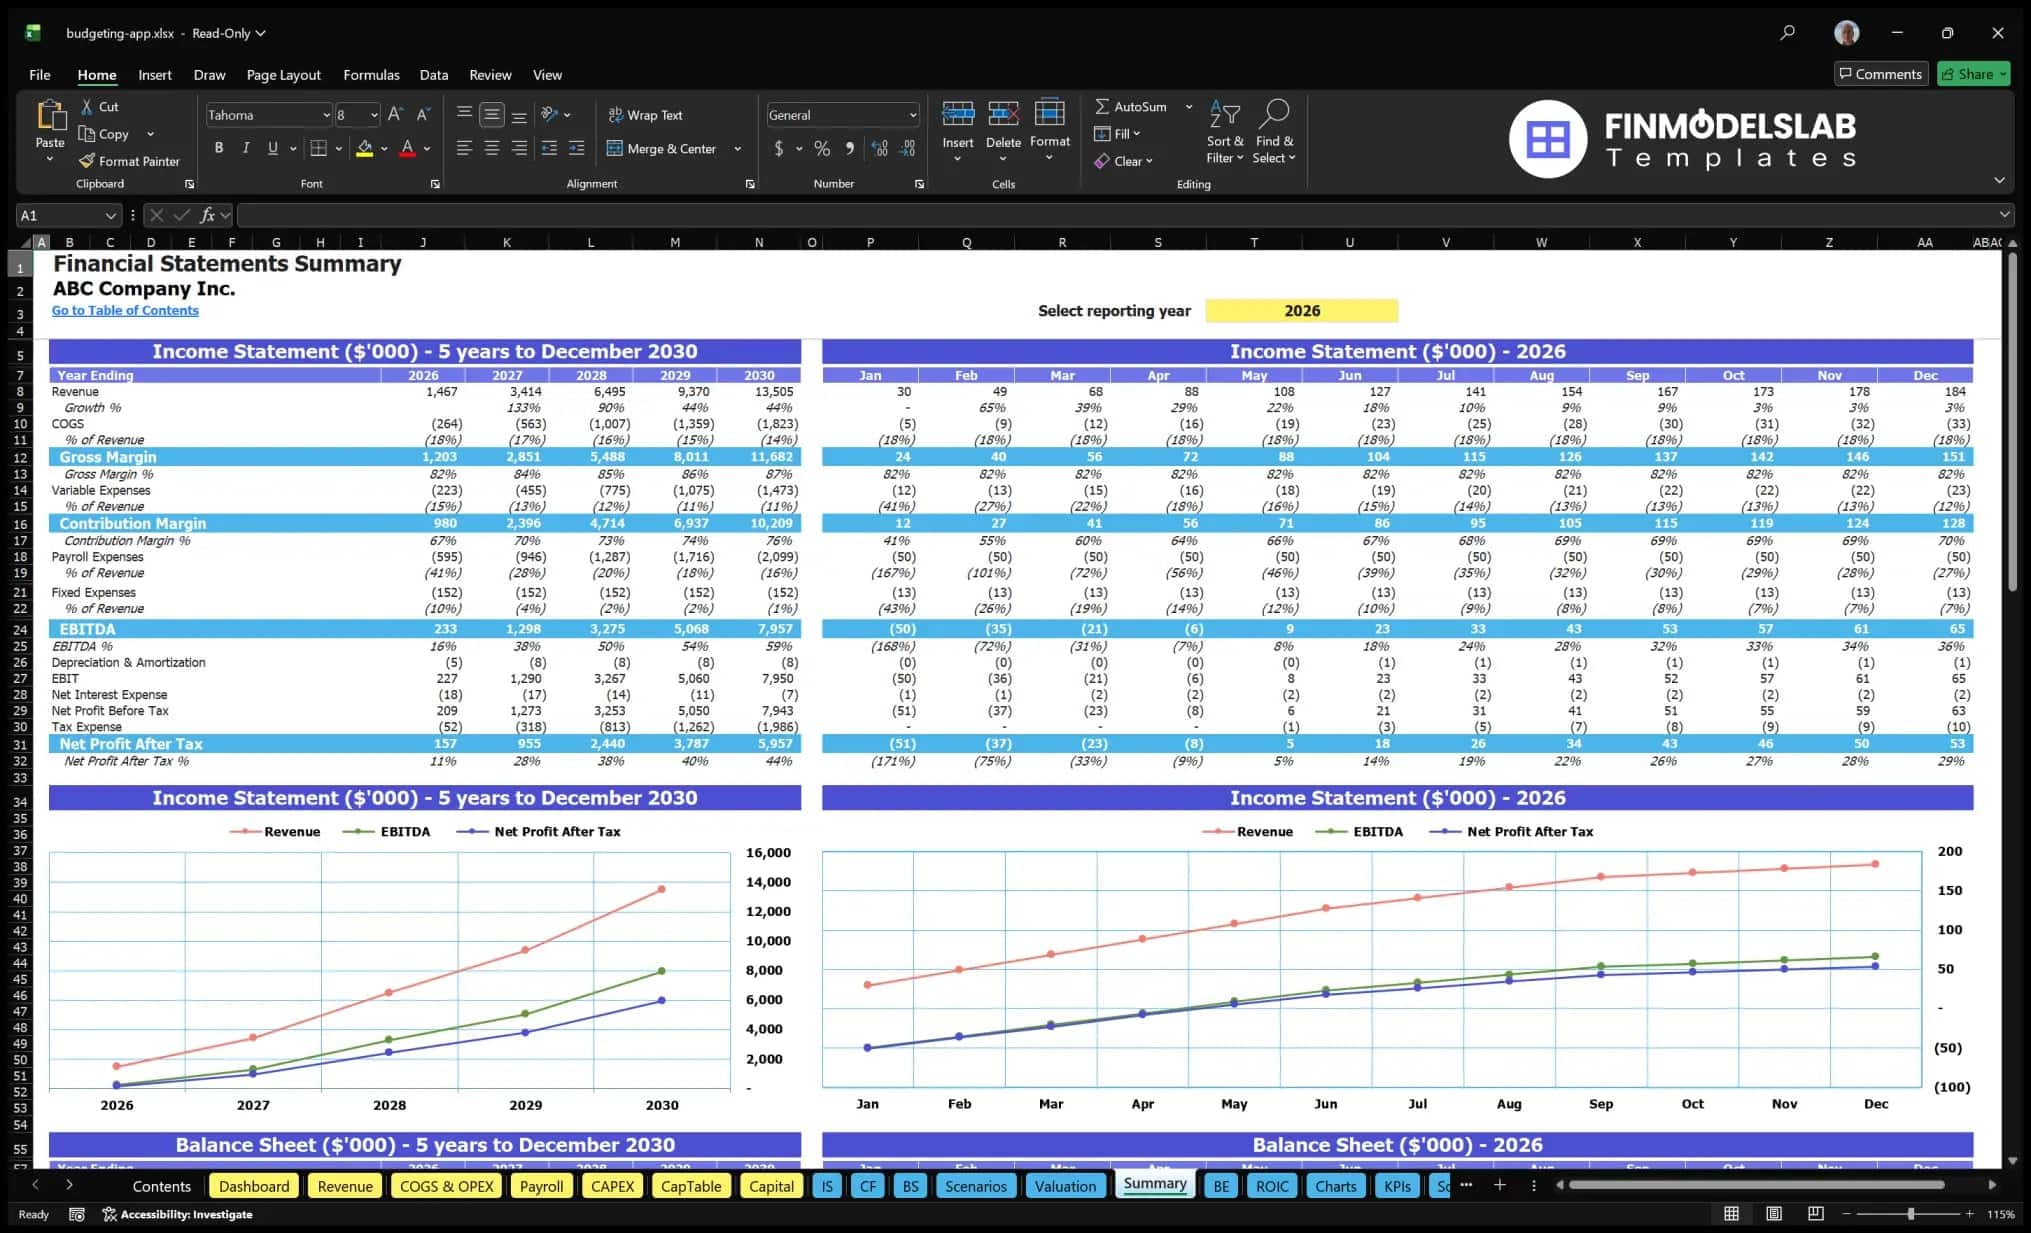
The bank-ready reports section organizes financial outputs in a format that can support lender reviews, funding applications, investor discussions, and formal business planning. This component may include forecasted income statements, cash flow statements, balance sheet summaries, debt service capacity, profitability measures, cash balances, and supporting assumptions that explain how the projections were built. For a personal budgeting app, these reports are useful because external stakeholders often need to see more than a revenue forecast; they want to understand whether the company can manage expenses, maintain liquidity, repay debt if applicable, and achieve sustainable profitability. Inputs from the operating model, payroll plan, startup cost schedule, revenue assumptions, and financing structure flow into the reports so users can review monthly and annual performance in a structured manner. The section helps make the financial plan more credible by showing the relationship between assumptions and projected statements. It also saves time for founders and consultants who need professional outputs for business plans, loan packages, investor updates, or internal approvals. With clear reporting, users can explain not just how much revenue the app may generate, but how that revenue affects cash flow, margins, and financing needs.
Revenue Breakdown
The revenue breakdown section provides a detailed view of how different revenue streams contribute to total sales. For a personal budgeting app, this may include separate lines for monthly subscriptions by plan, premium tier activations, one-time setup fees, add-on features, enterprise or family plans, partner integrations, or future transaction-based revenue. Inputs may include plan pricing, subscriber counts by tier, upgrade rates, cancellation rates, billing frequency, and launch timing for new monetization features. Outputs can show revenue by stream, percentage contribution, monthly recurring revenue, annualized revenue, and the growth pattern of each source over time. This section is useful because subscription apps often appear simple at a high level, but profitability depends heavily on the mix of users across pricing tiers and the ability to move customers toward higher-value offerings. The breakdown helps users identify which revenue streams are doing the most work, which plans may require pricing adjustments, and how much the model depends on premium subscribers versus entry-level users. It can also support decision-making around product roadmap priorities, marketing focus, and pricing tests by showing how changes in each stream affect total revenue and profitability.
KPI Dashboard
The KPI dashboard tracks the operational and financial metrics that matter most for a personal budgeting app business. This section may include metrics such as active users, paid subscribers, monthly recurring revenue, average revenue per user, customer acquisition cost, lifetime value, LTV to CAC ratio, churn rate, trial-to-paid conversion rate, gross margin, EBITDA margin, cash runway, and revenue growth. Inputs come from the revenue model, marketing assumptions, cost structure, and cash flow forecast, while outputs provide a concise performance view that can be reviewed by founders, advisors, investors, or management teams. For a personal budgeting app, KPI tracking is essential because the business model depends on scalable recurring revenue and efficient customer acquisition. A company can show strong downloads but still struggle financially if conversion is weak, churn is high, CAC is too expensive, or gross margins are pressured by payment processing, app store commissions, and bank data fees. The KPI dashboard helps users monitor whether the app is moving toward sustainable economics and compare performance against internal targets or market benchmarks. It also supports better decision-making by highlighting the metrics that require action, such as improving onboarding, adjusting pricing, reducing churn, or reallocating marketing spend.
Break-Even Analysis
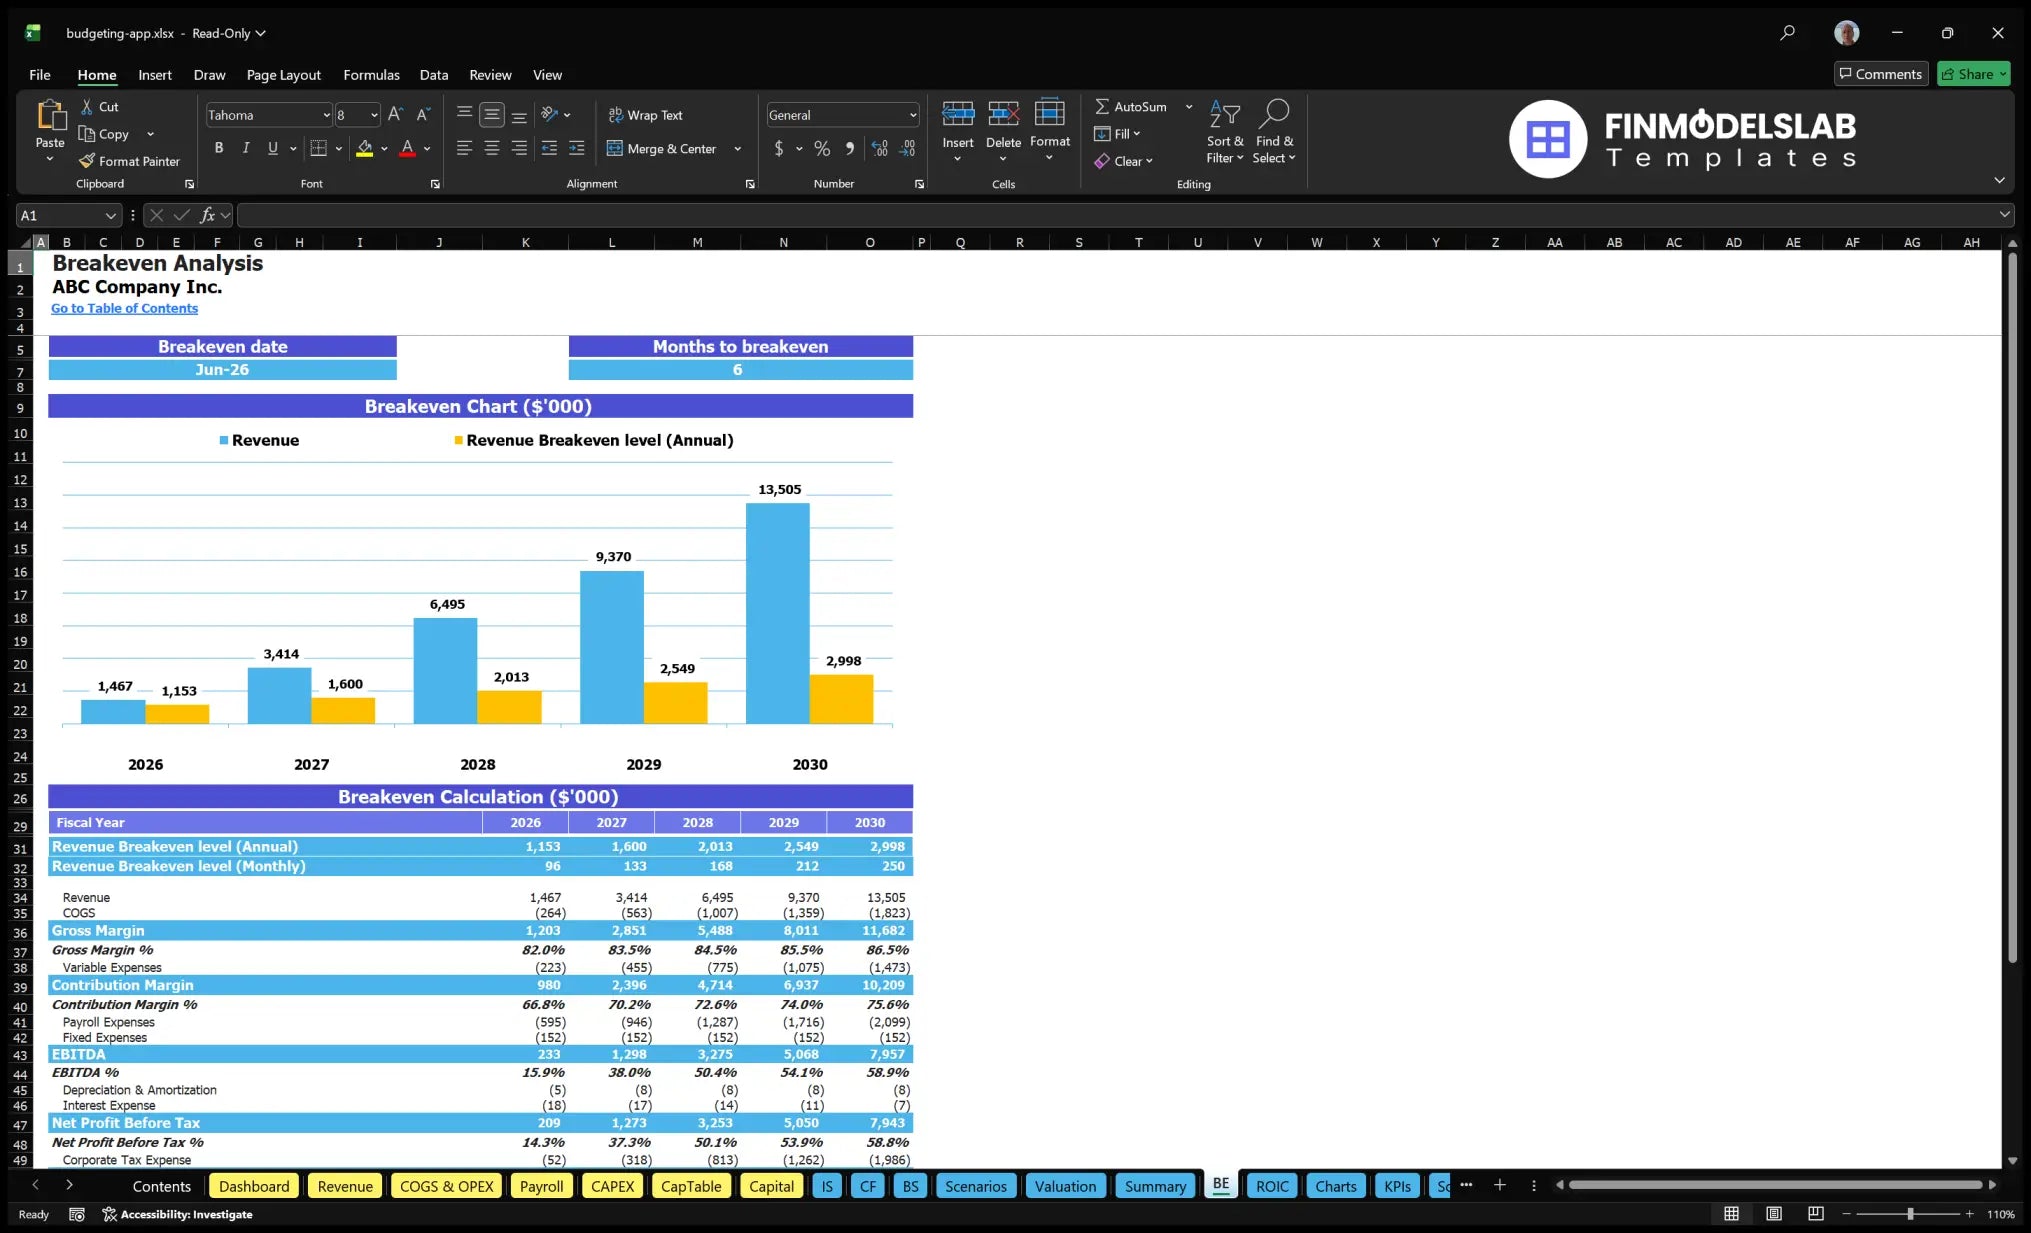
The break-even analysis section helps users identify when the personal budgeting app is projected to cover its fixed and variable costs and begin generating profit. This component uses assumptions from the revenue forecast, cost of goods sold, operating expenses, payroll, marketing budget, and other recurring costs to estimate the point at which revenue is sufficient to support the business. Outputs may include break-even month, break-even revenue, required paid subscribers, margin contribution, and the gap between projected performance and the level needed for profitability. For a personal budgeting app, break-even planning is especially useful because early-stage spending on development, marketing, infrastructure, compliance, and customer support can occur before the user base is large enough to generate meaningful recurring revenue. The analysis helps founders understand how many subscribers must be acquired, what pricing and conversion levels are needed, and how cost discipline affects the timeline to profitability. It can also support investor and lender conversations because break-even timing is a practical indicator of business model viability. By adjusting assumptions, users can see how faster conversion, lower churn, reduced acquisition cost, or additional premium features may accelerate the path to profitability.
Startup Costs and Funding Requirements
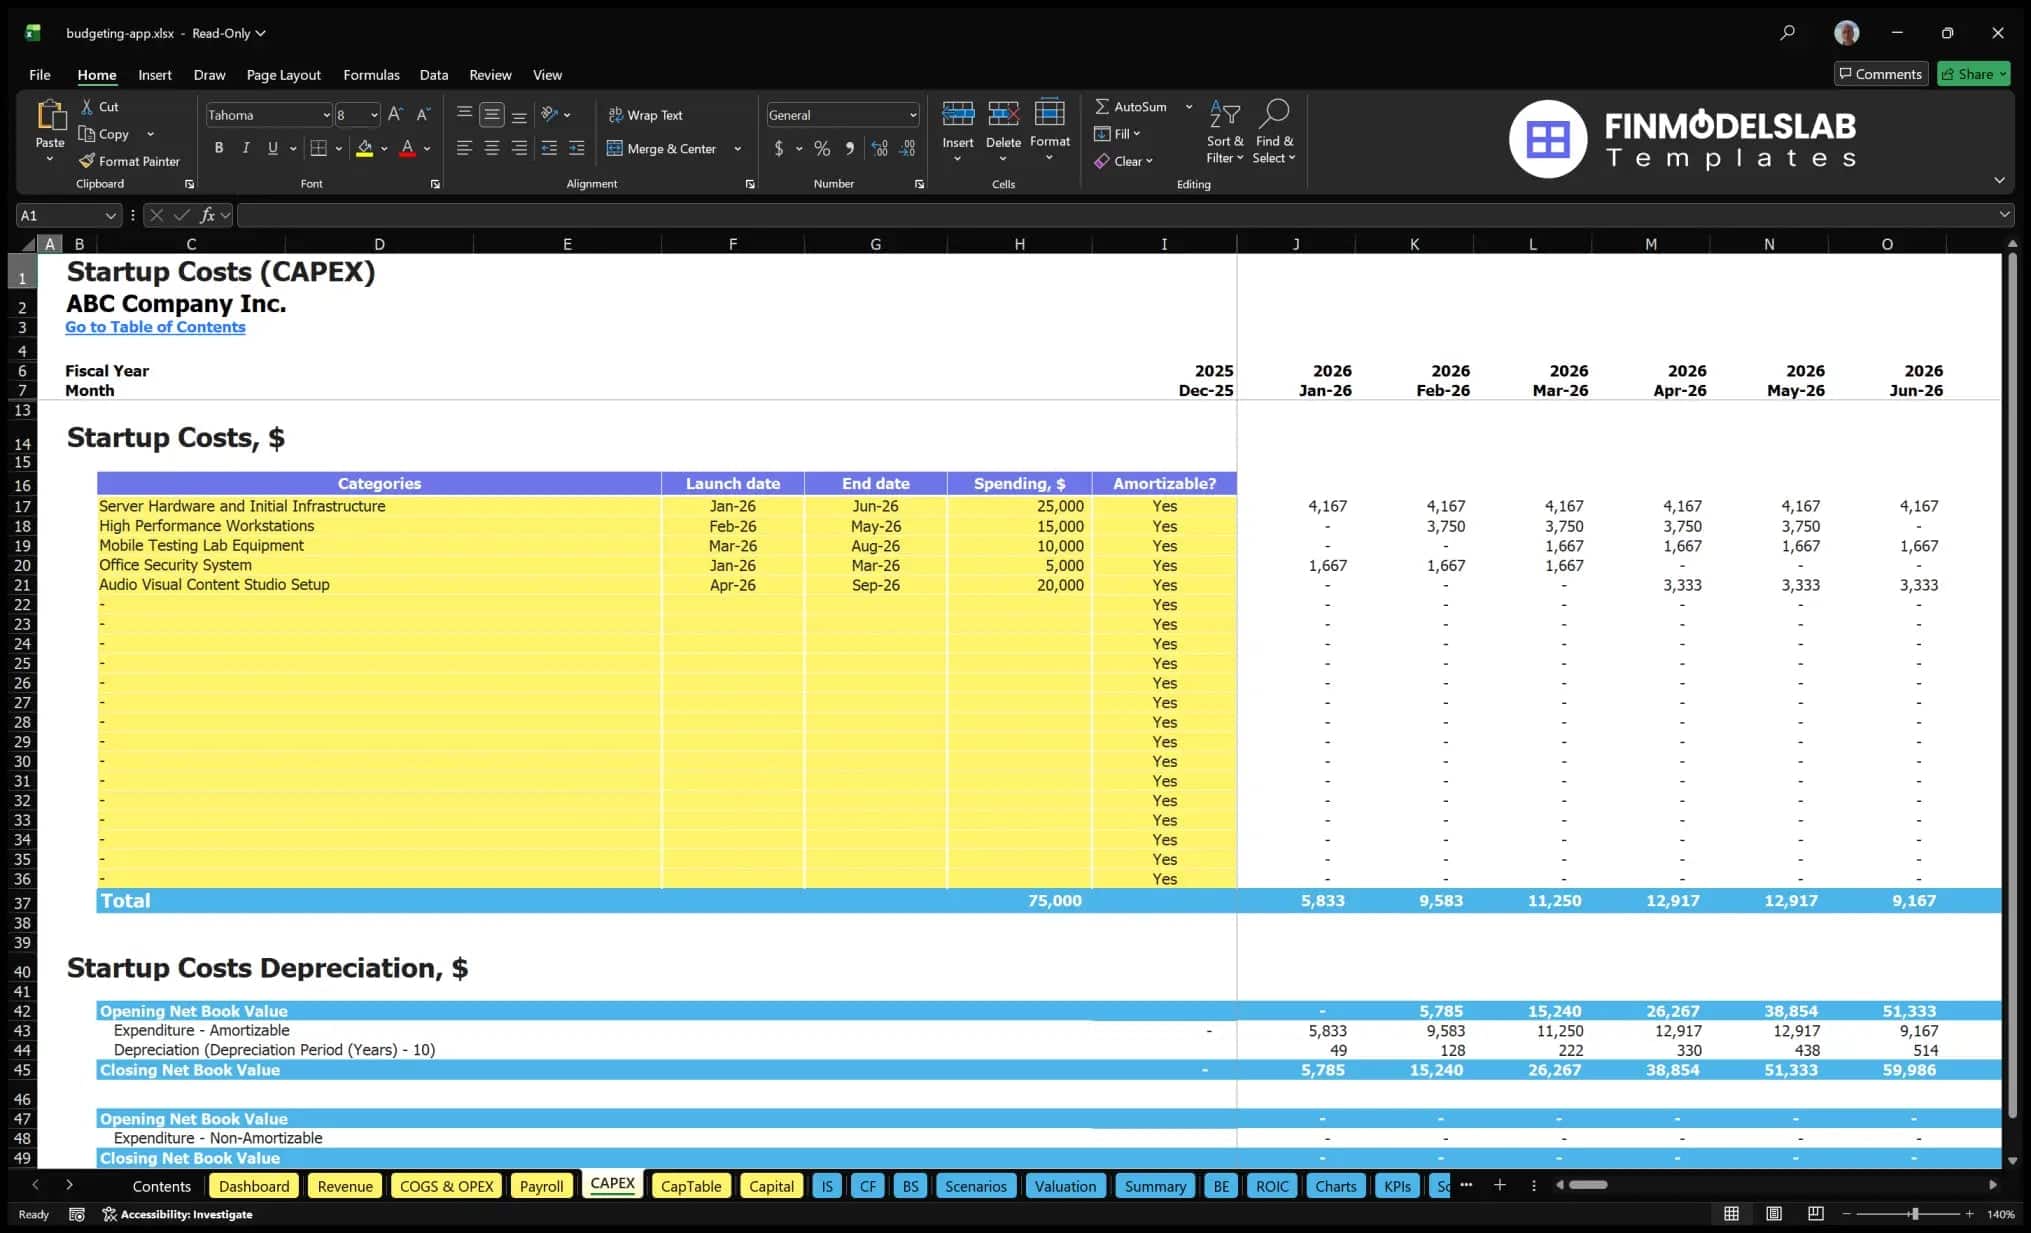
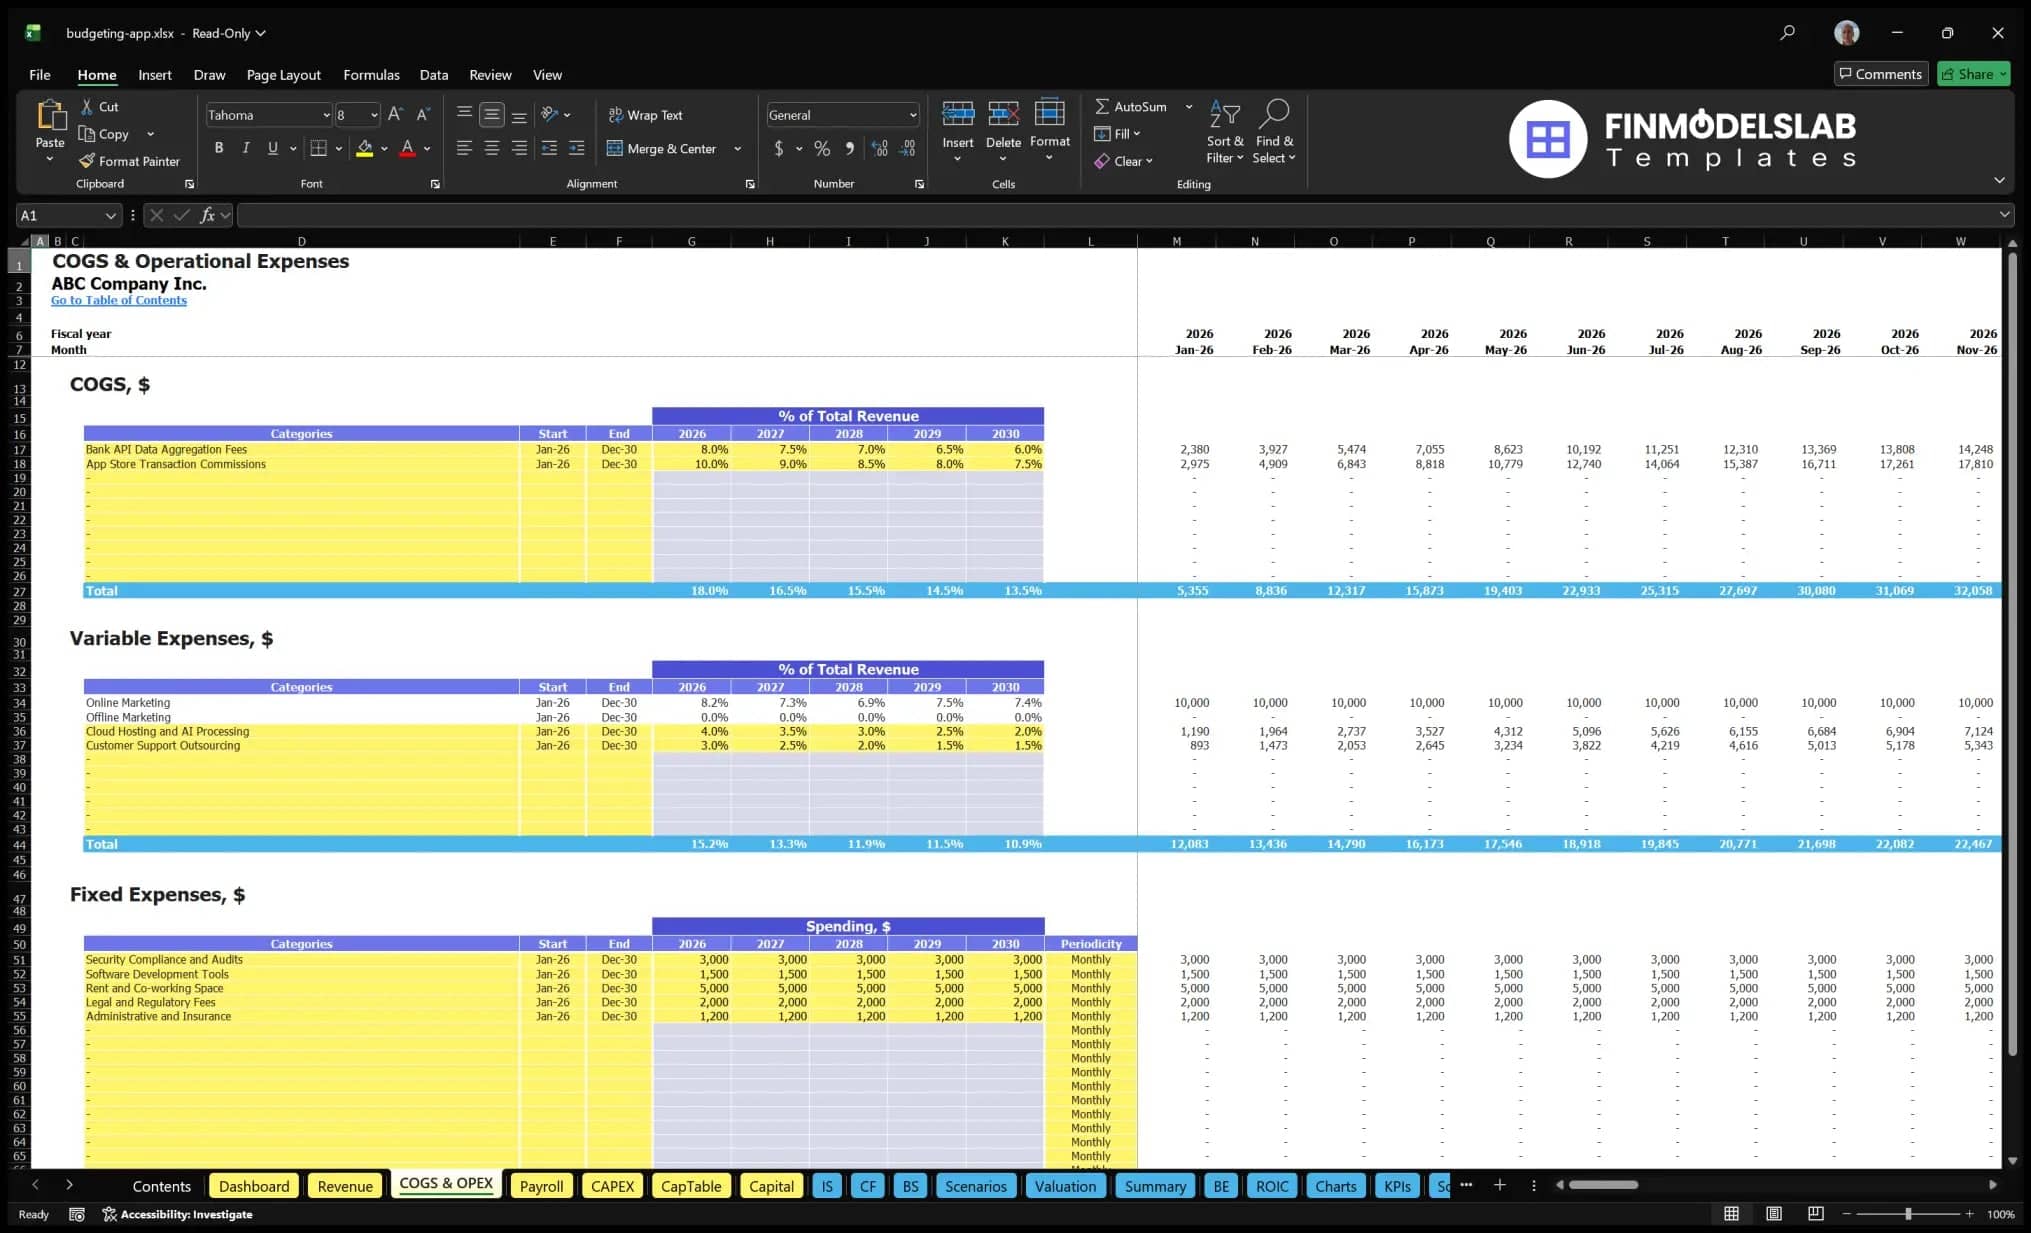
The startup costs and funding requirements section helps users estimate the initial investment needed to launch and operate the personal budgeting app before it becomes self-sustaining. This component may include app development, server infrastructure, cloud hosting setup, security and compliance work, API integrations, testing, design, branding, launch marketing, legal fees, licenses, hardware, software subscriptions, contractor costs, and working capital reserves. Inputs can be customized to reflect the user’s development strategy, whether the app is built by an in-house team, outsourced agency, technical co-founder, or hybrid model. Outputs may include total startup costs, initial capital requirement, use of funds, opening cash balance, and financing gap. This is important because many app businesses underestimate the cash needed before revenue begins to scale, especially when marketing spend, technical maintenance, and customer support are required immediately after launch. The section helps founders plan funding requests, allocate capital more responsibly, and explain to investors or lenders exactly how launch funds will be used. It also connects startup investment to the broader financial model, allowing users to see how initial funding affects cash runway, payback period, profitability, and long-term return potential.
File types:
Excel – Single-User: .xlsx
Excel – Multi-User: .xlsx
Similar ProductsOther customers were also interested in...





 HenrySheykin
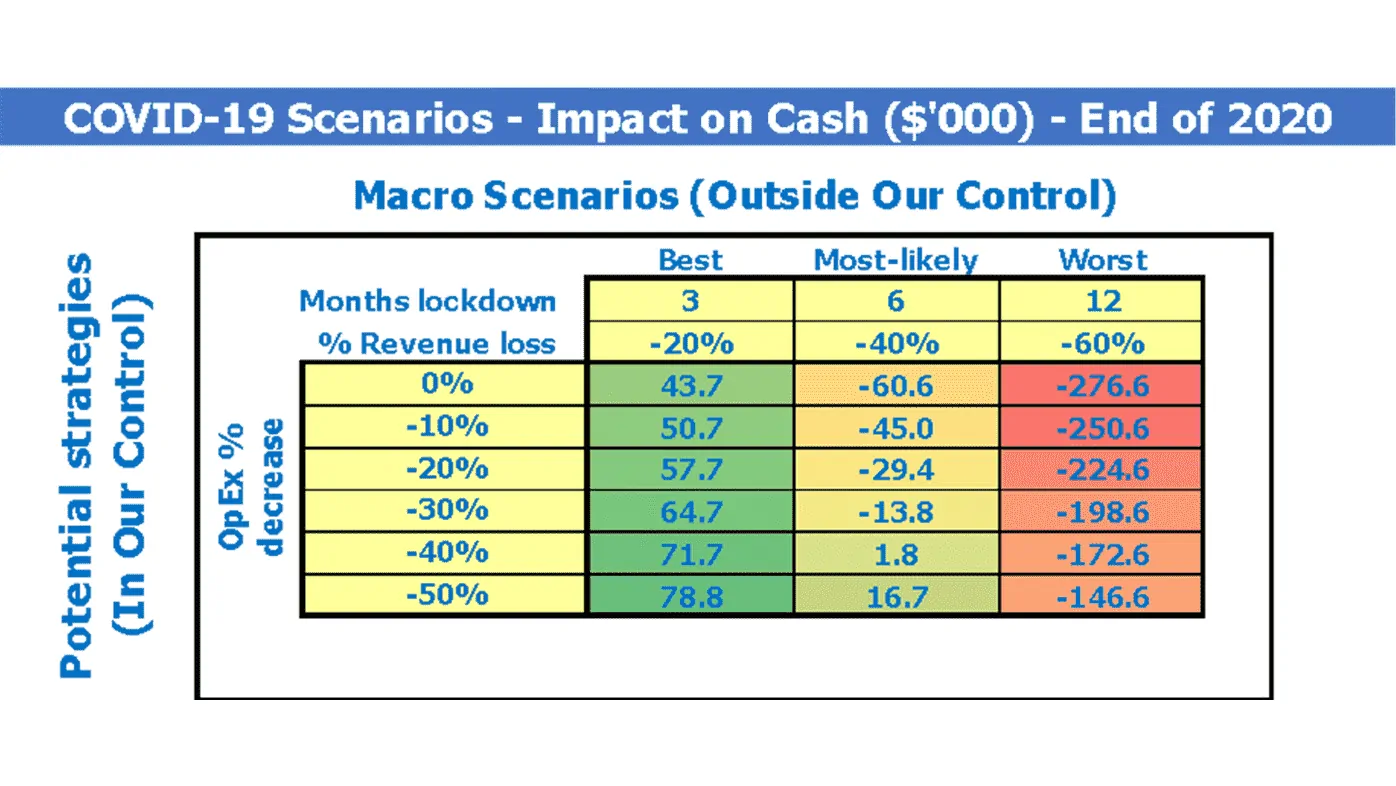
Financial Model Excel Template to fight COVID-19
The coronavirus has turned many small and big companies upside down. The decrease in sales, problems... Read more
Inventory Control Software Financial Model Excel T...
The Inventory Management Software Financial Model helps entrepreneurs, founders, consultants, analys... Read more
Business Valuation Expert Financial Model Excel Te...
The Business Valuation for Divorce Financial Model helps users build a structured financial forecast... Read more
 Anuj
Anuj
Private Equity Fund Model (Investor Cashflows)
The Private Equity Fund Cashflows Model helps LPs and GPs analyze fund cash flows, returns, and dist... Read more
 Pierre-AlexandreHeur...
Due Diligence P&L – Exhaustive Revenue a...
Model for in depth understanding of high level profit and loss and revenue analysis. Big-4 like chec... Read more
 Giorgos
Advanced Financial Model with DCF and Valuation
Dynamic 10-Year Financial Model, suitable for any type of business, supporting strategic planning, i... Read more
Startup Company Financial Model – 5 Year Fin...
Highly-sophisticated and user-friendly financial model for Startup Companies providing a 5-Year adva... Read more
Budgeting & Forecasting Model Template
Budgeting & Forecasting Template suitable for either a Trade or Service company in any type of i... Read more
Annual Operating Plan – Actual vs Budget Tem...
User friendly template enabling user to prepare an operating budget to project company’s performan... Read more
You must log in to submit a review.