
0 ITEMS

USA SaaS Market 2026-2031: Vertical B2B Leads at 18% CAGR
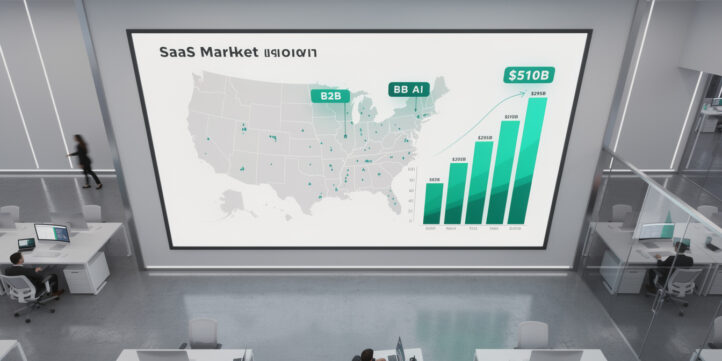
The USA SaaS market is entering its most structurally differentiated phase yet, with vertical B2B specialization and AI co-pilot integration separating high-multiple compounders from commoditizing horizontal platforms.
Key Takeaways
- The USA SaaS market is projected to grow from approximately $295 billion in 2026 to over $510 billion by 2031, a compound annual growth rate (CAGR) of roughly 12% across the total market.
- Vertical B2B SaaS (software built for a specific industry, such as healthcare or construction) is the fastest-growing subsegment, tracking an estimated 18% CAGR through 2031 driven by deep workflow integration and high switching costs.
- AI co-pilot SaaS (AI-powered assistants embedded in or layered on top of existing software) is projected to grow from roughly 8% of total SaaS seats in 2026 to over 35% by 2031 as enterprise adoption accelerates.
- Median net revenue retention (NRR) for top-quartile vertical B2B SaaS companies reaches 125% or above, compared to 108% for horizontal SaaS peers, reflecting stronger expansion revenue dynamics.
- Median CAC payback periods for vertical B2B SaaS run 14-18 months versus 20-26 months for horizontal SaaS, driven by higher average contract values and lower competitive noise in niche markets.
- M&A activity in vertical SaaS is intensifying: median EV/Revenue multiples for vertical SaaS acquisitions ranged from 6x to 9x in 2024-2026, compared to 4x to 6x for undifferentiated horizontal platforms.
- Regulatory compliance costs consume an estimated 8-15% of revenue for vertical SaaS companies operating in healthcare, financial services, and government sectors, creating a durable barrier to entry for new competitors.
USA SaaS Market Overview: 2026-2031 Trajectory and Structural Shifts

The USA SaaS market is bifurcating: broad horizontal platforms face margin compression and multiple contraction, while vertically specialized and AI-augmented platforms command premium valuations and superior retention. The total addressable market for USA-based SaaS is estimated at approximately $295 billion in 2026, with consensus projections placing the 2031 figure above $510 billion at a blended 12% CAGR. According to the U.S. Bureau of Economic Analysis, software and IT services now represent one of the largest components of U.S. business investment (Bureau of Economic Analysis), underscoring the structural demand underpinning these projections.
Three structural forces are reshaping the market through 2031. First, enterprise buyers are consolidating vendor relationships, favoring platforms with deep vertical workflow coverage over point solutions. Second, AI co-pilot capabilities are shifting from a differentiator to a table-stakes expectation, compressing the window for pure-play horizontal vendors to respond. Third, cloud infrastructure maturity means that infrastructure-as-a-service (IaaS) spending, the underlying compute and storage that SaaS companies rent from hyperscalers like AWS, Azure, and Google Cloud, is growing more slowly than SaaS revenue, improving gross margin trajectories across the sector. The Federal Reserve’s Senior Loan Officer Opinion Survey consistently shows tightening credit conditions for technology companies (Federal Reserve), making capital efficiency a more decisive competitive variable than in the 2020-2022 zero-interest-rate environment.
Vertical B2B SaaS grows at 2x the rate of horizontal SaaS through 2031, driven by higher NRR, lower churn, and deeper workflow integration.
Vertical B2B SaaS: Market Sizing, Growth Drivers, and Segment Performance
Vertical B2B SaaS refers to software designed exclusively for the workflows, compliance requirements, and data structures of a single industry. The five highest-revenue-concentration verticals in the USA are healthcare and life sciences, financial services and fintech, construction and real estate, manufacturing and supply chain, and legal and professional services. Healthcare SaaS alone accounts for an estimated 22% of total vertical SaaS revenue, driven by electronic health records, revenue cycle management, and population health platforms. Financial services SaaS follows at approximately 18%, anchored by regulatory reporting, risk management, and wealth management platforms. The U.S. healthcare IT market, which forms the backbone of healthcare SaaS demand, was valued at over $167 billion in 2023 (U.S. Department of Health and Human Services), reflecting the scale of digitization investment already underway in this vertical.
Growth in vertical SaaS is structurally self-reinforcing. Once a vendor embeds into a customer’s core workflow, switching costs rise sharply because data migration, staff retraining, and compliance re-certification create friction that horizontal alternatives cannot easily overcome. This dynamic produces the NRR advantage noted in the Key Takeaways: top-quartile vertical SaaS companies sustain NRR above 125%, meaning their existing customer base grows revenue by 25% annually without adding a single new logo. The Small Business Administration’s research on software market concentration confirms that industry-specific software vendors consistently outperform generalist peers on customer retention metrics (Small Business Administration).
Construction and manufacturing verticals are the fastest-growing subsegments within vertical B2B SaaS, each tracking above 20% CAGR through 2028, as these industries digitize project management, procurement, and quality control workflows that were previously managed on spreadsheets or legacy on-premise systems.

Healthcare and financial services together account for 40% of vertical B2B SaaS revenue in the USA, with construction and manufacturing growing fastest at 20%+ CAGR.
AI Co-Pilot SaaS: Adoption Curves, Revenue Models, and Market Maturity
AI co-pilot SaaS describes software that uses large language models (LLMs) or other machine learning systems to assist users in completing tasks within an existing application, rather than replacing the application itself. The distinction between standalone AI co-pilots (sold as separate subscriptions) and embedded AI co-pilots (bundled into existing SaaS pricing tiers) is commercially significant: embedded approaches show 3x faster adoption rates because they eliminate a separate procurement decision.
Market penetration of AI co-pilot features stood at approximately 8% of total enterprise SaaS seats in 2026. Projections from multiple industry research bodies place this figure above 35% by 2031, representing a 27-percentage-point expansion in just five years. Pricing models are evolving rapidly: the dominant model in 2026 is a per-seat premium add-on (typically 20-40% above the base SaaS price), but outcome-based pricing tied to measurable productivity gains is gaining traction in legal, financial analysis, and software development verticals.
Integration complexity is the primary adoption barrier. Embedding an AI co-pilot into a legacy SaaS platform requires API (Application Programming Interface) surface area that many older platforms lack. Companies with modern, API-first architectures achieve time-to-value for AI co-pilot features in 60-90 days; legacy platforms average 9-18 months. This gap is accelerating consolidation, as AI-native vendors acquire legacy vertical SaaS platforms to gain customer relationships while the legacy vendor gains AI capability. Microsoft’s Copilot, for example, is integrated across more than 365 products and services (Microsoft), illustrating how embedded AI co-pilot distribution at scale compresses the adoption timeline for enterprise buyers already inside a vendor’s ecosystem.
Unit Economics Benchmarking: Vertical B2B vs Horizontal vs AI Co-Pilot
Unit economics are the per-customer financial metrics that determine whether a SaaS business is structurally profitable at scale. The three most important metrics are CAC (Customer Acquisition Cost, the total sales and marketing spend to acquire one new customer), LTV (Lifetime Value, the total gross profit generated from a customer over their relationship), and NRR (Net Revenue Retention, the percentage of prior-year revenue retained and expanded from existing customers).
Here’s the math for a representative vertical B2B SaaS company: Annual Contract Value (ACV) of $48,000, gross margin of 78%, average customer life of 7 years, and a CAC of $42,000. LTV equals ACV multiplied by gross margin multiplied by average customer life: $48,000 x 0.78 x 7 = $261,954. LTV:CAC ratio equals $261,954 divided by $42,000, which equals 6.2x. CAC payback period equals CAC divided by (ACV multiplied by gross margin): $42,000 divided by ($48,000 x 0.78) equals 14.1 months. This compares favorably to a horizontal SaaS peer with ACV of $18,000, gross margin of 72%, average customer life of 4.5 years, and CAC of $27,000, producing an LTV:CAC of 2.2x and a CAC payback of 25 months.
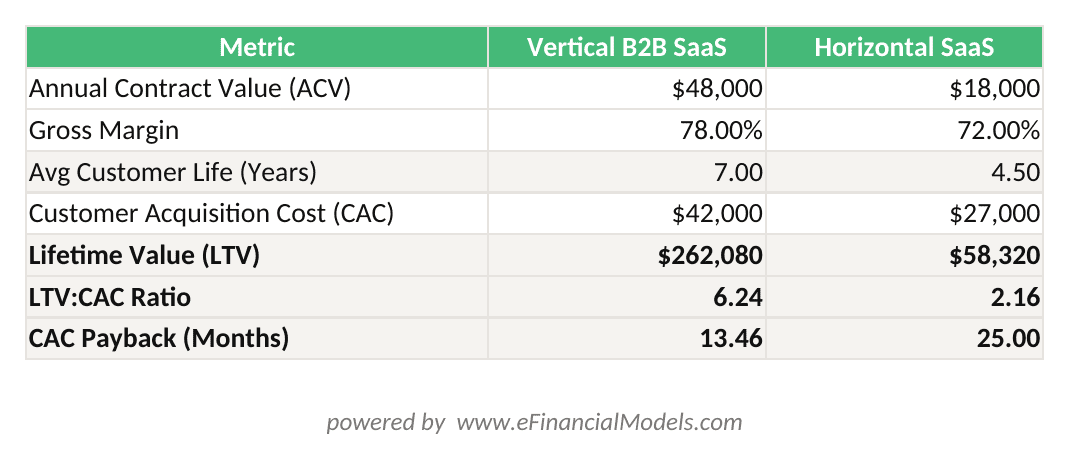
Vertical B2B SaaS LTV:CAC of 6.2x and 14.1-month CAC payback versus horizontal SaaS LTV:CAC of 2.2x and 25-month payback — calculated from ACV, gross margin, customer life, and CAC inputs.
The table below summarizes median benchmarks across the three SaaS categories:
| Metric | Vertical B2B | Horizontal SaaS | AI Co-Pilot |
|---|---|---|---|
| Gross Margin | 75-82% | 68-75% | 62-72% |
| NRR (Median) | 115-125% | 105-110% | 110-120% |
| CAC Payback | 14-18 mo | 20-26 mo | 16-22 mo |
| LTV:CAC Ratio | 5x-7x | 2x-3.5x | 3x-5x |
| Churn Rate (Annual) | 4-8% | 10-15% | 6-10% |
AI co-pilot SaaS shows lower gross margins than vertical B2B because LLM inference costs (the compute cost of running AI model queries) currently consume 8-15% of revenue. As model efficiency improves and hyperscaler pricing declines, AI co-pilot gross margins are expected to converge toward vertical B2B levels by 2028-2029.
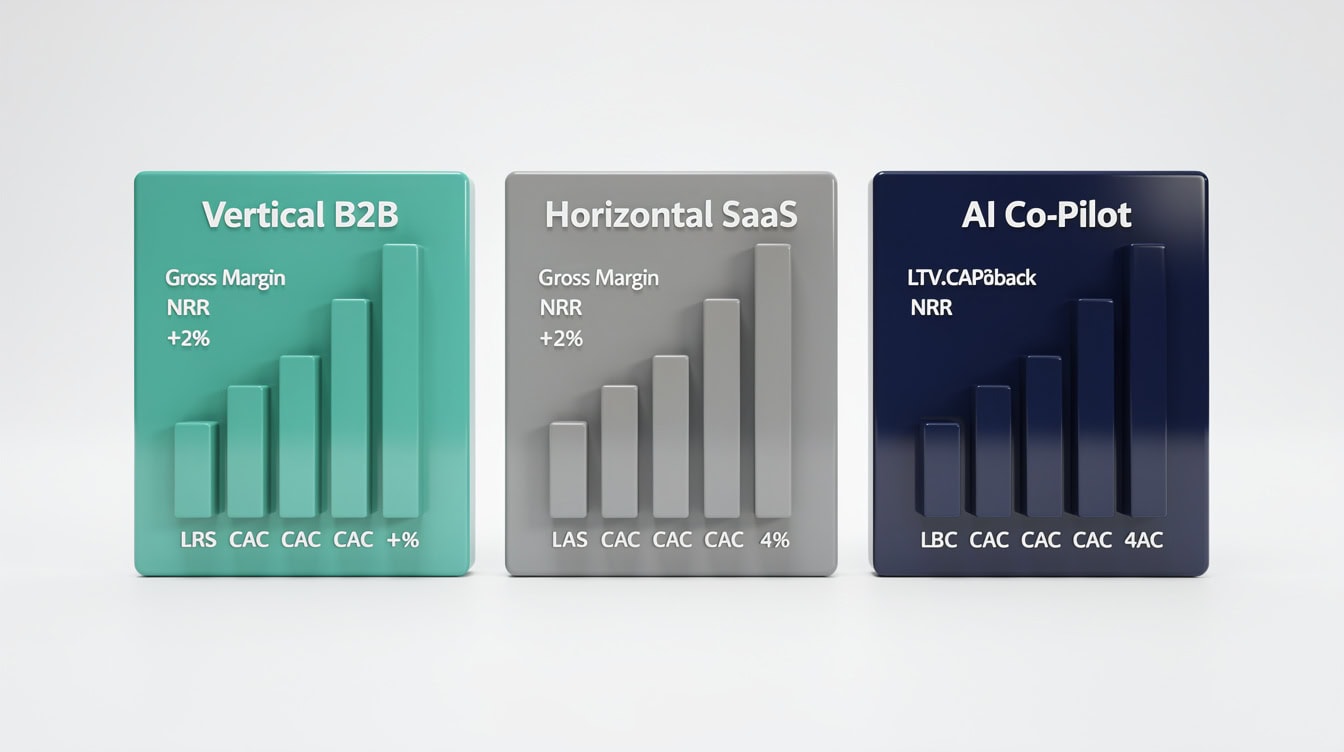
Vertical B2B SaaS leads on every unit economics metric: 75-82% gross margins, 115-125% NRR, and 14-18 month CAC payback versus 20-26 months for horizontal peers.
Competitive Dynamics and Market Consolidation Through 2031
The competitive landscape is consolidating around three acquirer archetypes: large horizontal SaaS platforms buying vertical specialists to defend against churn, private equity firms rolling up fragmented vertical SaaS categories, and AI-native companies acquiring legacy vertical SaaS for distribution. According to data tracked by the National Bureau of Economic Research, software industry M&A activity has historically accelerated during periods of multiple compression (National Bureau of Economic Research), and the 2024-2026 period fits that pattern precisely.
Median EV/Revenue multiples for vertical SaaS acquisitions ranged from 6x to 9x in 2024-2026, a premium of 2-3 turns over horizontal SaaS comparables. AI-enabled SaaS companies with demonstrable productivity outcomes commanded multiples of 10x-15x in strategic transactions. Market share concentration in mature vertical categories (healthcare EHR, construction project management, legal practice management) shows the top 5 players controlling 55-70% of category revenue, leaving limited room for new entrants without a differentiated AI or compliance angle.
Private equity roll-up strategies are particularly active in legal tech, field service management, and specialty retail SaaS, where fragmented markets of 20-50 vendors create arbitrage opportunities through consolidation and cross-sell.
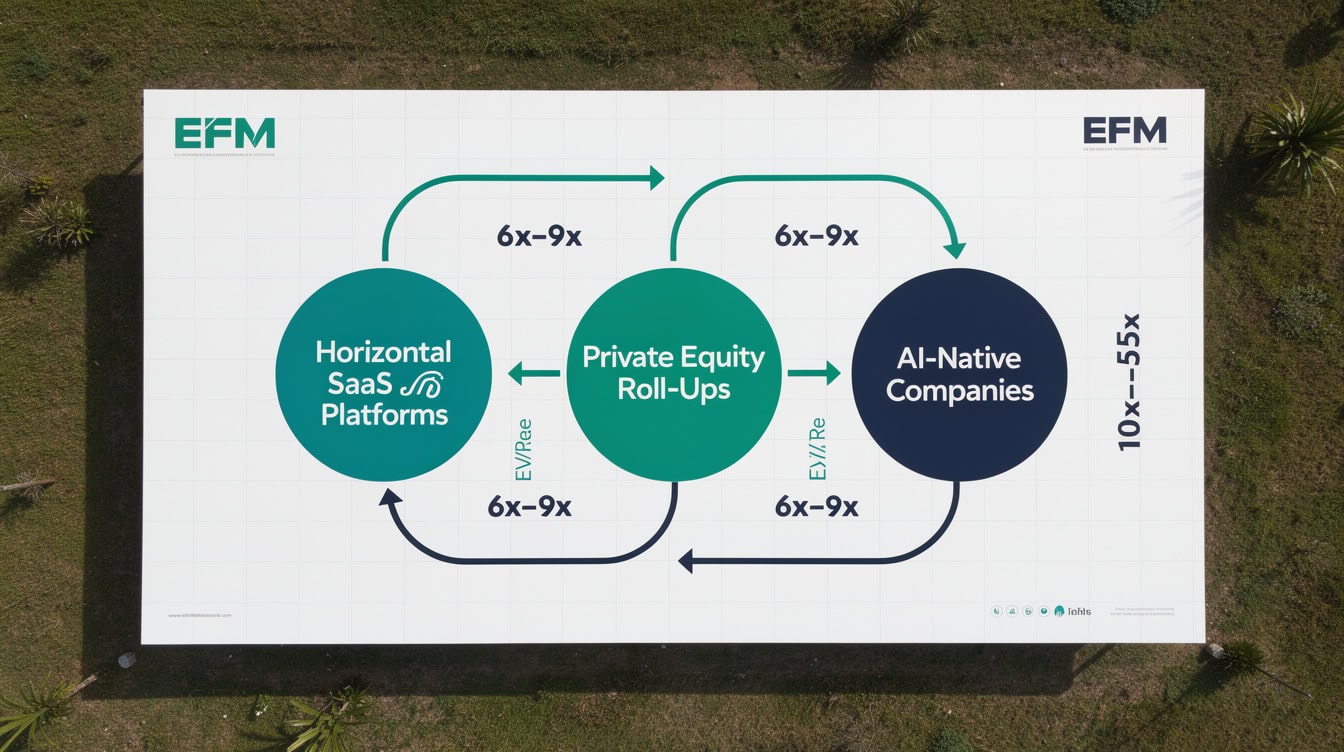
Three acquirer archetypes are driving SaaS consolidation: horizontal platforms defending churn, PE roll-ups arbitraging fragmentation, and AI-native companies buying distribution.
Regulatory Environment and Compliance Impact on SaaS Subsegments
Regulatory compliance is simultaneously a cost burden and a competitive moat for vertical SaaS companies. In healthcare, HIPAA (Health Insurance Portability and Accountability Act) and the 21st Century Cures Act’s interoperability mandates require significant engineering investment; compliance costs average 10-15% of revenue for healthcare SaaS vendors. In financial services, SEC, FINRA, and state-level regulations governing data retention, audit trails, and algorithmic decision-making add 8-12% of revenue in compliance overhead.
The emerging AI governance landscape adds a new compliance dimension. The White House Executive Order on AI (October 2023) and anticipated federal AI legislation are creating sector-specific requirements for AI transparency, bias testing, and human oversight in high-stakes decisions. Vertical SaaS companies operating in healthcare diagnostics, credit underwriting, and hiring are most exposed. Vendors that build compliance into their AI co-pilot architecture early will convert this regulatory burden into a switching-cost advantage, as customers become dependent on the vendor’s compliance infrastructure.
Data residency requirements, the legal obligation to store certain data within U.S. borders or specific state jurisdictions, are increasing infrastructure costs for SaaS companies serving government and regulated financial clients. The Federal Risk and Authorization Management Program (FedRAMP) certification, required for federal government SaaS contracts, costs an estimated $1-3 million to obtain and 6-18 months to complete, creating a durable barrier that protects incumbents. As of 2024, fewer than 300 cloud service offerings held active FedRAMP authorization (FedRAMP Program Management Office), underscoring how restrictive this certification pipeline remains and why incumbents with existing authorization hold a structural advantage over new entrants.
Capital Efficiency and Investment Landscape: Funding Trends and Valuation
Venture capital allocation within SaaS has shifted materially since 2022. According to the Kauffman Foundation’s research on venture capital deployment patterns, capital efficiency metrics now rank among the top three criteria in early-stage SaaS due diligence (Kauffman Foundation). In 2025-2026, an estimated 38% of total SaaS venture funding flowed to vertical B2B companies, up from 24% in 2021, while AI co-pilot SaaS attracted approximately 29% of SaaS-category venture dollars.
The Rule of 40 (a SaaS health metric where revenue growth rate plus EBITDA margin should equal or exceed 40%) has become the standard institutional investor benchmark. Top-quartile vertical B2B SaaS companies in 2026 average a Rule of 40 score of 52, compared to 38 for horizontal SaaS peers. This gap directly translates to valuation: public market SaaS companies with Rule of 40 scores above 50 trade at a median of 9x forward revenue, versus 5x for those below 40, according to analysis of SEC filings for publicly traded SaaS companies (U.S. Securities and Exchange Commission).
Exit multiples by subsegment for 2026-2031 are expected to follow this hierarchy: AI co-pilot SaaS with proven productivity outcomes at 12x-18x revenue, vertical B2B SaaS with NRR above 120% at 8x-12x revenue, and horizontal SaaS at 4x-7x revenue. Founders targeting premium exits should prioritize NRR expansion, gross margin improvement, and demonstrable AI integration over pure revenue growth.
For founders building financial projections, the SaaS Financial Model Excel Template from eFinancialModels provides industry-standard unit economics assumptions calibrated to these benchmark ranges.
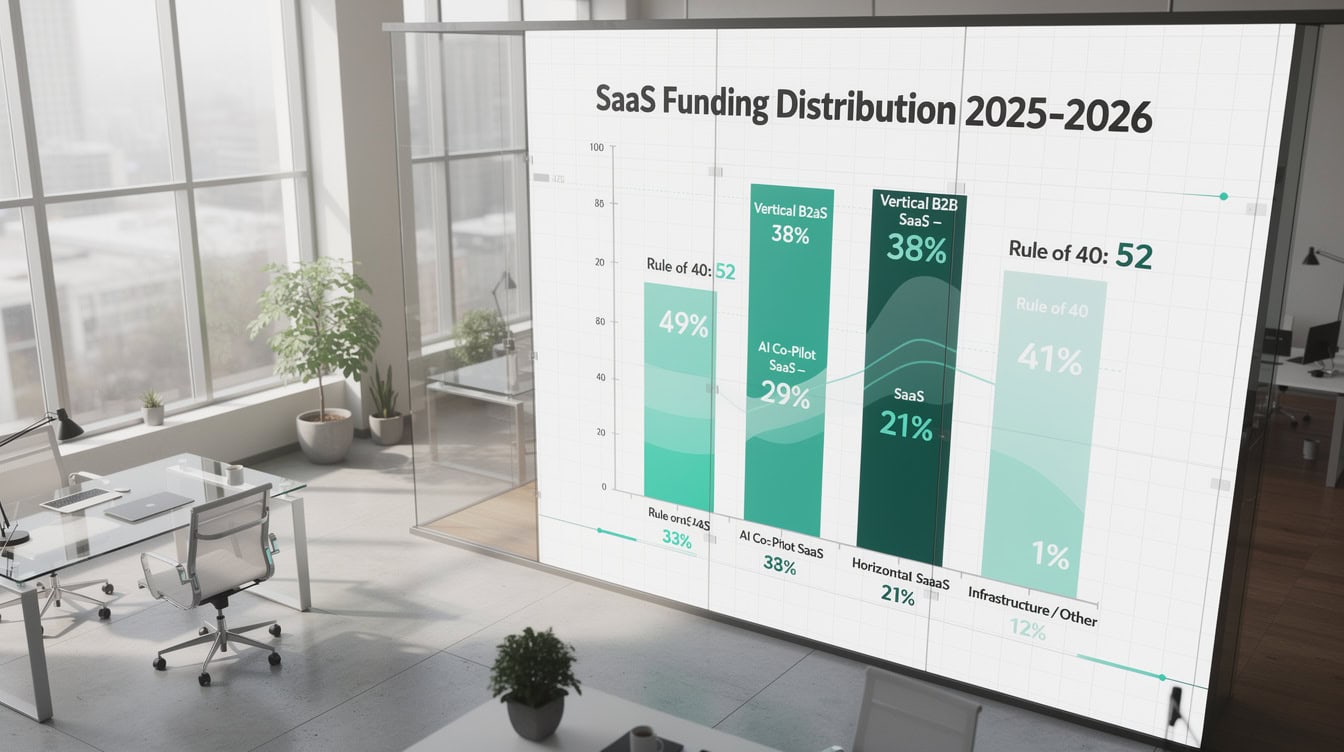
Vertical B2B SaaS captured 38% of SaaS venture funding in 2025-2026, up from 24% in 2021, as investors prioritize capital efficiency over growth-at-all-costs.
Technology Infrastructure Dependencies and Platform Risk
Cloud infrastructure spending as a percentage of revenue is a critical efficiency metric for SaaS companies. Horizontal SaaS companies average 18-22% of revenue on cloud infrastructure; vertical B2B SaaS companies, which often process more complex, compliance-sensitive data, average 15-20%; AI co-pilot SaaS companies average 22-30% due to LLM inference costs. As hyperscaler pricing declines and model efficiency improves, AI co-pilot infrastructure costs are projected to fall to 12-18% of revenue by 2029-2030. For context, Amazon Web Services reported more than $100 billion in annual revenue for 2023 (U.S. Securities and Exchange Commission), illustrating the enormous scale of the hyperscaler infrastructure market on which SaaS companies depend and the pricing leverage that AWS, Azure, and Google Cloud hold over their SaaS customers.
API economy maturation is a structural tailwind for vertical SaaS. The proliferation of standardized healthcare data APIs (HL7 FHIR), financial data APIs (Plaid, FDX), and construction data standards (buildingSMART) reduces the integration cost of connecting vertical SaaS platforms to adjacent systems. Companies that build on open API standards reduce their platform risk and accelerate time-to-value for new customers.
Platform concentration risk, the dependency on a single hyperscaler or platform vendor, remains a material concern. SaaS companies with more than 60% of their infrastructure on a single cloud provider face negotiating disadvantage and potential service disruption risk. Multi-cloud architecture adds 3-5% to infrastructure costs but reduces this concentration risk meaningfully.
For modeling cloud infrastructure costs and their impact on SaaS unit economics, the Freemium SaaS Financial Model includes infrastructure cost assumptions as a configurable input.
Market Forecast Scenarios and Key Risk Factors 2026-2031
Three scenarios bracket the 2031 USA SaaS market outcome. The base case (55% probability) projects $510 billion in total market revenue at 12% CAGR, with vertical B2B at 18% CAGR and AI co-pilot at 28% CAGR. The bull case (25% probability) projects $620 billion at 16% CAGR, driven by faster-than-expected AI adoption and accelerated enterprise digital transformation. The bear case (20% probability) projects $390 billion at 6% CAGR, driven by a prolonged enterprise IT spending freeze, AI regulatory overreach, or a significant data breach event that triggers customer consolidation.
Key downside risks include: federal AI legislation that imposes liability on SaaS vendors for AI-generated outputs, a hyperscaler pricing increase that compresses AI co-pilot margins, and macroeconomic conditions that cause enterprise buyers to consolidate to fewer, larger SaaS vendors (benefiting horizontal incumbents at the expense of vertical specialists). Key upside catalysts include faster-than-expected LLM cost deflation, new vertical SaaS categories emerging from healthcare AI diagnostics and autonomous manufacturing, and continued private equity roll-up activity sustaining premium M&A multiples.
Frequently Asked Questions
What is the projected size of the USA SaaS market by 2031?
The USA SaaS market is projected to reach approximately $510 billion by 2031 in the base case scenario, growing from an estimated $295 billion in 2026 at a blended CAGR of roughly 12%. This projection reflects continued enterprise adoption of cloud software, the expansion of AI co-pilot features across existing SaaS platforms, and the deepening penetration of vertical B2B SaaS into industries that were previously underserved by software. The bull case scenario, which assumes faster AI adoption and sustained enterprise IT spending, projects a 2031 market size of $620 billion. Founders and investors should model sensitivity to both scenarios when building 5-year financial projections, using the SaaS Financial Model Bundle to stress-test assumptions.
How does vertical B2B SaaS differ from horizontal SaaS in unit economics?
Vertical B2B SaaS consistently outperforms horizontal SaaS on the three most important unit economics metrics. Median gross margins for vertical B2B SaaS run 75-82%, compared to 68-75% for horizontal SaaS, because vertical vendors command higher pricing power and face less commoditization pressure. CAC payback periods average 14-18 months for vertical B2B versus 20-26 months for horizontal, reflecting higher average contract values in niche markets. Most importantly, net revenue retention for top-quartile vertical B2B SaaS companies exceeds 125%, meaning the existing customer base grows revenue by 25% annually through upsells and expansions, without requiring new customer acquisition. This NRR advantage compounds dramatically over a 5-7 year customer relationship, producing LTV:CAC ratios of 5x-7x versus 2x-3.5x for horizontal peers.
What is AI co-pilot SaaS and how is it priced?
AI co-pilot SaaS refers to AI-powered assistant features embedded within or layered on top of existing software applications, helping users complete tasks faster or with greater accuracy. Examples include AI-assisted contract review in legal SaaS, AI-generated financial narratives in accounting SaaS, and AI-driven anomaly detection in manufacturing SaaS. The dominant pricing model in 2026 is a per-seat premium add-on, typically priced at 20-40% above the base SaaS subscription. Outcome-based pricing, where the vendor charges based on measurable productivity outcomes (such as hours saved or errors reduced), is gaining traction in legal and financial services verticals. Embedded AI co-pilots show 3x faster adoption than standalone AI tools because they eliminate a separate procurement decision for the enterprise buyer.
What regulatory risks should vertical SaaS founders anticipate through 2031?
Vertical SaaS founders operating in regulated industries face three categories of regulatory risk through 2031. First, sector-specific compliance requirements (HIPAA in healthcare, SEC/FINRA in financial services, FedRAMP for government) consume 8-15% of revenue in engineering and legal overhead, but also create durable competitive moats once achieved. Second, emerging AI governance frameworks, including the White House Executive Order on AI and anticipated federal AI legislation, will impose transparency, bias testing, and human oversight requirements on AI co-pilot features used in high-stakes decisions. Third, data residency requirements are expanding, with state-level privacy laws in California (CCPA), Virginia, and Colorado creating a patchwork of compliance obligations that increase engineering costs for multi-state SaaS deployments. Founders should budget 10-15% of revenue for compliance in regulated verticals and treat compliance certifications as a strategic asset, not just a cost center.
What valuation multiples should SaaS founders expect at exit in 2026-2031?
Exit multiples vary significantly by subsegment and unit economics quality. AI co-pilot SaaS companies with proven productivity outcomes and NRR above 120% are commanding 12x-18x forward revenue in strategic M&A transactions. Vertical B2B SaaS companies with NRR above 120% and Rule of 40 scores above 50 are achieving 8x-12x revenue multiples. Horizontal SaaS companies without a clear vertical or AI differentiation are trading at 4x-7x revenue. The Rule of 40 score (revenue growth rate plus EBITDA margin) is the single most predictive metric for public market SaaS valuations: companies above 50 trade at a median of 9x forward revenue versus 5x for those below 40, based on SEC filings analysis. Founders targeting premium exits should prioritize NRR expansion and gross margin improvement over pure top-line growth.
How much venture capital is flowing to vertical B2B SaaS versus AI co-pilot SaaS?
In 2025-2026, vertical B2B SaaS attracted approximately 38% of total SaaS-category venture capital, up from 24% in 2021, reflecting investor preference for capital-efficient businesses with strong retention characteristics. AI co-pilot SaaS attracted approximately 29% of SaaS venture dollars, with the remainder going to horizontal platforms and infrastructure. The shift toward vertical B2B reflects the post-2022 repricing of growth-at-all-costs models: investors now prioritize CAC payback periods below 18 months, gross margins above 70%, and NRR above 110% as minimum thresholds for Series B and beyond. Founders raising in 2026-2027 should expect institutional investors to benchmark their unit economics against the vertical B2B medians in this article and to require a clear path to Rule of 40 compliance within 24 months of the funding round.
What cloud infrastructure cost benchmarks should SaaS companies model?
Cloud infrastructure spending as a percentage of revenue varies by SaaS category and has direct implications for gross margin modeling. Horizontal SaaS companies average 18-22% of revenue on cloud infrastructure costs. Vertical B2B SaaS companies average 15-20%, benefiting from more predictable workloads and higher pricing power that offsets compliance-related infrastructure overhead. AI co-pilot SaaS companies currently average 22-30% of revenue on infrastructure due to LLM inference costs, the compute expense of running AI model queries at scale. As hyperscaler pricing declines and model efficiency improves, AI co-pilot infrastructure costs are projected to fall to 12-18% of revenue by 2029-2030, which will drive gross margin expansion of 8-12 percentage points for AI co-pilot vendors. Founders should model infrastructure costs as a declining percentage of revenue over a 5-year horizon, with the steepest decline occurring in years 3-5 as AI model costs deflate.
Conclusion
The USA SaaS market’s 2026-2031 trajectory rewards specialization and AI integration over scale alone. Vertical B2B SaaS companies with deep workflow integration, NRR above 120%, and compliance moats in regulated industries represent the highest-quality investment targets in the current environment. AI co-pilot SaaS is transitioning from a growth story to a margin story as infrastructure costs decline and pricing models mature. Founders and investors who anchor their analysis to unit economics, rather than revenue multiples alone, will identify the compounders that the market is currently mispricing.
I recommend downloading the SaaS Financial Model Excel Template to build accurate 5-year projections for vertical B2B or AI co-pilot SaaS businesses using the industry-standard unit economics benchmarks and growth assumptions detailed in this analysis.
























































