
0 ITEMS

Web Development Agency Financial Model Excel Template
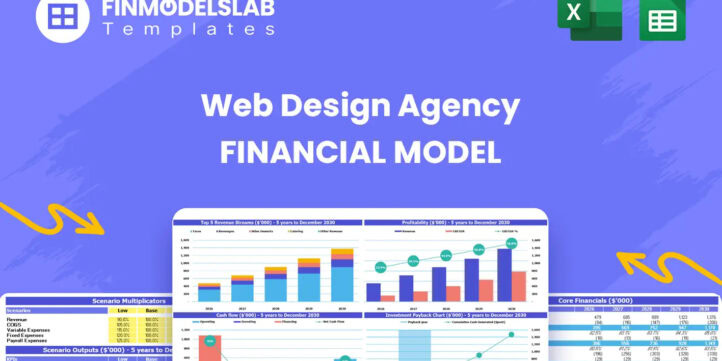
The Web Design Agency Financial Model helps entrepreneurs, founders, consultants, analysts, and agency owners build a structured five-year financial forecast for a web design, web development, or digital design services business. Instead of starting from a blank spreadsheet, users can work from a ready-to-use financial model template tailored to the economics of an agency, including project-based revenue, recurring maintenance income, client acquisition, staffing, direct service costs, operating expenses, cash flow, and profitability. It is designed to support business planning, internal budgeting, funding discussions, and stakeholder presentations. This template helps users translate practical agency assumptions into financial projections. You can model revenue assumptions based on services such as custom website design, website maintenance, e-commerce integration, and content creation, then connect those assumptions to marketing spend, customer acquisition cost, billable hours, hourly rates, and service mix. The model also supports planning around startup costs, operating expenses, payroll, contractor fees, and growth in team capacity, helping users see how commercial decisions affect margins, monthly cash flow, and long-term profitability. Built for decision-making, the Web Design Agency Financial Model gives users a clearer view of whether the business can generate enough revenue to support its cost structure and growth plans. It includes key outputs such as profit and loss projections, cash flow forecasts, balance sheet views, break-even analysis, return metrics, scenario analysis, charts, dashboards, and bank-ready reports. These outputs are useful for evaluating pricing strategy, hiring plans, marketing budgets, funding needs, and the timing of expansion. Users can test conservative, base, and growth scenarios to understand the impact of different assumptions before committing resources. The template is fully editable and suitable for use in Microsoft Excel or Google Sheets, making it practical for both financial and non-financial users. It can be customized for a new agency launch, an existing studio, a freelance web design business scaling into a team, or a digital agency preparing a business plan. With pre-built formulas, organized inputs, and professional formatting, the template saves time while giving users a credible framework for presenting financial projections to investors, lenders, partners, or internal decision-makers.


Financial Model Overview
The Web Design Agency Financial Model is a ready-to-use financial model template created for founders, entrepreneurs, agency owners, consultants, analysts, and business planners who need to forecast the financial performance of a web design or digital agency. It brings together the key assumptions that drive this type of business, including billable service revenue, recurring maintenance work, customer acquisition, pricing, payroll, contractor costs, startup investment, operating expenses, cash flow, profitability, and return metrics. For a web design agency, financial planning is especially important because revenue can come from a mix of one-time projects and recurring retainers, while delivery costs depend on team capacity, freelance support, software tools, and marketing efficiency. This template gives users a structured way to connect those moving parts into a five-year forecast that can support business planning, funding preparation, budgeting, and strategic decision-making. It is fully editable, compatible with Excel and Google Sheets, and designed to help users replace guesswork with a practical financial planning framework that can be updated as assumptions change.
All-in-One Dashboard
The all-in-one dashboard gives users a central view of the most important inputs and outputs in the Web Design Agency Financial Model. This section is designed to make the model easier to navigate by bringing together the assumptions and results that matter most, such as revenue drivers, expense categories, profitability measures, cash flow outputs, break-even timing, payback period, and return metrics. For a web design agency, this dashboard is useful because managers often need to understand several financial questions at once, including whether project revenue can cover payroll, whether recurring maintenance income is growing, whether monthly cash balances remain healthy, and whether the business is moving toward sustainable profitability. By summarizing the model in one place, the dashboard helps users review the forecast without manually searching through separate worksheets. It can also support discussions with investors, lenders, partners, and internal teams by presenting the financial story in a clear, organized format. Users can update the editable assumptions and see how the dashboard reflects changes across the model, making it a practical tool for planning, reviewing, and communicating performance.
Low, Base, and High Scenario Analysis
The Low, Base, and High scenario analysis section allows users to test how the agency may perform under different business conditions. This is particularly valuable for a web design agency because performance can vary depending on client acquisition, close rates, hourly pricing, project volume, retention of maintenance clients, payroll timing, and contractor usage. A low scenario might reflect slower client growth, lower billable rates, or weaker demand, while a base scenario can represent the expected business plan and a high scenario can show the impact of stronger sales, improved pricing, or faster growth in recurring services. The section helps users compare revenue, cash flow, profitability, funding needs, and return metrics across different assumptions, which is useful for risk management and contingency planning. Instead of relying on one static projection, users can evaluate a realistic range of outcomes and understand which assumptions have the greatest impact on financial performance. This makes the model more useful for strategic decisions such as when to hire, how much to spend on marketing, how aggressively to pursue growth, and how much cash reserve may be needed if conditions are less favorable than expected.
Professional Charts
The professional charts section turns the financial forecast into visual outputs that are easier to understand, review, and present. Charts can help communicate trends in revenue, gross profit, operating expenses, EBITDA, net income, cash flow, cash balance, and other key financial metrics over the forecast period. For a web design agency, visual reporting is useful because the business model often evolves over time, with early revenue driven by custom website projects and later performance supported by a stronger base of recurring maintenance or support services. Charts help users see whether revenue is growing steadily, whether margins are improving, whether expenses are scaling appropriately, and whether cash flow remains stable as the team expands. These visuals can be used in business plans, investor decks, lender discussions, internal reviews, or management meetings. Because the charts are connected to the underlying model, they can update as assumptions change, allowing users to quickly compare different versions of the forecast. This section adds presentation value while also helping users spot financial patterns that may be harder to identify in tables alone.
ROE Components and DuPont Analysis
The ROE components and DuPont analysis section helps users evaluate how efficiently the web design agency generates returns from its capital base. Return on equity is a useful metric for investors and owners because it connects profitability, asset efficiency, and financial structure into a single performance view. The DuPont framework breaks ROE into underlying drivers, helping users understand whether returns are coming from strong profit margins, effective use of assets, or leverage. For a web design agency, this can be especially helpful because the business may not require heavy physical assets, but it still depends on efficient use of working capital, payroll investment, technology, and client acquisition spending. Inputs may include net income, equity, revenue, assets, and other financial statement figures produced by the model. The output helps users go beyond basic profit projections and evaluate the quality of the agency’s financial performance. This section is useful for investor presentations, strategic planning, and performance improvement because it highlights whether the agency is simply growing revenue or actually generating attractive returns from the resources invested in the business.
Revenue Inputs
The revenue inputs section is where users define the commercial assumptions that drive the web design agency forecast. It may include service categories such as custom website design, website maintenance, e-commerce integration, and content creation, along with assumptions for billable hours, hourly rates, client acquisition, marketing budget, customer acquisition cost, project volume, and service mix. These inputs are central to the model because revenue in an agency business is usually driven by both new project sales and ongoing recurring relationships. By adjusting pricing, expected client volume, recurring maintenance adoption, or the mix of services, users can see how different strategies affect total revenue and profitability. This section helps users create a forecast that reflects the actual way their agency plans to operate rather than relying on a generic sales estimate. It is also useful for testing pricing decisions, marketing efficiency, staffing needs, and the financial impact of shifting toward higher-margin or recurring services. Clear revenue inputs make the overall financial model more transparent, easier to audit, and more credible for business plans and funding conversations.
Bank-Ready Reports
The bank-ready reports section provides organized financial outputs that can support lender reviews, funding applications, investor discussions, and professional business planning. These reports typically bring together the financial statements and summary outputs that external stakeholders expect to see, such as profit and loss projections, cash flow forecasts, balance sheet views, revenue summaries, expense projections, profitability metrics, and financing-related indicators. For a web design agency seeking a loan, investment, or partner funding, lenders and investors need more than a simple revenue estimate. They want to see whether the business can generate enough profit and cash flow to cover expenses, repay obligations, fund growth, and withstand changes in market conditions. This section helps present the forecast in a structured, lender-friendly format, reducing the time required to prepare financial documents from scratch. The reports also help users review the business internally, identify gaps in the plan, and communicate financial expectations clearly. Because the outputs are generated from the model’s assumptions, users can update their inputs and quickly refresh the reporting package for different planning scenarios or stakeholder requirements.
Revenue Breakdown
The revenue breakdown section provides a detailed view of how total agency revenue is built from individual revenue streams. This is important for a web design agency because not all revenue has the same margin, timing, risk, or operational requirement. Custom website design may generate larger upfront project fees, while website maintenance can provide recurring monthly income, e-commerce integration may carry higher complexity and pricing, and content creation may add supporting service revenue. This section helps users see how much each service contributes to total revenue over time and how the mix changes as the agency grows. Inputs may include service pricing, billable hours, number of clients, recurring contract adoption, project frequency, and growth assumptions. Outputs may show revenue by service line, percentage contribution, total sales, and year-over-year growth. The section is useful for strategic decision-making because it helps users identify which services drive the most value, where margins may be strongest, and whether the business is becoming too dependent on one revenue source. It also supports pricing reviews, sales planning, hiring decisions, and investor explanations of how the agency will generate income.
KPI Dashboard
The KPI dashboard section focuses on the performance metrics that help users evaluate whether the web design agency is operating efficiently and moving toward its financial goals. Relevant KPIs may include revenue growth, gross margin, EBITDA margin, net profit margin, customer acquisition cost, cash balance, recurring revenue share, revenue per employee, project profitability, payback period, and return measures. This section is useful because a web design agency can look profitable in total while still having operational issues, such as high acquisition costs, weak margins on certain services, insufficient recurring revenue, or payroll growing faster than sales. The KPI dashboard helps users monitor these signals in a concise format and compare performance against targets or industry benchmarks where applicable. It can support monthly reviews, management meetings, investor updates, and planning sessions by turning the financial model into an operating tool rather than a one-time forecast. Because the KPIs are connected to the underlying assumptions and projections, users can see how changes in pricing, marketing, staffing, or delivery costs influence the metrics that matter most for growth and profitability.
Startup Cost and Operating Expense Planning
The startup cost and operating expense planning section helps users estimate the investment required to launch and run a web design agency. Startup costs may include office setup, computer workstations, software subscriptions, agency website development, branding, legal setup, initial marketing, deposits, equipment, and working capital reserves. Operating expenses may include rent or coworking costs, software tools, hosting, accounting, insurance, marketing, professional services, administration, communication tools, and other recurring overhead. This section is valuable because many agency founders underestimate how much cash is needed before consistent client revenue is established. By separating one-time launch expenses from recurring monthly costs, the model helps users understand initial funding needs, monthly burn rate, and the expense base that revenue must support. It also allows users to adjust assumptions for a lean remote agency, a small office-based studio, or a growing team with more infrastructure. The outputs can support budgeting, loan applications, investor discussions, and internal spending controls. For decision-making, this section helps users identify which costs are essential at launch, which can be delayed, and how overhead may affect cash flow and profitability over the first five years.
Break-Even and Funding Requirements
The break-even and funding requirements section helps users determine when the web design agency may become profitable and how much capital may be needed to reach that point. Break-even analysis compares revenue with fixed and variable costs to estimate the point at which the business covers its expenses and begins generating profit. For a web design agency, this can depend on the number of clients acquired, average project value, recurring maintenance revenue, payroll level, contractor costs, marketing spend, and overhead. The funding requirement view helps users understand whether available cash is sufficient to cover startup costs, early operating expenses, hiring, marketing, and any temporary cash shortfalls before the business becomes self-sustaining. Outputs may include break-even month, cumulative cash need, minimum cash balance, payback period, and capital required under different scenarios. This section is useful for founders preparing funding plans, lenders assessing repayment capacity, and owners deciding how aggressively to invest in growth. It also supports better timing decisions around hiring, marketing campaigns, equipment purchases, and expansion. By showing the path to profitability and the capital needed to get there, this component helps users build a more realistic and financeable agency plan.
File types:
Excel – Single-User: .xlsx
Excel – Multi-User: .xlsx
Similar ProductsOther customers were also interested in...


 HenrySheykin
Web Design Agency Financial Model Excel Template
The Web Design Agency Financial Model helps entrepreneurs, founders, consultants, analysts, and agen... Read more

Mobile Application Development Agency Financial Mo...
The Mobile App Development Financial Model helps founders, agencies, consultants, analysts, and busi... Read more
Call Center Financial Model Excel Template
The Call Center Financial Model helps users build a structured financial forecast for launching, man... Read more

Online Coaching Marketplace Financial Model Excel ...
The Online Coaching Platform Financial Model helps founders, entrepreneurs, consultants, analysts, a... Read more

Virtual Assistant Service Financial Model Excel Te...
The Virtual Assistant Service Financial Model Template helps entrepreneurs, founders, consultants, a... Read more

 Giorgos
Tech/I.T. Services Company – 5 Year Financial Mo...
5-year financial model for a tech/IT services company providing revenue forecasts, cost analysis, an... Read more
You must log in to submit a review.