
0 ITEMS

Petrochemical Engineering Company Financial Model
This is a 5 Year 3 Statement financial model for a Petrochemical Engineering Company that involves incorporating key elements from its business operations.
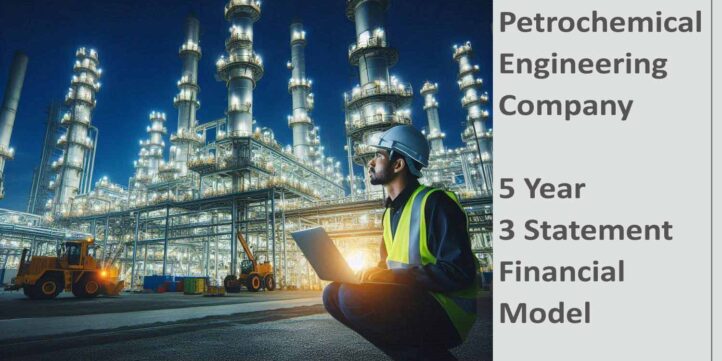


This is a financial model for a Petrochemical Engineering Company that involves incorporating key elements from its business operations, segmented into different services. Below is a detailed structure for the financial model, with considerations for an Income Statement, Cash Flow Statement, and Balance Sheet, along with revenue and expense breakdowns for the specified service areas:
1. Income Statement
The Income Statement captures revenues and expenses to calculate profitability.
Revenue Breakdown
Include income streams from the following services:
- Industrial Project Management:
- Revenue from consulting, planning, and oversight of projects.
- Potential for recurring revenue if long-term contracts exist.
- Industrial Machine Maintenance:
- Service charges for regular maintenance contracts.
- Emergency maintenance or repairs at higher margins.
- Industrial Equipment Relocation:
- Income from logistical operations for moving equipment between facilities.
- Specialized fees for handling hazardous or oversized equipment.
- Mechanical and Electrical Services:
- Revenue from electrical installations, mechanical repairs, and upgrades.
- Industrial Construction:
- Contractual income from design-build projects.
- Progress payments on large-scale industrial builds.
Expense Breakdown
- Cost of Goods Sold (COGS):
- Labor costs (engineers, technicians).
- Equipment, materials, and supplies for projects and maintenance.
- Subcontractor costs for specific tasks.
- Operating Expenses:
- Administrative overhead.
- Marketing and sales efforts.
- Employee training and development.
- R&D for better tools and technologies.
- Depreciation/Amortization:
- Depreciation of machinery and vehicles used in relocation and construction.
- Amortization of intellectual property or software licenses.
- Taxes and Interest:
- Tax obligations.
- Interest on business loans or equipment financing.
Profitability Metrics
- Gross Profit.
- Operating Profit (EBIT).
- Net Profit.
2. Cash Flow Statement
The Cash Flow Statement tracks cash inflows and outflows across three categories.
Operating Activities
- Cash Inflows:
- Payments received from clients for project milestones, maintenance contracts, and equipment relocation jobs.
- Cash Outflows:
- Payments to suppliers, employees, and subcontractors.
- Utility costs and other day-to-day expenses.
Investing Activities
- Cash Outflows:
- Capital expenditures on new industrial equipment or facilities.
- Investment in software or technology for operational efficiency.
- Cash Inflows:
- Proceeds from the sale of old equipment or assets.
Financing Activities
- Cash Inflows:
- Borrowings for large-scale construction or new machinery purchases.
- Equity injections from investors.
- Cash Outflows:
- Loan repayments.
- Dividends to shareholders.
Net Cash Flow
Calculate the net cash position and ensure positive cash flow for business sustainability.
3. Balance Sheet
The Balance Sheet provides a snapshot of assets, liabilities, and equity.
Assets
- Current Assets:
- Cash and cash equivalents.
- Accounts receivable (client payments due for services rendered).
- Inventory of tools, machinery parts, and consumables.
- Non-Current Assets:
- Property, plant, and equipment (PP&E) used in construction, maintenance, and relocation.
- Intangible assets like software systems or licenses.
Liabilities
- Current Liabilities:
- Accounts payable (supplier invoices due).
- Short-term loans or lease obligations.
- Non-Current Liabilities:
- Long-term loans or bonds for equipment and construction.
- Pension liabilities for employees.
Equity
- Owner’s equity or retained earnings.
- Share capital if applicable.
4. Service-Specific Cost and Revenue Allocation
For better analysis, segment financial performance by service category:
- Industrial Project Management:
- Revenue: Based on consulting fees and project oversight percentages.
- Costs: Primarily labor (engineers/project managers) and travel expenses.
- Industrial Machine Maintenance:
- Revenue: Revenue is predictable if tied to recurring contracts.
- Costs: Spare parts, tools, and technical labor.
- Industrial Equipment Relocation:
- Revenue: High margins for complex relocations.
- Costs: Transportation logistics, crane or rig rentals, specialized labor.
- Mechanical and Electrical Services:
- Revenue: Depends on service contracts and installations.
- Costs: Electrical/mechanical components and skilled technicians.
- Industrial Construction:
- Revenue: Milestone-based payments.
- Costs: Materials (steel, concrete), labor, and subcontractor costs.
Financial Ratios and KPIs
To assess performance:
- Gross Margin by Service Line – Profitability per service.
- Operating Margin – Overall operational efficiency.
- DSO (Days Sales Outstanding) – Efficiency in receivables collection.
- ROA (Return on Assets) – Effectiveness in utilizing assets.
Similar ProductsOther customers were also interested in...



 eFinancialModels
Electric Vehicle (EV) Charging Station Financial M...
With this comprehensive 5- or 10-year monthly tool, investors can assess the viability of setting up... Read more

Financial Model for Mobile App | Mobile App Busine...
The Mobile App Financial Plan Template in Excel allows you to develop financial projections when lau... Read more

 HenrySheykin
Food Truck Financial Model Excel Template
The Food Truck Financial Model helps entrepreneurs, founders, business owners, consultants, and anal... Read more

Green Hydrogen Production from Wind Energy Financi...
The Green Hydrogen from Wind Financial Model aims to comprehensively forecast a horizon of 40 years ... Read more

Simple Mutual Non-Disclosure Agreement Template
Protect your business secrets with ease using our Simple Mutual Non-Disclosure Agreement Template. S... Read more

Solar Energy Financial Model
The Solar Energy Financial Model Spreadsheet Template in Excel assists you in preparing a sophistica... Read more

 Peter Graf
The Customer-Centric Financial Model for Restauran...
Starting a restaurant without a financial plan is like driving a car blindfolded. You wouldn´t do i... Read more
You must log in to submit a review.