
0 ITEMS

Pasta Maker Business Plan Financial Model Excel Template
The Pasta Making Financial Model Template helps entrepreneurs and planners turn a fresh pasta business idea into a structured financial forecast. Whether you are launching a small handmade pasta company, expanding a commercial pasta production operation, preparing a gourmet pasta brand, or building a business plan for investors, this template gives you a practical framework for estimating revenue, startup costs, operating expenses, payroll, cash flow, profitability, and funding needs. Instead of building spreadsheets from scratch, users can begin with a ready-to-use model designed around the financial drivers of a pasta making business. This template is built for founders, business owners, consultants, analysts, and anyone preparing funding documents, lender presentations, or internal planning materials. It helps users organize assumptions around product lines, production volume, pricing, ingredient costs, staffing, equipment purchases, delivery needs, marketing, and overhead. The model is fully editable, so users can adapt the assumptions to match a pasta shop, fresh pasta production facility, wholesale pasta supplier, direct-to-consumer pasta brand, or specialty food concept. By connecting core inputs to automated outputs, the template makes it easier to see how operational decisions affect financial performance. The Pasta Making Financial Model supports five-year projections and helps users evaluate the business from several angles. It can be used to model revenue assumptions, estimate cost of goods sold, review operating expenses, plan payroll, monitor cash flow, and understand when the business may become profitable. It also supports break-even analysis, scenario planning, profitability review, investor metrics, and decision-making around pricing, production capacity, hiring, equipment investment, and growth strategy. This makes it useful not only before launch, but also when updating budgets, comparing expansion options, or presenting financial results to stakeholders. For users preparing investor or lender materials, the template provides a more organized way to explain the numbers behind the business. It includes dashboards, reports, charts, KPIs, revenue views, scenario analysis, and financial statements that help communicate the opportunity clearly. The template is compatible with Microsoft Excel and Google Sheets, allowing users to customize, collaborate, and update forecasts as plans evolve. With pre-built formulas, editable assumptions, and a structure focused on the pasta making business model, it saves time while helping users make more informed financial decisions.
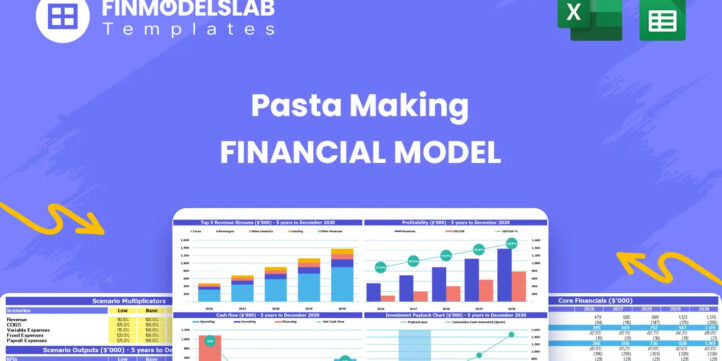


Financial Model Overview
The Pasta Making Financial Model Financial Model Template is a ready-to-use planning tool for entrepreneurs, food business owners, consultants, analysts, and founders who need to forecast the financial performance of a pasta making business. It is designed to help users evaluate a fresh pasta concept before launch, prepare funding documents, plan equipment investment, model product pricing, and understand the financial impact of production volume, ingredient costs, staffing, and operating expenses.
A pasta business can involve multiple product lines, perishable inventory, specialized equipment, wholesale and retail channels, delivery needs, and fluctuating input costs, so a structured financial model is essential for replacing guesswork with clear assumptions and measurable outputs.
This template brings those assumptions together in a customizable format that supports five-year projections, revenue planning, cash flow forecasting, profitability analysis, break-even review, and stakeholder presentation. Users can edit the inputs to match their own plans, whether they are developing a handmade pasta shop, a small-scale production facility, a gourmet ravioli brand, a wholesale pasta supplier, or a direct-to-consumer fresh pasta company.
All-in-One Dashboard
The all-in-one dashboard gives users a central view of the pasta business’s core inputs and outputs, making it easier to understand the model without searching through multiple worksheets. This component may summarize key assumptions such as launch timing, product pricing, sales volume, cost of goods sold, payroll, operating expenses, capital investments, and financing sources, then connect those assumptions to high-level results such as revenue, gross profit, EBITDA, net profit, cash balance, payback period, and break-even timing.
For a pasta making business, this is especially useful because many performance drivers interact with one another. A change in production volume may affect ingredient purchasing, labor requirements, packaging costs, delivery expenses, and working capital needs. The dashboard helps users see these relationships quickly and gives investors, lenders, or internal stakeholders a concise view of whether the plan is financially viable. It is also useful for decision-making because founders can update assumptions and immediately review the impact on profitability, cash flow, and funding requirements.
Low, Base, and High Scenario Analysis
The low, base, and high scenario analysis component allows users to test how different business conditions may affect the financial forecast. In the base case, users can model the expected operating plan, while the low case can reflect more conservative assumptions such as slower sales growth, lower production volume, higher ingredient costs, delayed wholesale accounts, or weaker demand during the early months. The high case can reflect stronger performance, such as faster retail adoption, premium pricing, higher wholesale order volume, or improved production efficiency.
This section is valuable for pasta making financial planning because the business may be sensitive to changes in flour, eggs, cheese, packaging, utilities, labor, and distribution costs. Scenario analysis helps users understand upside potential and downside risk before committing to equipment purchases, hiring plans, or facility leases. It is also useful for investor and lender conversations because it shows that the founder has considered more than one outcome and can explain how the business may perform under changing market conditions.
Professional Charts
The professional charts component turns the model’s financial outputs into presentation-ready visuals that make the forecast easier to understand. Instead of relying only on rows of numbers, users can review charts for revenue growth, profitability, gross margin, EBITDA, cash balance, expenses, break-even progress, and other important financial indicators. For a pasta making business, charts can help show whether sales are scaling across product lines, whether costs remain controlled as volume increases, and whether cash reserves are sufficient during the startup and growth phases.
These visual outputs are useful when presenting a business plan to investors, lenders, partners, landlords, grant providers, or internal team members who need a clear summary of the financial story. Charts also help users identify trends and potential problems faster than static tables. If ingredient costs rise faster than revenue, if cash declines after equipment purchases, or if profitability improves only under aggressive assumptions, the visuals can make these issues easier to spot and address.
ROE Components and DuPont Analysis
The ROE components and DuPont analysis section helps users evaluate return on equity by breaking performance into the underlying drivers that influence investor returns. Rather than looking only at a final profit number, this component can help analyze how margins, asset efficiency, and leverage contribute to overall return on equity. For a pasta making business, this matters because the company may require upfront investment in pasta extruders, mixers, refrigeration, kitchen build-out, packaging equipment, delivery vehicles, or working capital.
DuPont-style analysis helps users understand whether returns are being driven by strong operating profitability, efficient use of equipment and assets, or financing structure. This can be valuable for investors who want to see how capital is being used and whether the business can generate acceptable returns over time. It also helps founders make better strategic decisions, such as whether to buy or lease equipment, expand production capacity, add wholesale accounts, increase pricing, or optimize inventory turnover to improve financial performance.
Revenue Inputs
The revenue inputs component is where users define the commercial assumptions that drive the pasta making financial model. This section may include product lines, unit prices, monthly or annual sales volumes, production ramp-up assumptions, channel mix, seasonal growth, and annual price increases. For example, users may model separate revenue streams for classic fettuccine, pappardelle, pumpkin ravioli, campanelle, lumache, or other fresh pasta products. They can also adjust assumptions for retail sales, wholesale orders, catering supply, farmers market sales, restaurant accounts, delivery sales, or subscription-style pasta boxes.
This component is essential because revenue projections must be built from clear operating assumptions rather than broad estimates. By connecting units sold and prices to total revenue, the model helps users test whether the business has enough sales potential to cover cost of goods sold, payroll, rent, utilities, marketing, delivery, and debt obligations. It also helps users evaluate pricing strategy, product mix, capacity planning, and growth targets before making major commitments.
Bank-Ready Reports
The bank-ready reports component organizes the model’s financial outputs into a format that is easier for lenders and financing partners to review. These reports may include forecasted income statements, cash flow statements, balance sheets, debt schedules, funding needs, and summary metrics that show repayment capacity and financial stability. For a pasta making company seeking a loan for equipment, build-out, delivery vehicles, refrigeration, or working capital, clear reports can make a major difference in how the application is evaluated.
Lenders typically want to understand startup investment, expected revenue, gross margins, operating expenses, cash reserves, debt service coverage, and whether the business can remain liquid during the early months. This component helps users present those details in a structured way, reducing confusion and improving credibility. It also helps founders prepare for lender questions by showing how assumptions flow into projected profitability and cash flow. Because the model is editable, users can update the reports to reflect different loan amounts, repayment terms, or funding structures.
Revenue Breakdown
The revenue breakdown component provides a more detailed view of how total sales are generated across the pasta business. Instead of showing only one revenue total, this section can separate income by product type, channel, customer segment, price point, or volume assumption. For a pasta making business, this is especially useful because margins and demand may vary significantly between products. A premium ravioli product may generate higher revenue per unit but require more labor and ingredients, while a classic pasta line may be easier to scale at a lower price point.
Wholesale sales may create stable volume but lower margins, while direct-to-consumer sales may offer better profitability but require more marketing and fulfillment. By reviewing the revenue breakdown, users can understand which products or channels contribute most to sales and which may need adjustment. This component supports pricing decisions, product development, production scheduling, inventory planning, and sales strategy. It also gives investors and stakeholders a clearer view of where growth is expected to come from.
KPI Dashboard
The KPI dashboard component tracks the performance metrics that matter most for managing and evaluating a pasta making business. It may include indicators such as revenue growth, gross margin, EBITDA margin, net profit margin, cash balance, cost of goods sold as a percentage of revenue, payroll ratio, operating expense ratio, return on equity, payback period, break-even timing, production efficiency, and sales by product category.
This section helps users compare projected performance against internal targets or industry benchmarks, making the financial model more useful for ongoing management as well as pre-launch planning. For founders, KPIs can highlight whether the business is moving toward sustainable profitability or whether costs are rising too quickly. For investors and lenders, KPIs provide a concise way to assess financial health, scalability, and operating discipline. The KPI dashboard also supports regular performance reviews because users can update assumptions or actual results and quickly evaluate whether the pasta business remains on track.
Startup and Operating Cost Planner
The startup and operating cost planner helps users estimate the capital required to launch and run the pasta making business. Startup costs may include a commercial pasta extruder, dough mixer, refrigeration units, kitchen build-out, installation, smallwares, packaging setup, initial ingredients, licenses, deposits, branding, website setup, delivery vehicle, insurance, and launch marketing. Operating expenses may include rent, utilities, payroll, repairs and maintenance, software, accounting, delivery costs, marketing, insurance, cleaning supplies, professional fees, and general administration.
This component is important because pasta production businesses often require meaningful upfront investment before revenue begins, and missing a major cost category can create funding gaps. By separating one-time launch costs from recurring expenses, the model helps users understand both the initial funding requirement and the ongoing cost structure. It also supports budgeting, lender discussions, and operational planning by showing how fixed and variable expenses influence profitability and cash needs. Users can customize each line item to reflect their market, facility size, equipment strategy, and launch plan.
Break-Even and Cash Flow Forecast
The break-even and cash flow forecast component helps users understand when the pasta making business may cover its costs and whether it has enough liquidity to operate through startup and growth. Break-even analysis may use assumptions for revenue, gross margin, fixed expenses, payroll, production costs, and pricing to estimate the sales level or timing required to reach profitability. The cash flow forecast goes further by showing how money moves in and out of the business over time, including startup spending, sales receipts, supplier payments, payroll, loan proceeds, debt repayment, taxes, capital expenditures, and working capital needs.
This is critical for a pasta business because equipment purchases, inventory, packaging, and facility costs can create cash pressure even when the income statement appears profitable. The forecast helps users identify potential shortfalls before they happen, plan funding needs, negotiate supplier terms, adjust hiring plans, or delay discretionary spending. It also gives investors and lenders confidence that the founder understands not only profitability, but also the cash timing required to keep the business operating smoothly.
File types:
Excel – Single-User: .xlsx
Excel – Multi-User: .xlsx
Similar ProductsOther customers were also interested in...


 HenrySheykin
Toy Manufacturing Business Plan Financial Model Ex...
The Toy Manufacturing Financial Model helps users turn a toy production concept into a structured, e... Read more

Soft Drink Factory Business Plan Financial Model E...
The Soft Drink Manufacturing Financial Model helps entrepreneurs, beverage founders, business owners... Read more

Teddy Bear Manufacturing Business Plan Financial M...
The Teddy Bear Manufacturing Financial Model Template helps turn a stuffed toy business idea into a ... Read more

 Jason Varner
Product + Subscription Financial Model
Build a strategy for adding recurring revenues services to your product. Includes financial statemen... Read more

Industry Based Financial Models (Variety Bundle)
There are currently 52 unique financial models included in this bundle. Nearly all of that include a... Read more

 JILL LIU
Ultra Fashion Revenue and DCF Valuation Model
In this model, we presented a completed revenue and DCF valuation model for an Ultra-Fashion project... Read more
 anthony
Bundle – Business Financial Forecasting Mode...
The purpose of this Bundle of Business Forecasting and Financial Models is to assist Business Owners... Read more
Online Clothing Store Financial Model Excel Templa...
The Online Clothing Store Financial Model helps founders, entrepreneurs, business owners, consultant... Read more
Food Production Financial Model Excel Template
The Food Manufacturing Financial Model helps entrepreneurs, founders, consultants, analysts, and bus... Read more
Monthly Recurring Revenue SaaS Financial Model Exc...
The SaaS Business Financial Model helps founders, entrepreneurs, consultants, analysts, and business... Read more
You must log in to submit a review.