
0 ITEMS

Movie Theater Business Plan Financial Model Excel Template
The Movie Theater Financial Model helps users turn a cinema concept into a structured financial forecast that can be used for planning, funding discussions, and operational decision-making. Instead of building a model from scratch, buyers get a ready-to-use template designed around the economics of a movie theater, including attendance assumptions, ticket pricing, concession revenue, private events, startup costs, operating expenses, payroll, cash flow, profitability, and break-even analysis. The model is built to help users understand whether a theater can generate enough revenue to support its fixed costs, staffing needs, film licensing fees, equipment investment, and growth plans. This financial model template is suitable for entrepreneurs launching a new cinema, business owners evaluating an expansion, consultants preparing client plans, analysts reviewing feasibility, and founders creating investor or lender documents. It is especially useful when you need to explain the financial logic behind the business in a clear way, such as how many visitors are needed, how ticket and food and beverage revenue interact, how much capital is required before opening, and when the business may become profitable. The template supports both high-level strategic planning and detailed financial review. The model helps organize key assumptions across revenue streams, cost structure, payroll, capital expenditures, and financing needs, so users can test different versions of the business before committing resources. It allows users to adjust pricing, attendance, concession purchase rates, event volume, expense levels, and other inputs to see how the forecast changes. This makes it easier to compare possible outcomes, prepare for downside risks, evaluate upside opportunities, and make more confident decisions about launch timing, funding, staffing, pricing, and marketing. Designed for practical use, the Movie Theater Financial Model includes investor-ready formatting, editable assumptions, professional outputs, and visual summaries that help simplify complex financial data. Users can review projected profit and loss, cash flow, key performance indicators, return metrics, and funding needs in one connected model. Whether the goal is to secure financing, prepare a business plan, validate a movie theater startup idea, or manage an existing cinema more effectively, this template provides a structured foundation for financial planning and decision-making.
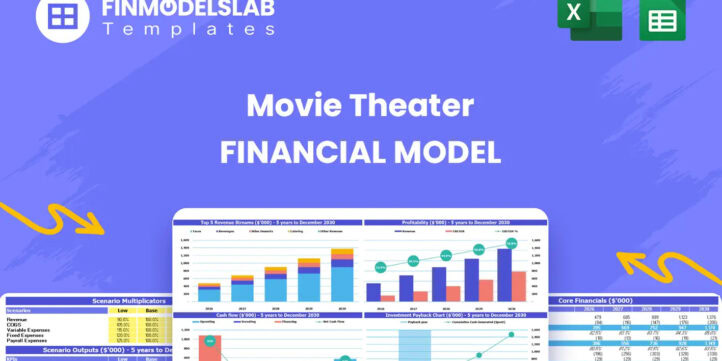


Financial Model Overview
The Movie Theater Financial Model is a ready-to-use financial model template designed to help entrepreneurs, cinema operators, consultants, analysts, and business planners evaluate the financial potential of a movie theater business. A theater has several moving parts, including ticket sales, concession revenue, private events, film licensing fees, payroll, rent, utilities, technology investment, seating upgrades, and marketing expenses. This model brings those assumptions together in a structured forecast so users can understand revenue potential, operating cost requirements, cash flow timing, profitability, and funding needs. It is useful for preparing a business plan, building an investor presentation, supporting a loan application, reviewing expansion opportunities, or testing whether a proposed theater concept can reach sustainable profitability. With editable inputs and connected outputs, the template helps replace guesswork with a clear financial planning process that can be updated as assumptions change.
All-in-One Dashboard
The all-in-one dashboard gives users a centralized view of the most important inputs and outputs in the Movie Theater Financial Model. Instead of searching through multiple tabs to understand the business case, users can review core assumptions and headline results in one place, including revenue, expenses, profit, cash flow, investment requirements, and selected performance indicators. This component is useful because a movie theater forecast depends on many connected drivers, such as attendance volume, ticket pricing, food and beverage purchases, event bookings, staffing levels, and operating costs. By showing key metrics together, the dashboard helps users quickly assess whether the model is producing realistic results and whether the business is moving toward financial sustainability. It also supports faster decision-making during planning meetings, investor discussions, and internal reviews because the most important figures are presented in a simple, organized format. Users can update assumptions and immediately see how those changes affect the forecast, making the dashboard a practical control center for the entire planning process.
Low, Base, and High Scenario Analysis
The low, base, and high scenario analysis section allows users to evaluate how the movie theater may perform under different market conditions. A cinema business can be affected by attendance trends, film release schedules, pricing sensitivity, local competition, consumer spending, and event demand, so relying on one forecast can be risky. This component helps users compare a conservative case, an expected case, and an optimistic case using adjustable assumptions for ticket visits, concession conversion, average spend, private event volume, expense levels, and other key drivers. The outputs can show how revenue, EBITDA, net profit, cash flow, margins, and funding needs change across scenarios. This is valuable for business planning because it helps users understand the range of possible outcomes before committing capital. It is also useful for investor or lender conversations because stakeholders often want to know what happens if attendance is lower than expected or if the business benefits from stronger demand. Scenario analysis helps users prepare for downside risk, identify upside potential, and make better decisions about pricing, staffing, marketing, and financing strategy.
Professional Charts
The professional charts component translates the financial forecast into clear visual reports that are easier to understand and present. Movie theater financial planning can involve detailed calculations across revenue streams, operating expenses, cost of goods sold, capital expenditures, cash flow, and profitability, but stakeholders often need a concise visual summary. This section may include charts showing revenue growth, cost trends, profit progression, cash balance movement, EBITDA performance, revenue mix, or other key metrics over the forecast period. These visuals help users identify patterns that may not be immediately obvious in spreadsheet rows, such as margin improvement, seasonality, cost pressure, or cash flow gaps. They are especially useful for pitch decks, business plan attachments, lender reviews, board updates, and internal strategy sessions. By presenting financial information in a polished format, the charts make the model easier to communicate to investors, partners, advisors, and management teams. They also help users explain why certain decisions matter, such as increasing concession sales, reducing fixed costs, improving occupancy, or timing capital investments more carefully.
ROE Components and DuPont Analysis
The ROE components and DuPont analysis section helps users examine the drivers behind return on equity rather than looking only at surface-level profit. For a movie theater, investor return is influenced by profitability, asset utilization, capital structure, financing assumptions, and the size of the initial investment required to open or upgrade the venue. This component breaks return on equity into meaningful parts so users can see whether returns are being driven by strong margins, efficient use of assets, or leverage. Inputs may include net income, total equity, total assets, revenue, operating profit, debt assumptions, and other balance sheet or performance data. The outputs help users understand the quality of projected returns and whether the business is generating value in a sustainable way. This is particularly useful for investor-ready planning because potential funders often want to see more than a simple profit forecast. They want to understand how the theater converts capital into returns and whether the financial structure makes sense. DuPont-style analysis helps users identify which levers can improve performance, such as improving margins, increasing attendance, increasing ancillary revenue, or optimizing the amount of equity and debt used to fund the business.
Revenue Inputs
The revenue inputs section is where users define the commercial assumptions that drive the movie theater forecast. A cinema typically earns income from several sources, including film tickets, premium screenings, food and beverage sales, private events, venue rentals, merchandise, advertising, and other ancillary revenue. This component allows users to enter or adjust assumptions such as ticket price, visitor volume, attendance growth, concession purchase rates, average concession spend, event pricing, event attendance, and the number of bookings. These inputs feed into the financial model and determine projected sales across the forecast period. The section is useful because revenue planning for a theater is not only about total visitors. It also depends on the mix of ticket types, how many guests buy concessions, how much they spend, and whether the venue can generate additional income outside normal movie showtimes. By making these assumptions editable, the model allows users to test different pricing strategies, attendance expectations, programming plans, and revenue mix scenarios. This helps entrepreneurs and analysts understand what level of demand is required to support rent, payroll, film licensing fees, utilities, and capital investment.
Bank-Ready Reports
The bank-ready reports component organizes the financial results into lender-friendly outputs that support funding discussions and credit review. Movie theater projects often require significant upfront investment for venue renovation, projection systems, sound systems, seating, point-of-sale technology, leasehold improvements, deposits, permits, initial inventory, marketing, and working capital. Lenders need to understand how the business will use funds, how much revenue it expects to generate, whether it can cover operating expenses, and whether projected cash flow is sufficient to support repayment obligations. This section helps present that information in a structured way through financial statements, summaries, and key outputs that may include profit and loss projections, cash flow forecasts, balance sheet summaries, debt service visibility, and investment requirements. It is useful because a well-organized financial package can make the business case clearer and more credible. Users can use these reports when applying for business loans, discussing lease financing, approaching private lenders, or preparing documents for stakeholders. The bank-ready format helps communicate the theater’s financial position, repayment capacity, and funding needs without requiring the user to build separate reports manually.
Revenue Breakdown
The revenue breakdown section provides a detailed view of how total revenue is generated across the theater’s different income streams. This is important because two theaters with the same total sales can have very different business models depending on whether income comes mainly from ticket sales, concessions, private events, advertising, memberships, or premium experiences. This component helps users analyze the contribution of each revenue stream and understand which parts of the business are most important to profitability. Inputs may include ticket categories, attendance levels, concession spend, purchase rates, event bookings, rental fees, advertising packages, merchandise sales, or other ancillary income assumptions. Outputs may show revenue by category, revenue mix percentages, growth by stream, and the relationship between core admissions and higher-margin add-on sales. This is useful for planning because concessions and private events can materially improve margins, while ticket sales may be affected by film licensing costs and distributor terms. A detailed revenue breakdown helps users identify opportunities to improve performance, such as promoting food and beverage bundles, increasing premium screenings, building event packages, selling advertising placements, or launching memberships that encourage repeat visits.
KPI Dashboard
The KPI dashboard focuses on the performance metrics that help users monitor whether the movie theater is operating according to plan. While financial statements show the overall results, key performance indicators explain what is driving those results. This component may track metrics such as attendance, average ticket price, average revenue per visitor, concession conversion rate, average food and beverage spend, revenue per screen, gross margin, EBITDA margin, cash balance, payback period, return on equity, and other theater-specific measures. These KPIs help users connect operational activity with financial performance, making the model more useful for day-to-day management and strategic planning. For example, if total revenue is below target, the KPI dashboard can help identify whether the issue is lower attendance, weaker concession sales, lower event bookings, or pricing assumptions that are too aggressive. It is also helpful for benchmarking performance against industry expectations and communicating progress to investors, lenders, partners, or internal teams. By displaying key metrics in a concise format, the KPI dashboard supports faster reviews and more informed decisions about marketing campaigns, staffing levels, show scheduling, pricing changes, and expansion plans.
Startup Cost and Capital Investment Planning
The startup cost and capital investment planning section helps users estimate how much money is needed before the movie theater can open or complete an expansion. A cinema can require substantial upfront spending, including venue renovation, projection and sound systems, luxury seating, lighting, lobby improvements, concession equipment, signage, ticketing systems, security deposits, licenses, legal fees, pre-opening payroll, insurance, launch marketing, initial inventory, and working capital reserves. This component allows users to organize those costs in a structured format and separate one-time launch expenses from recurring operating expenses. The outputs help estimate total initial investment, funding needs, and how capital will be allocated across major categories. This is useful for entrepreneurs because underestimating startup costs can create cash shortages before the business reaches stable revenue. It is also useful for investor and lender presentations because funders want to see a clear use of funds and understand whether the requested capital is sufficient. By giving users a detailed capital plan, the model supports better budgeting, financing strategy, vendor negotiations, and launch readiness.
Cash Flow and Break-Even Forecasting
The cash flow and break-even forecasting section helps users understand when the movie theater may become self-sustaining and whether it has enough liquidity to operate during the ramp-up period. Profitability and cash flow are not always the same, especially in a business with large upfront capital expenditures, supplier payments, payroll obligations, rent, film licensing fees, inventory purchases, and potential debt service. This component uses revenue projections, operating expenses, startup costs, financing assumptions, and working capital timing to estimate monthly and annual cash movement. It can help identify periods when cash balances may be tight and show when revenue is expected to cover fixed and variable costs. The break-even analysis helps users estimate the level of attendance, revenue, or contribution margin needed to cover operating expenses and begin generating profit. This is useful for planning because it shows whether the business needs additional working capital, a line of credit, revised launch timing, stronger pre-opening sales, or cost adjustments. For decision-making, it helps users evaluate how pricing, concession margins, staffing, rent, and marketing spend affect the path to profitability and long-term financial stability.
File types:
Excel – Single-User: .xlsx
Excel – Multi-User: .xlsx
Similar ProductsOther customers were also interested in...






 Giorgos
Multiplex Cinema – 5 Year Financial Model
Financial Model providing highly sophisticated and user-friendly financial planning & analysis f... Read more
 HenrySheykin
Casino Hotel Financial Model Excel Template
The Casino Hotel Financial Model helps users build a structured five-year forecast for an integrated... Read more
Painting Contractor Financial Model Excel Template
The Painting Contractor Financial Model helps users turn a painting business plan into a structured ... Read more
Multi Sport Complex Business Plan Financial Model ...
The Multi-Sport Complex Financial Model helps entrepreneurs, founders, operators, consultants, and a... Read more
Multiplex Cinema Business Plan Financial Model Exc...
The Multiplex Cinema Financial Model helps entrepreneurs, cinema operators, consultants, analysts, a... Read more
Karaoke Bar Business Plan Financial Model Excel Te...
The Karaoke Bar Financial Model helps entrepreneurs, business owners, consultants, founders, and ana... Read more
Private Members Club – Dynamic 10-Year Finan...
User-friendly Financial Model providing an advanced dynamic 10-year financial plan for a startup Mem... Read more
Golf & Entertainment Center – 5 Year Financi...
Financial Model providing an advanced 5-year financial plan for a startup or operating Golf & En... Read more
Events & Weddings Venue – 5 Year Financial M...
Financial Model providing an advanced 5-year financial plan for a startup Events & Weddings Venu... Read more
Dance Studio Financial Model – 5 Year Financial ...
Provides an advanced 5-year financial plan for a startup or operating Dance Studio and is a flexible... Read more
Reviews
 Movie theater budget model
This helped me a lot with my school work on how to do a spreadsheet.
705 of 1444 people found this review helpful.
Help other customers find the most helpful reviews
Did you find this review helpful?
You must log in to submit a review.