Loan Tape Analysis / KPI Dashboard
A framework that makes it easy to drop in your loan data and automatically generate analytical insights such as loans settled by risk rating and weighted average interest rate.

Video Overview:
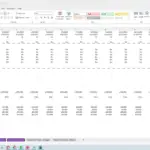
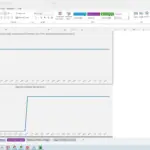
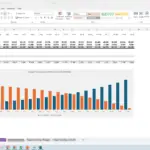
Here I’ve provided a database structure that any loan portfolio can be dropped into. The output reports are displayed in two views. One is a monthly look at the loan portfolio performance over 5 years (if you want to show more months, simply drag the last column over as far as you want). The other view is a current dashboard snapshot.
The input columns are simple and include things like:
- LoanID
- Risk Rating
- Loan Type
- Interest Rate
- Loan Amount
- Term (in months)
- Remaining Term (in months)
- Remaining Balance
- Paid Off Date
- Default Date
The monthly view and visualization output metrics include:
- Total Loans Originated per Month (and by risk rating)
- Total Amount of Loans Originated per Month (and by risk rating)
- Count of Defaults per Month (and by risk rating)
- Weighted Average Interest Rate of Loans Settled per Month
- Weighted Average Interest Rate of Ongoing Portfolio (and by risk rating)
- Default Rate by Risk Rating
- Amount of Principal Defaulted per Month (and by risk rating)
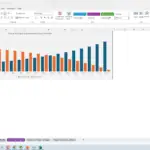
- Ongoing Comparison of Total Originated vs Total Defaulted and the Percentage
- Cumulative Amount Originated (and by risk rating)
The above metrics are also shown as a ‘total per date’ view on a dashboard and that is also broken down by risk rating. By using this loan portfolio analysis tool, it gives internal and external stakeholders a good idea of what a given lending business has done over time based on their actual settled loans. It shows what kind of risks were taken and the level of originations that had been completed at a given risk rating. This is also helpful in order to see the average interest rate of the entire portfolio over time.
Expected Future Principal and Interest Collected
An additional feature I built out was the automated future principal and interest that is expected to be collected of all existing loans. This is driven off the remaining term (in months), interest rate, original loan amount, and initial loan term. The output report shows a monthly and annual total of both principal and interest the loans will be expected to produce. Defaulted loans and paid off loans are not counted as this is supposed to be an analysis of the future performance as of all current statuses. This also has a discounted cash flow analysis attached to it so the user can figure out the present value of all future payments expected.
I think one of the most useful metrics is the ongoing total of originations vs defaults. This gives the user a true idea of the average expected chance that a given amount of principal will be repaid or not when looking at all historical loan data.
Over the years, I’ve built 100s of financial models, tools, and trackers. You can access all of them in one large bundle here: https://www.efinancialmodels.com/downloads/all-my-financial-models-spreadsheets-templates-and-tools-120-421052/
Similar Products
Other customers were also interested in...
Debt Fund Excel Model
Explore the Debt Fund Excel Model, a comprehensive tool for evaluating new credit fund opportunities... Read more
Fintech Financial Models Bundle
Financial technology (better known as fintech) is used to describe new technology that seeks to impr... Read more
Crowdlending (P2P) Platform – 5 Year Financi...
Financial Model providing an advanced 5-year financial plan for a startup Crowdlending (Peer-to-Peer... Read more
Buy Now Pay Later DCF Model & Valuation (10 Ye...
The Buy Now Pay Later (BNPL) Company financial model is a comprehensive tool designed to analyze the... Read more
Microfinance Platform – 5 Year Financial Model
Financial Model presenting an advanced 5-year financial plan for a Microfinance Lending Platform pro... Read more
Lending Company Financial Model – 5 Year Forecas...
This Financial model template presents a business scenario of a corporation engaged in granting loan... Read more
Lending Business Financial Projection 3 Statement ...
3 Statement 5 year rolling financial projection Excel model for existing/startup business borrowing ... Read more
Buy Now Pay Later (BNPL) Platform – 5 Year F...
Financial Model presenting an advanced 5-year financial plan for a startup BNPL Platform which provi... Read more
Lending Platform Financial Model (LaaS)
Includes all the assumptions you need to project the gross revenues and profits of a LaaS platform (... Read more
Lending Model Startup Forecast: 10-Year Scaling &#...
This is a full 10-year startup lending business financial model, including a 3-statement model. Accu... Read more
You must log in to submit a review.


