
0 ITEMS

Litigation Finance Portfolio Model | Case Underwriting, Monte Carlo, MOIC, IRR, VaR, Waterfall & Risk Dashboards
⚖️ Litigation Finance Portfolio Model Build a portfolio-level underwriting and risk view for litigation finance in one integrated Excel workbook. This model is designed for teams that need to connect individual case economics with fund-level capital deployment, contractual recovery mechanics, concentration risk, correlation, downside simulation and investment-committee reporting.

⚖️ Litigation Finance Portfolio Model
Build a portfolio-level underwriting and risk view for litigation finance in one integrated Excel workbook. This model is designed for teams that need to connect individual case economics with fund-level capital deployment, contractual recovery mechanics, concentration risk, correlation, downside simulation and investment-committee reporting.
Litigation-finance decisions are difficult because returns do not follow a simple linear forecast. A matter can settle early, win or lose at trial, move through appeal, be dismissed, consume capital in stages, resolve later than expected, or deliver a recovery constrained by fee multiples, award sharing and contractual caps. At portfolio level, shared case categories, law firms, jurisdictions and broader legal-market conditions can make outcomes partially correlated. This workbook brings those moving parts into a structured underwriting framework rather than treating each case as an isolated spreadsheet.
Seller-supplied and already tested; no Studio workbook audit was performed.
🎯 What decisions the model supports
Use the workbook to assess how case selection, commitment sizing, expected deployment, duration, recovery terms and portfolio construction affect expected MOIC, risk-adjusted MOIC, implied IRR, NPV, loss probability and downside-tail outcomes. You can also evaluate how fund terms and LP/GP economics interact with gross case recoveries.
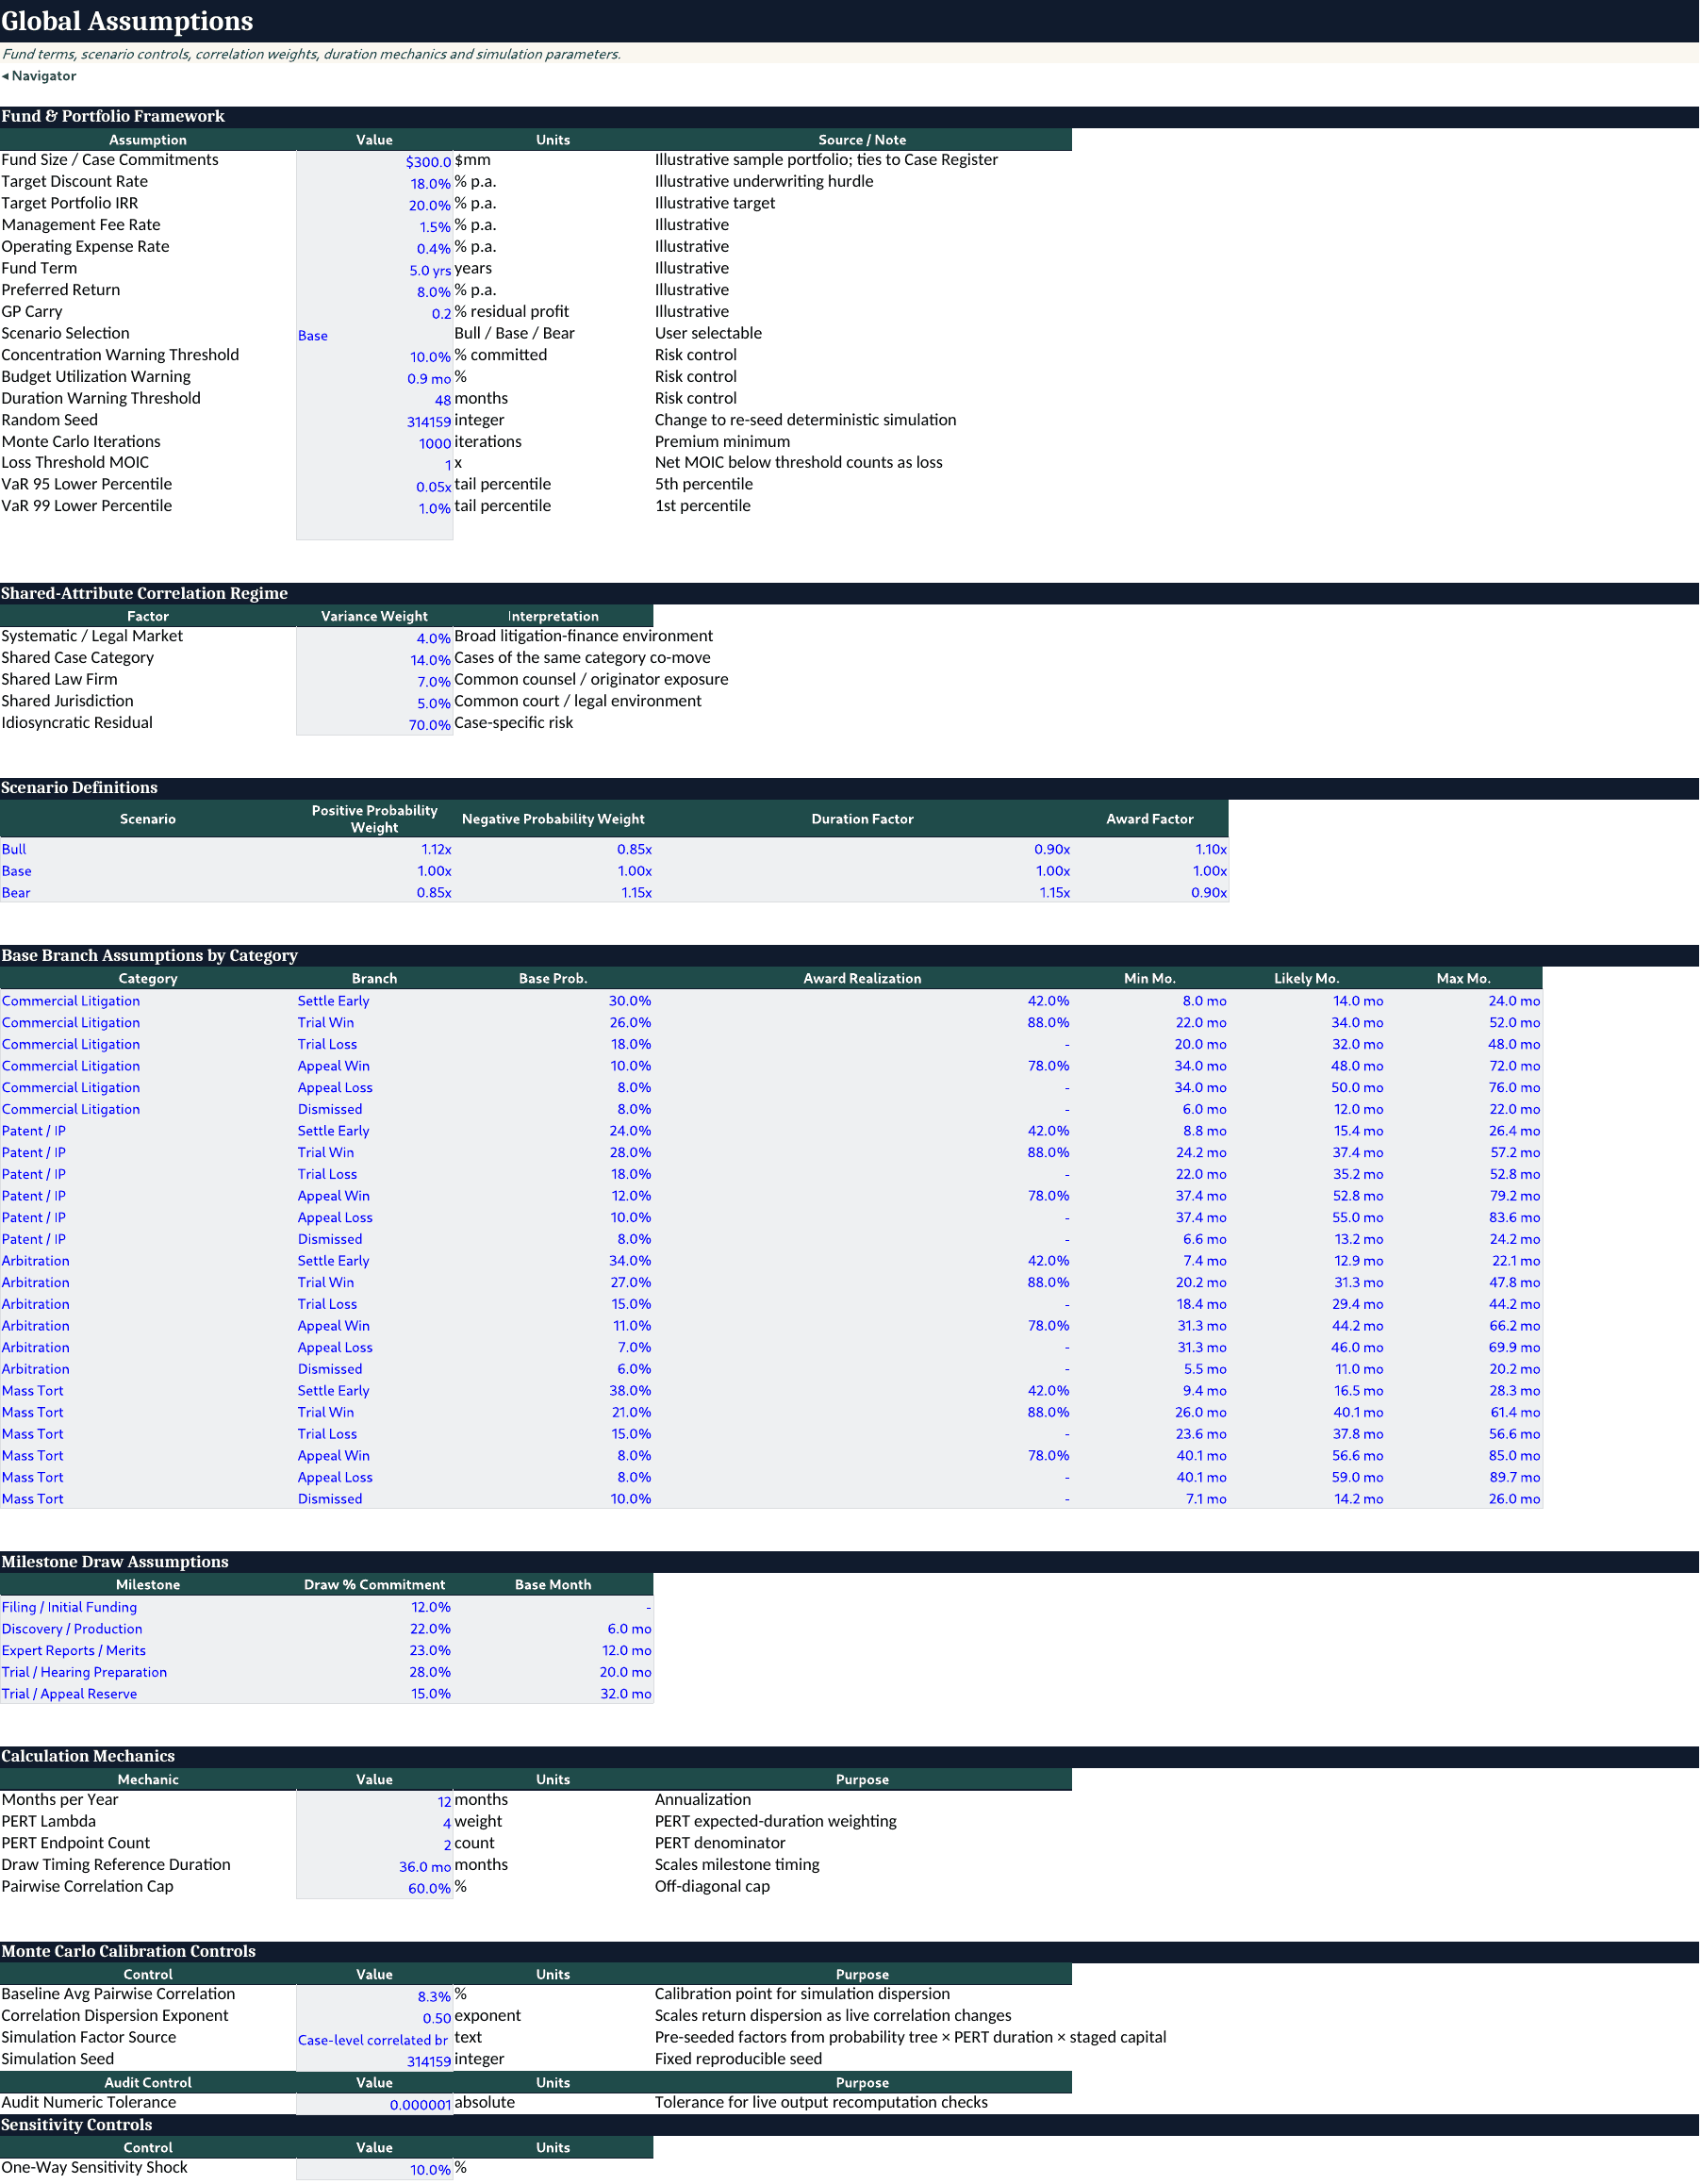
Editable assumptions include fund size and case commitments, target discount rate, target portfolio IRR, management fee, operating expense rate, fund term, preferred return, GP carry, Bull/Base/Bear scenario selection, risk-warning thresholds, Monte Carlo seed and iteration count, loss-threshold MOIC, VaR percentiles, shared-attribute correlation weights, branch probabilities, award-realization assumptions, PERT duration parameters and milestone draw percentages.
🧭 Model workflow
1. Set fund, portfolio, scenario, correlation, duration and simulation assumptions.
2. Review or replace the illustrative 30-case register with your own underwriting inputs.
3. Review case-level resolution branches, adjusted probabilities, award realization and contractual recovery logic.
4. Assess PERT-based time-to-resolution and milestone-driven capital deployment.
5. Review case MOIC, risk-adjusted returns, implied IRR, NPV, budget utilization and concentration.
6. Assess shared-attribute correlation and portfolio-level recovery waterfall economics.
7. Review the 1,000-iteration deterministic simulation outputs, VaR/CVaR and loss probability.
8. Use the dashboards, matter drilldown and sensitivity tools for investment-committee discussion.
🧩 Workbook structure
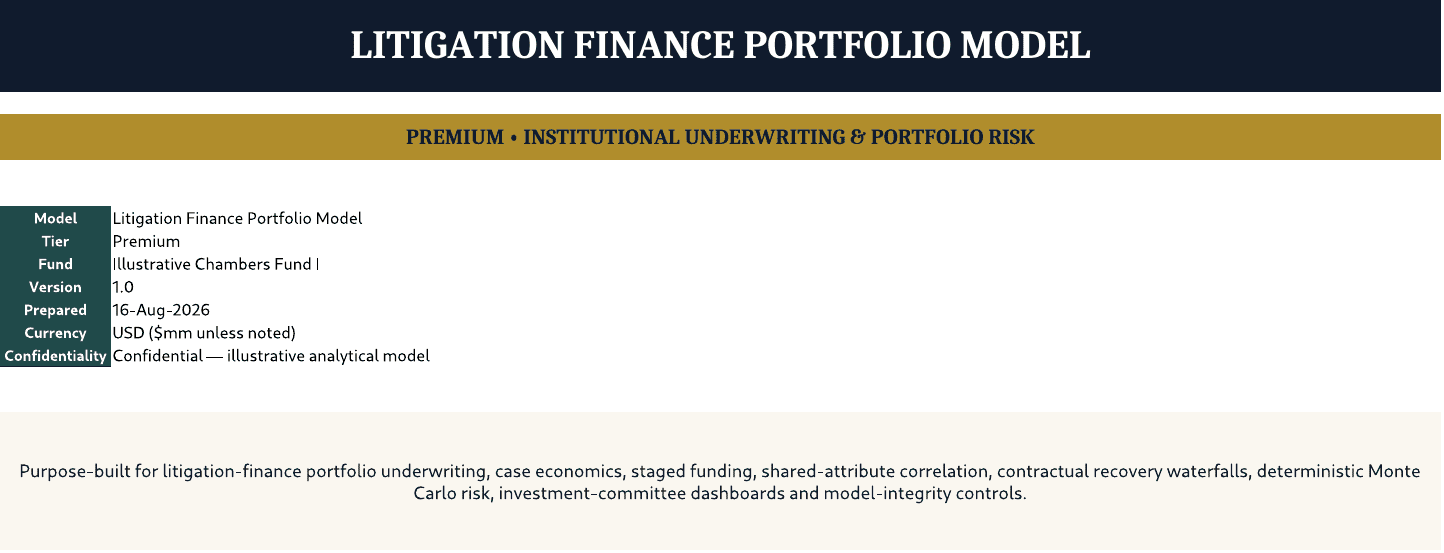
- Cover – identifies the workbook, currency convention and overall purpose.
- Navigator – model map covering all analytical modules.
- How to Use – operating sequence, editable-cell conventions, control discipline and Monte Carlo operating note.
- Disclaimers & Disclosures – workbook-authored notices already included in the source model.
- Global Assumptions – fund terms, scenario controls, correlation regime, branch assumptions, milestone draws, PERT mechanics, simulation calibration and sensitivity shock.
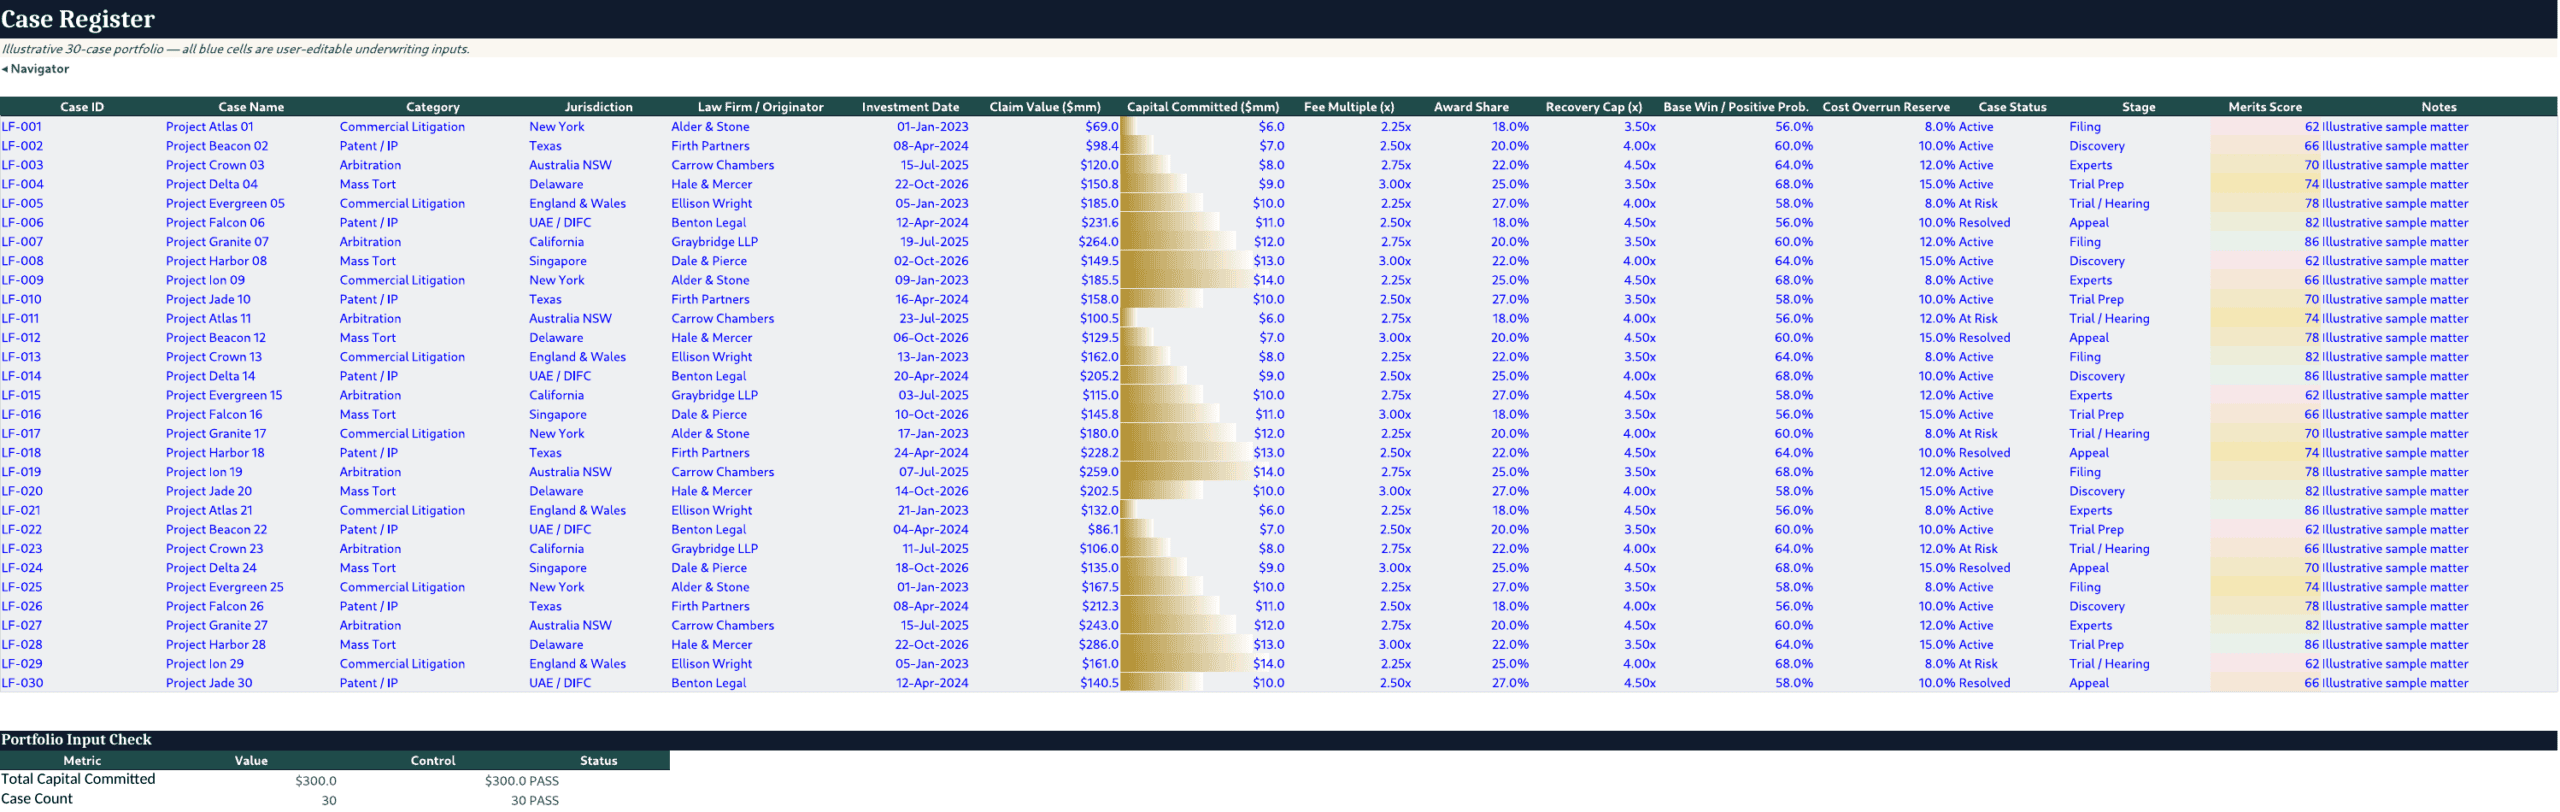
- Case Register – 30 illustrative matters with category, jurisdiction, law firm/originator, investment date, claim value, capital committed, fee multiple, award share, recovery cap, base positive-outcome probability, overrun reserve, case status, stage, merits score and notes.
- Probability Tree Engine – mutually exclusive resolution branches such as early settlement, trial outcomes, appeal outcomes and dismissal; calculates scenario-adjusted probabilities, capital at resolution, realized award, contractual funder recovery, branch MOIC and discounted recovery.
- Duration Distribution Engine – minimum, most-likely and maximum timing inputs with PERT expected duration, scenario duration factors and duration-risk flags.
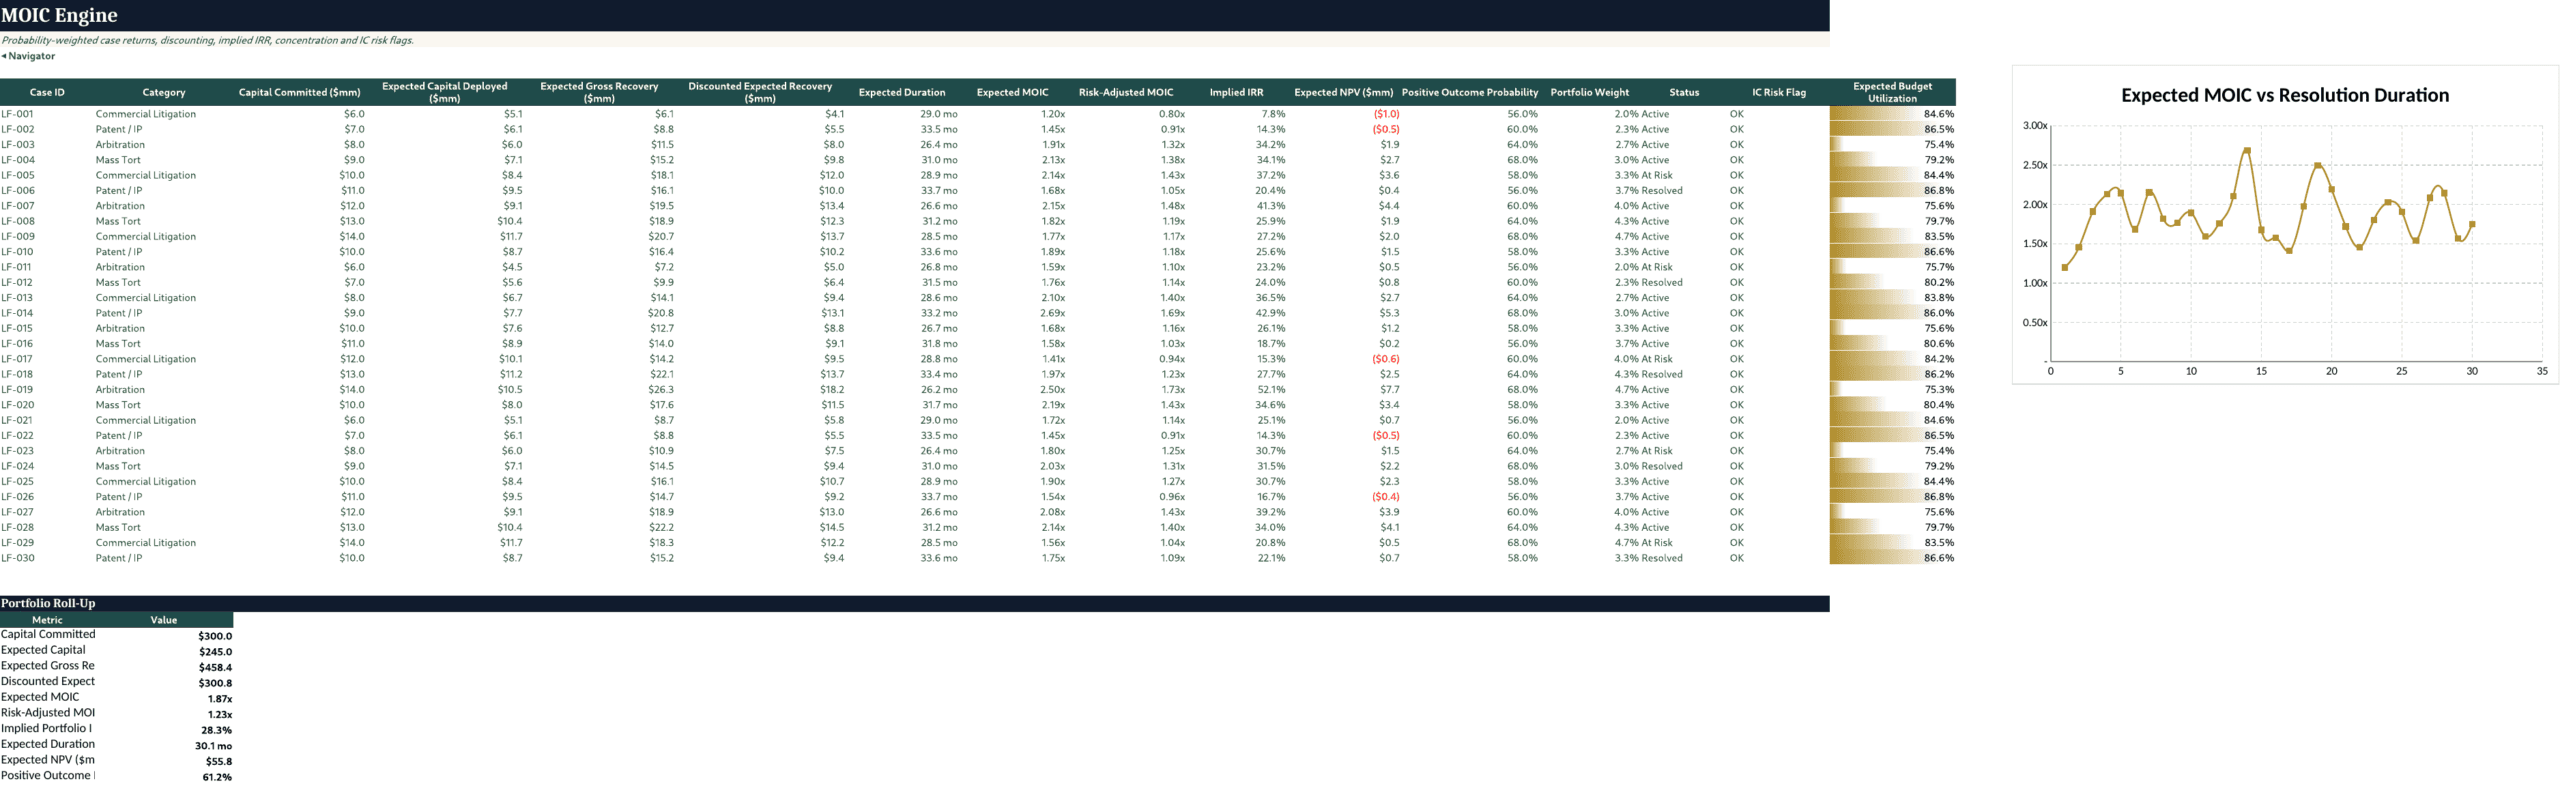
- MOIC Engine – case-level expected capital deployed, expected gross and discounted recovery, expected MOIC, risk-adjusted MOIC, implied IRR, expected NPV, positive-outcome probability, portfolio weight and budget utilization.
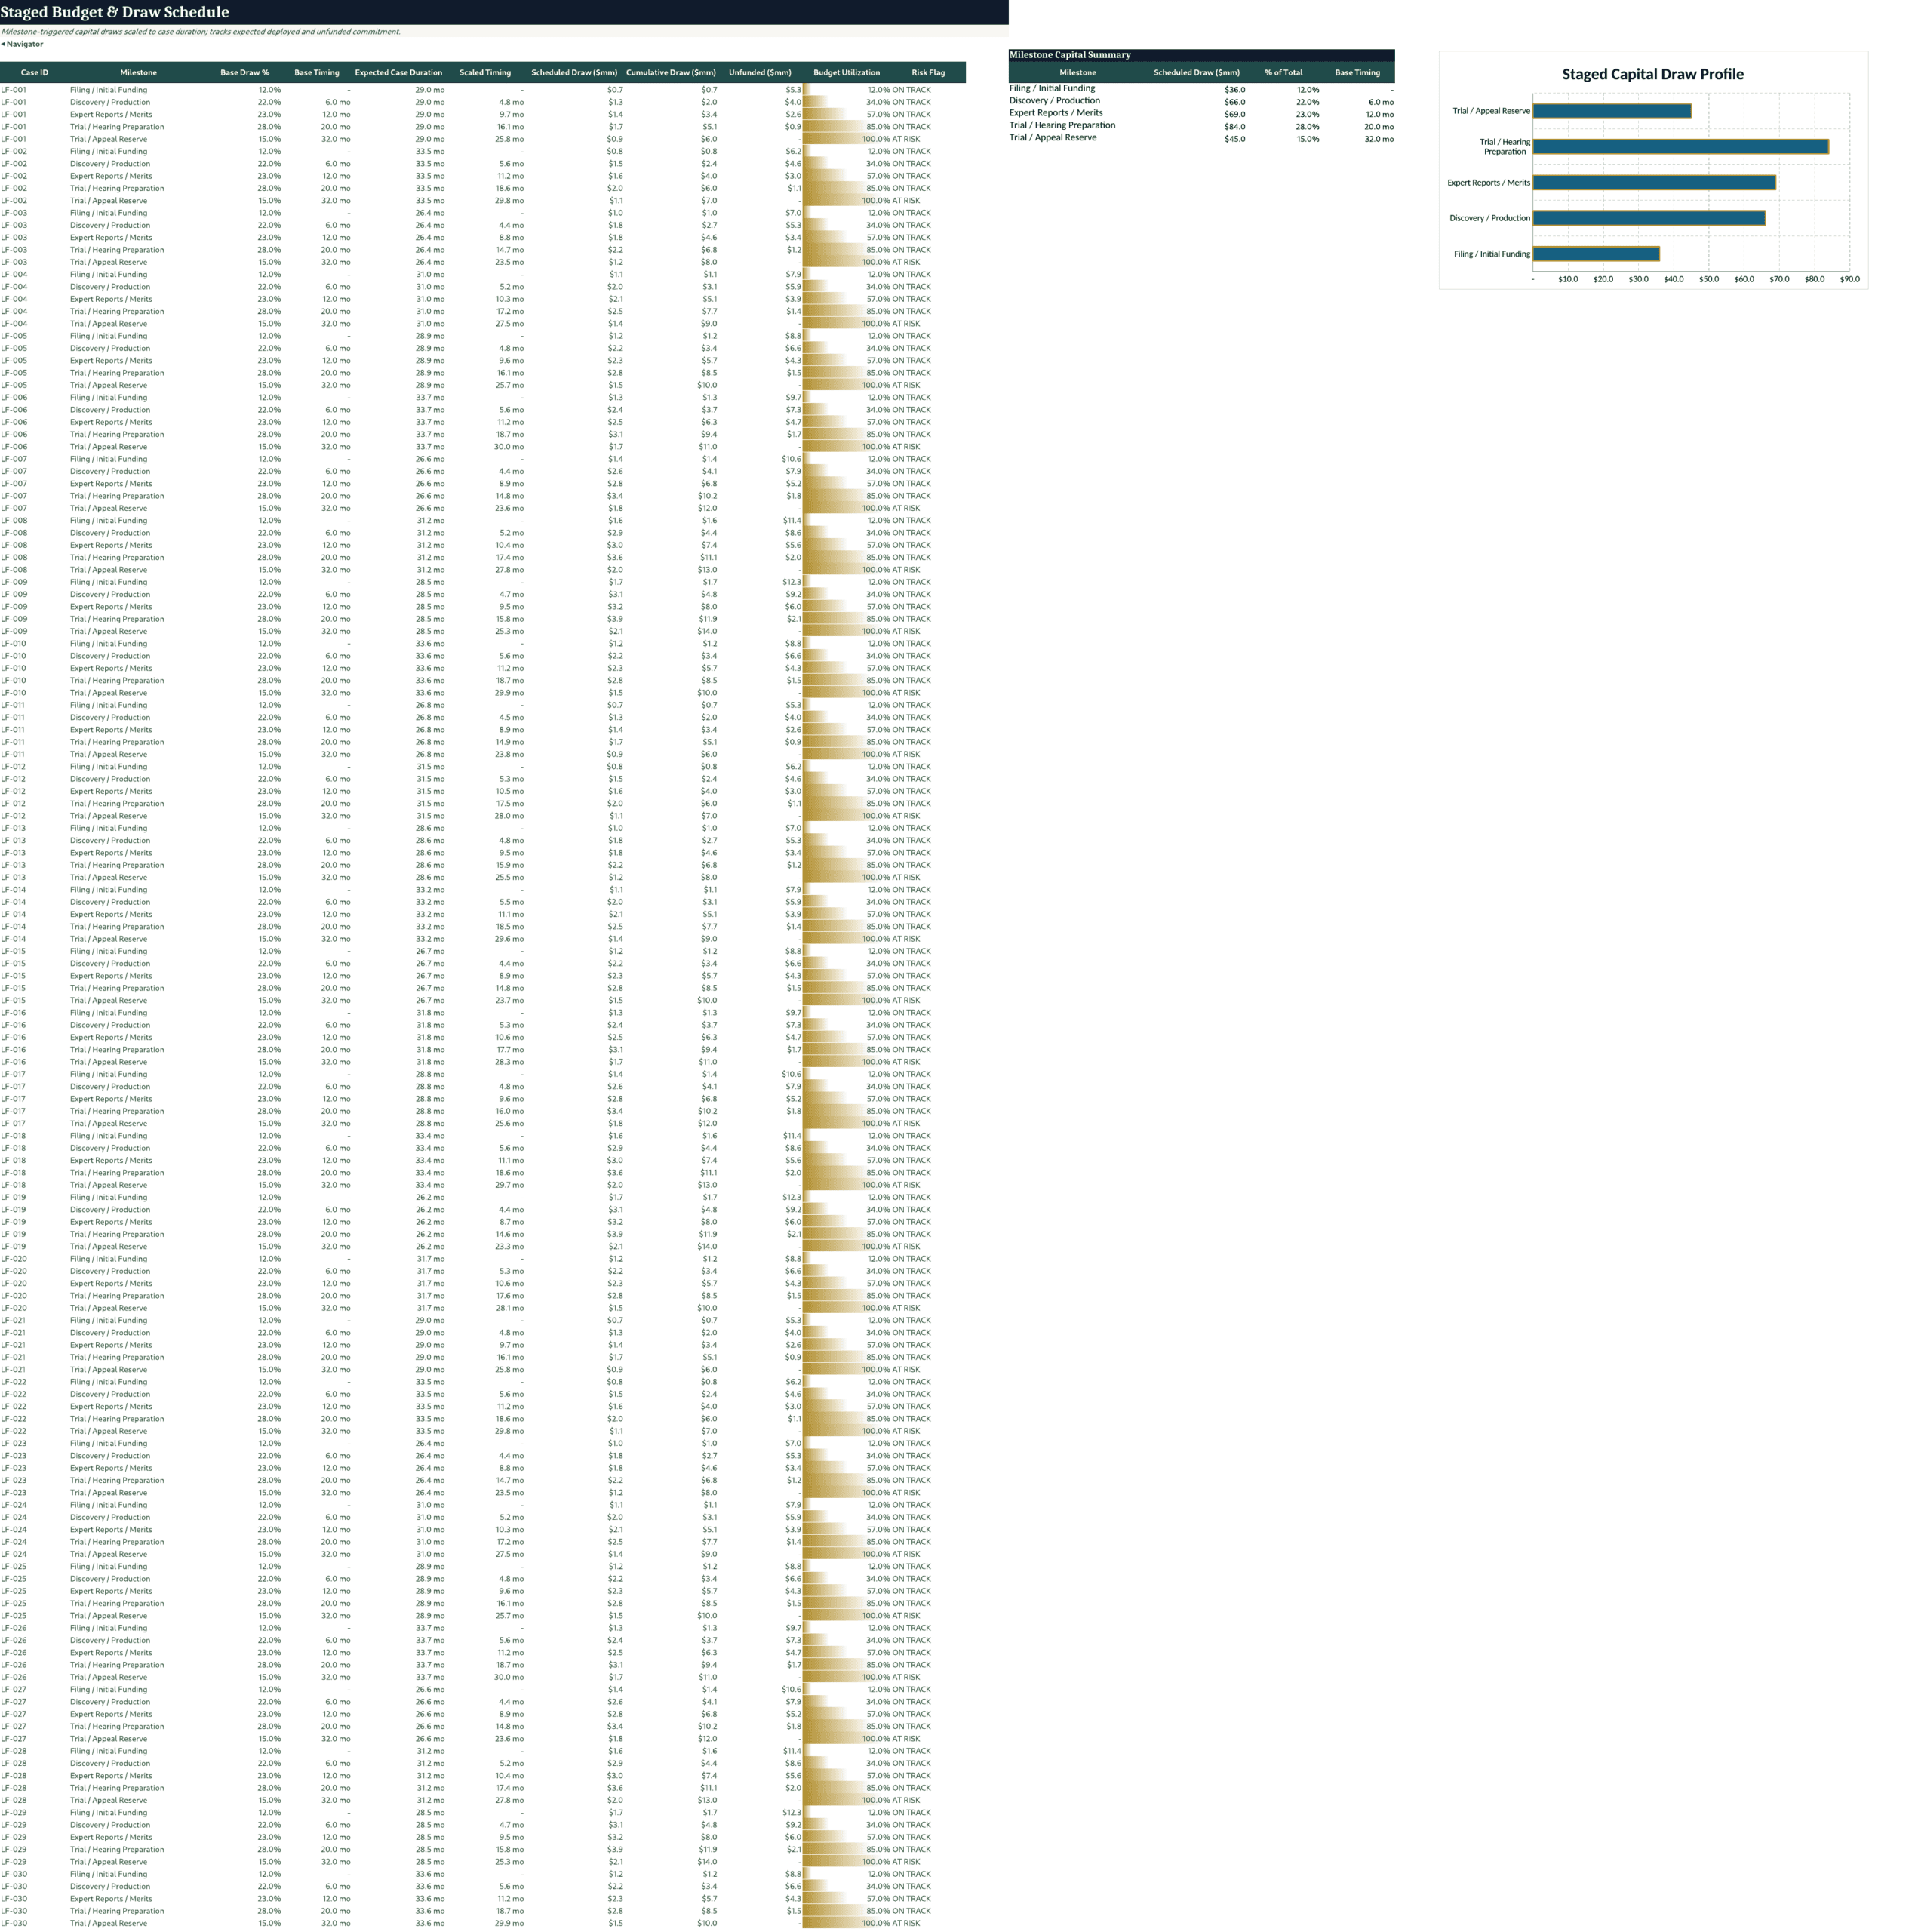
- Staged Budget & Draw Schedule – milestone-based funding across filing, discovery, experts/merits, trial preparation and trial/appeal reserve, with scaled timing, cumulative draws and unfunded commitments.
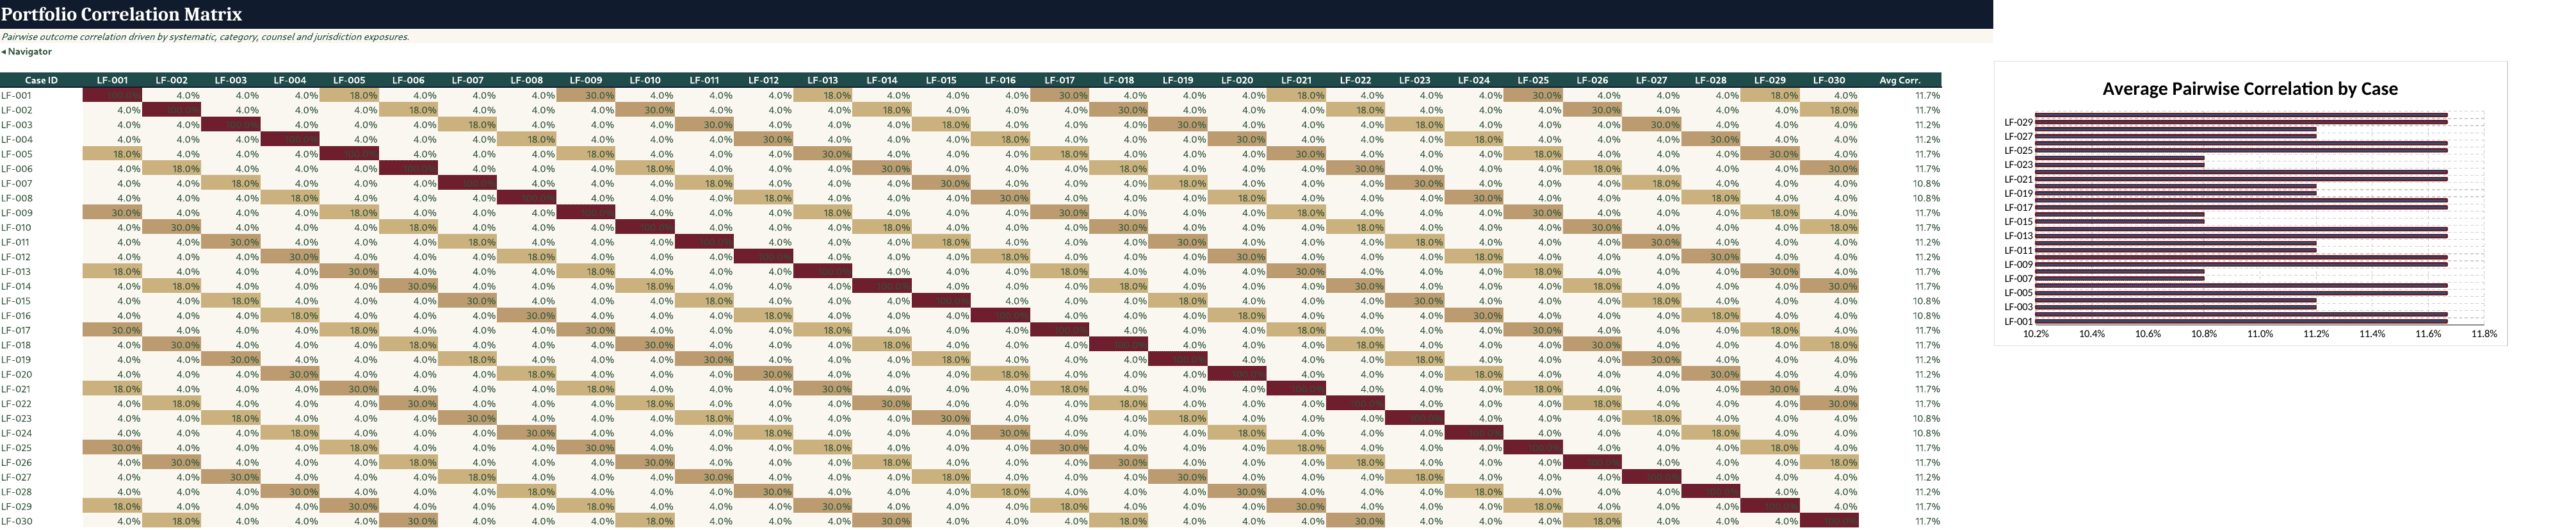
- Portfolio Correlation Matrix – pairwise case correlation driven by systematic, shared-category, shared-law-firm and shared-jurisdiction exposure, plus average correlation by case.
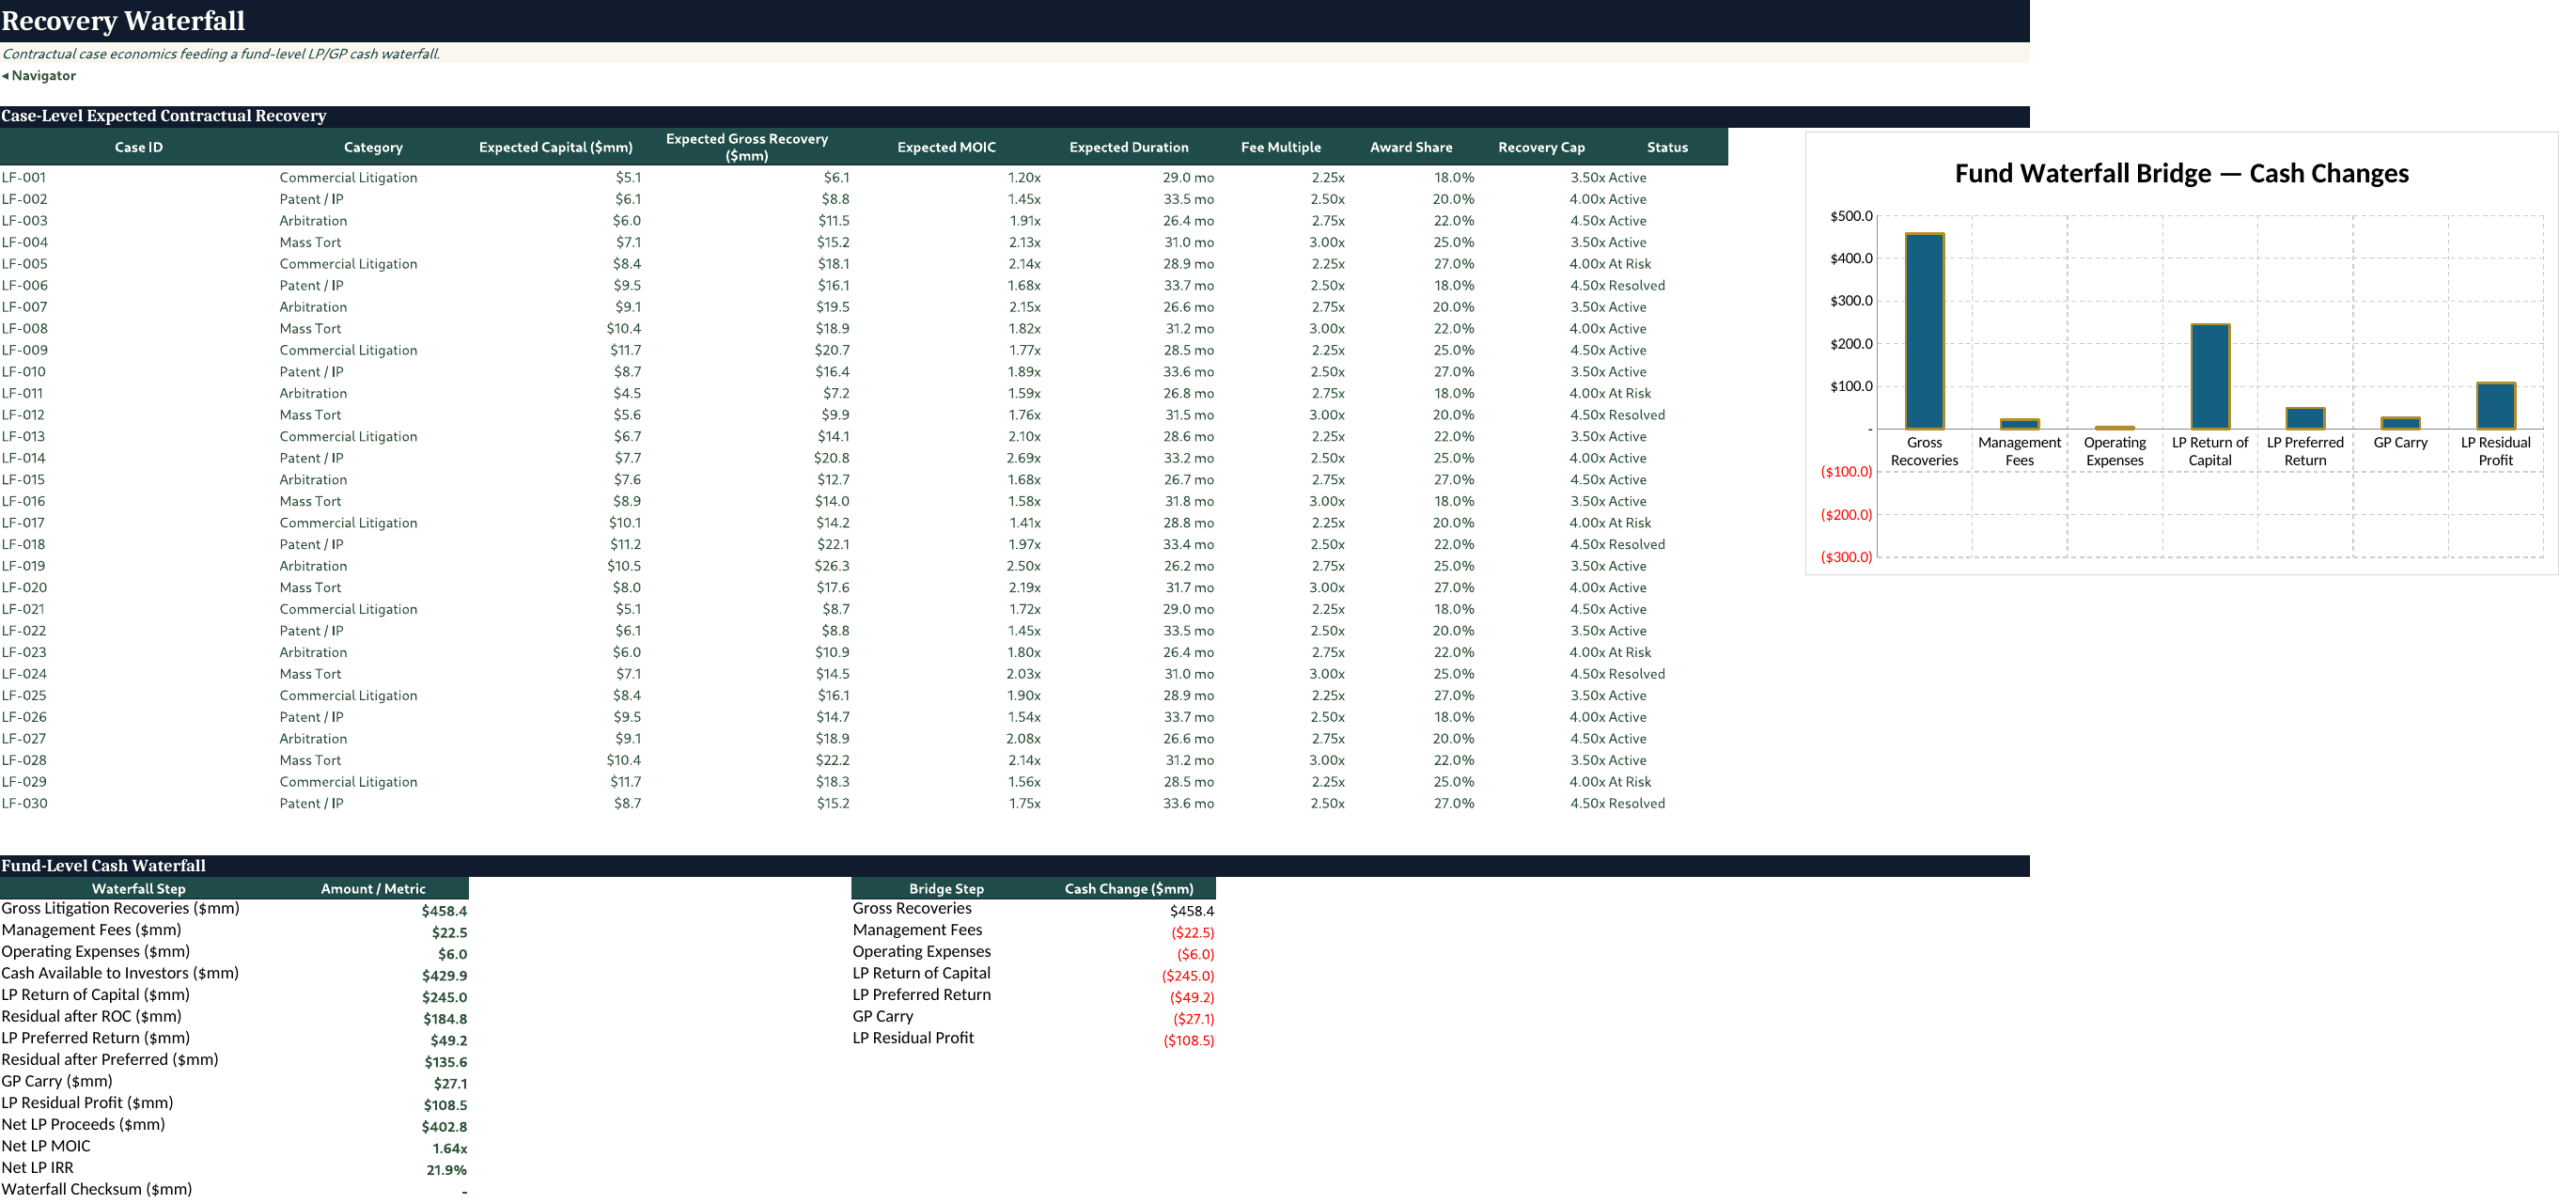
- Recovery Waterfall – links case economics to fund-level cash allocation through management costs, operating expenses, LP capital, preferred return and GP carry.
- Monte Carlo Engine – 1,000 pre-seeded correlated simulation factors with live recalibration of gross recovery, deployed capital, duration, LP proceeds, net MOIC, net IRR and loss flags.
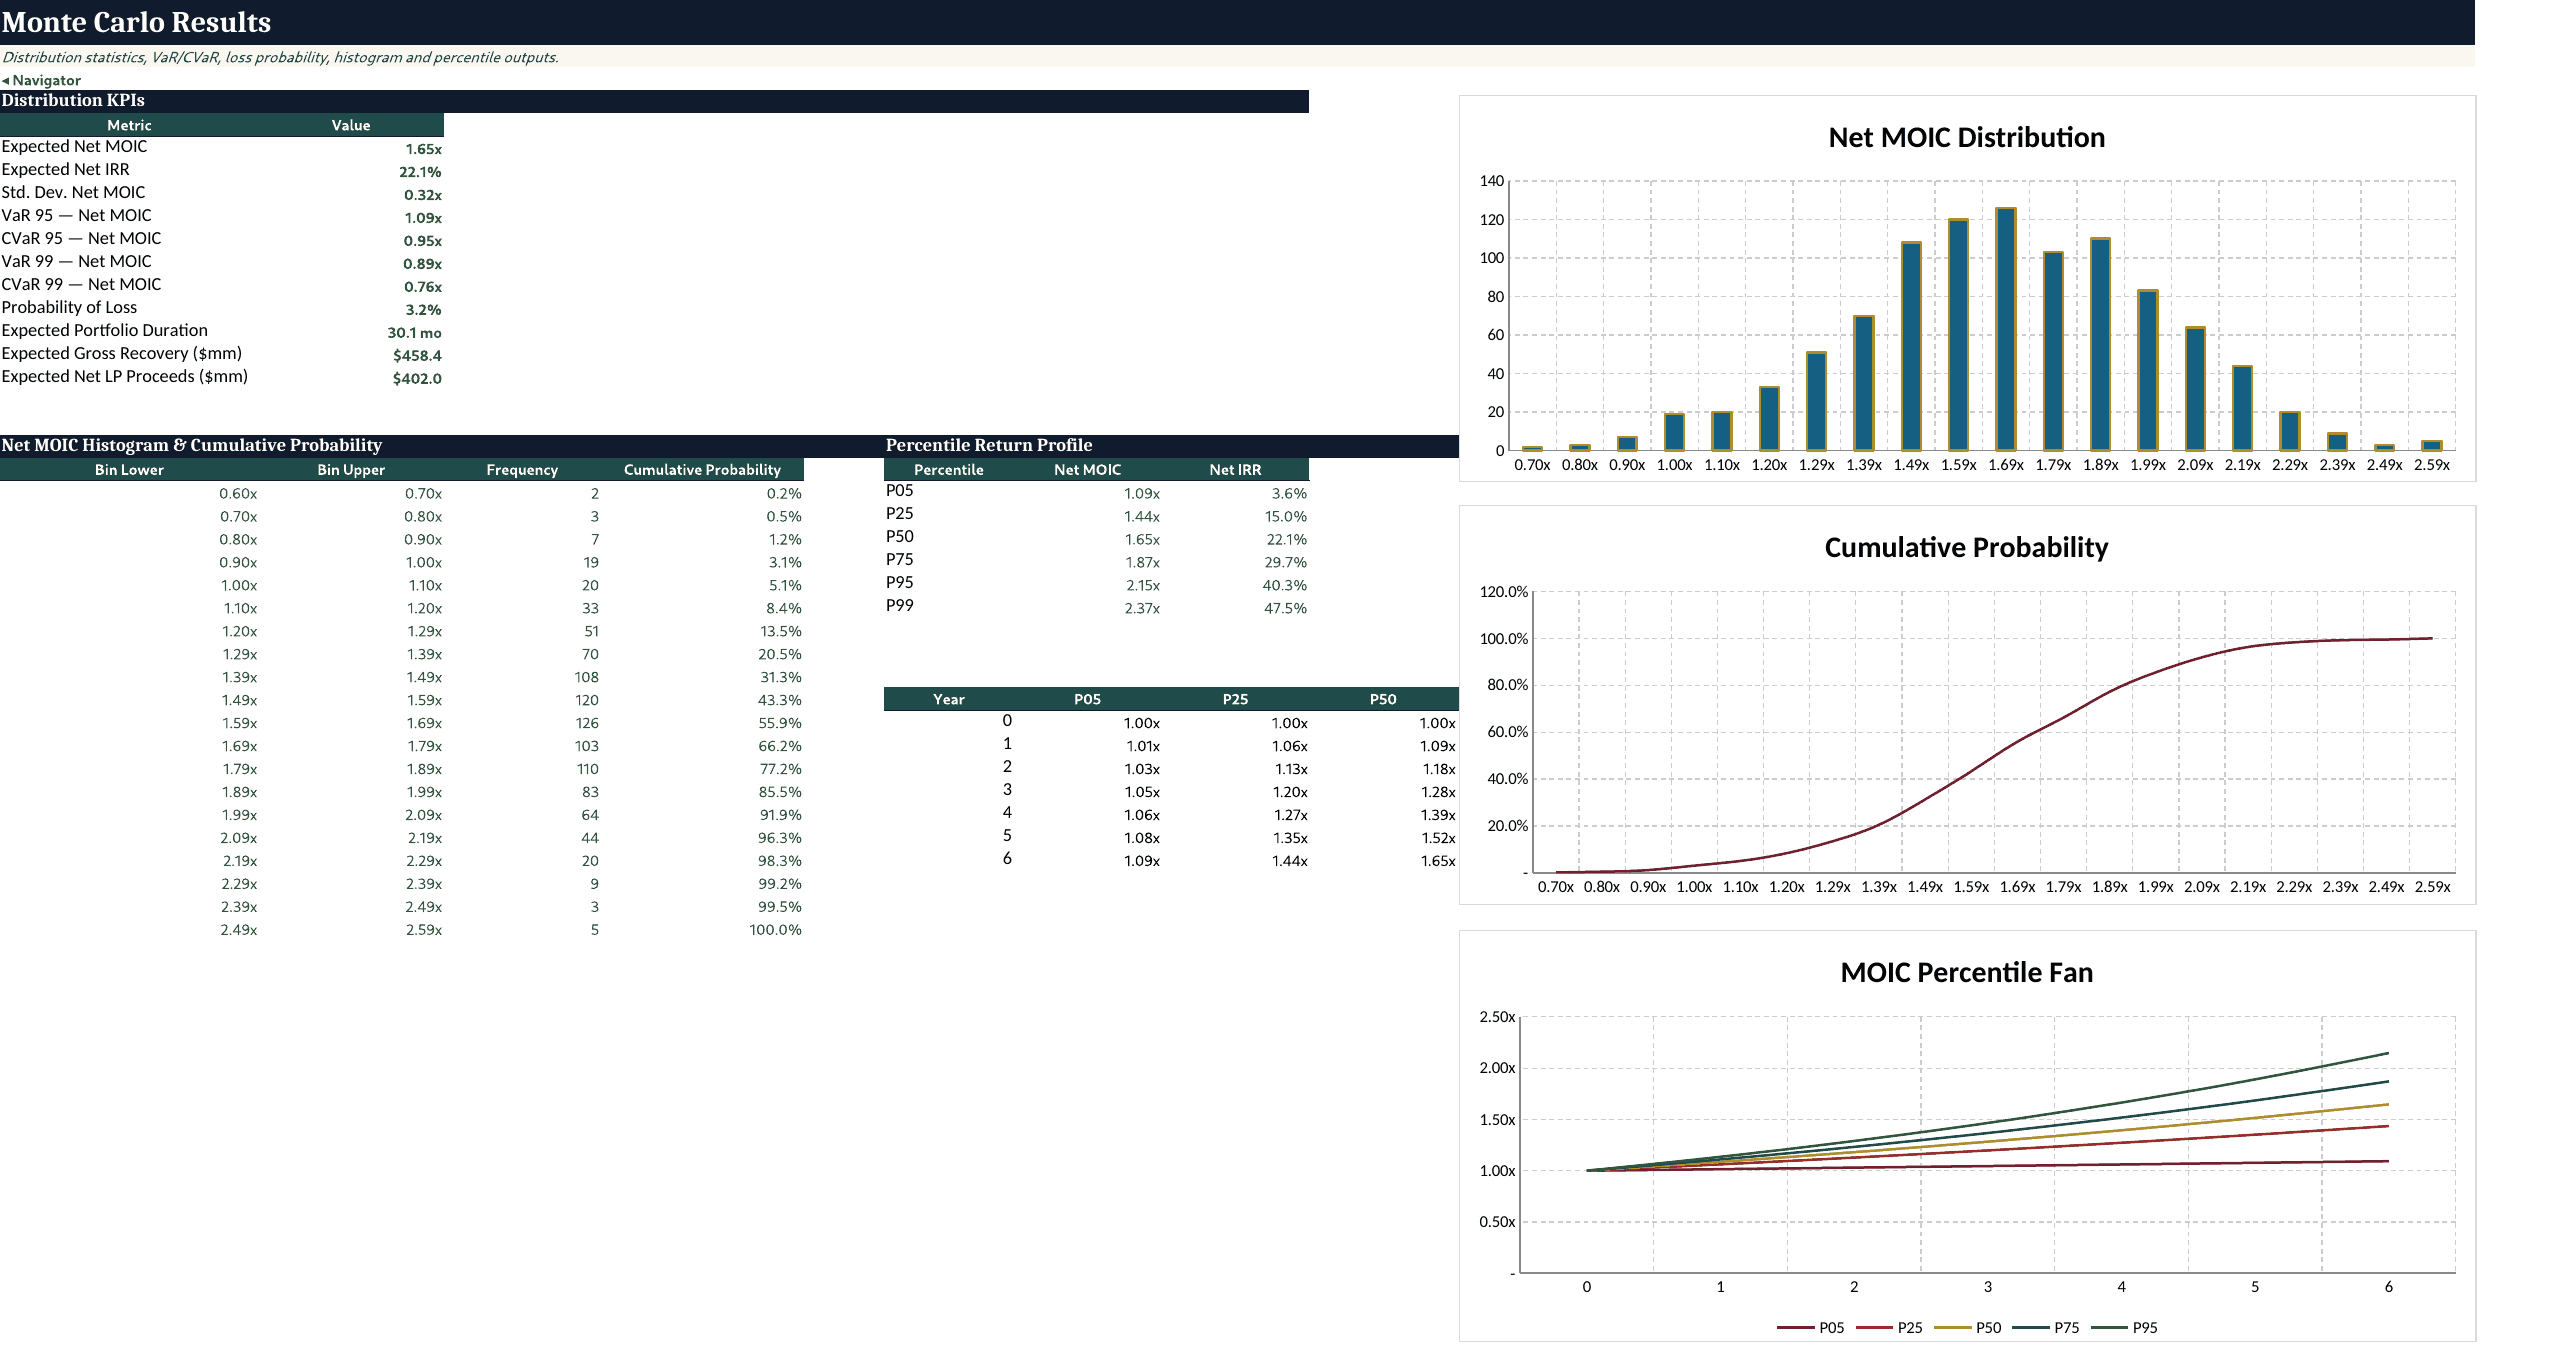
- Monte Carlo Results – expected return statistics, standard deviation, 95% and 99% VaR/CVaR, probability of loss, expected portfolio duration, expected gross recovery, expected net LP proceeds, MOIC histogram, cumulative probability and percentile profile.
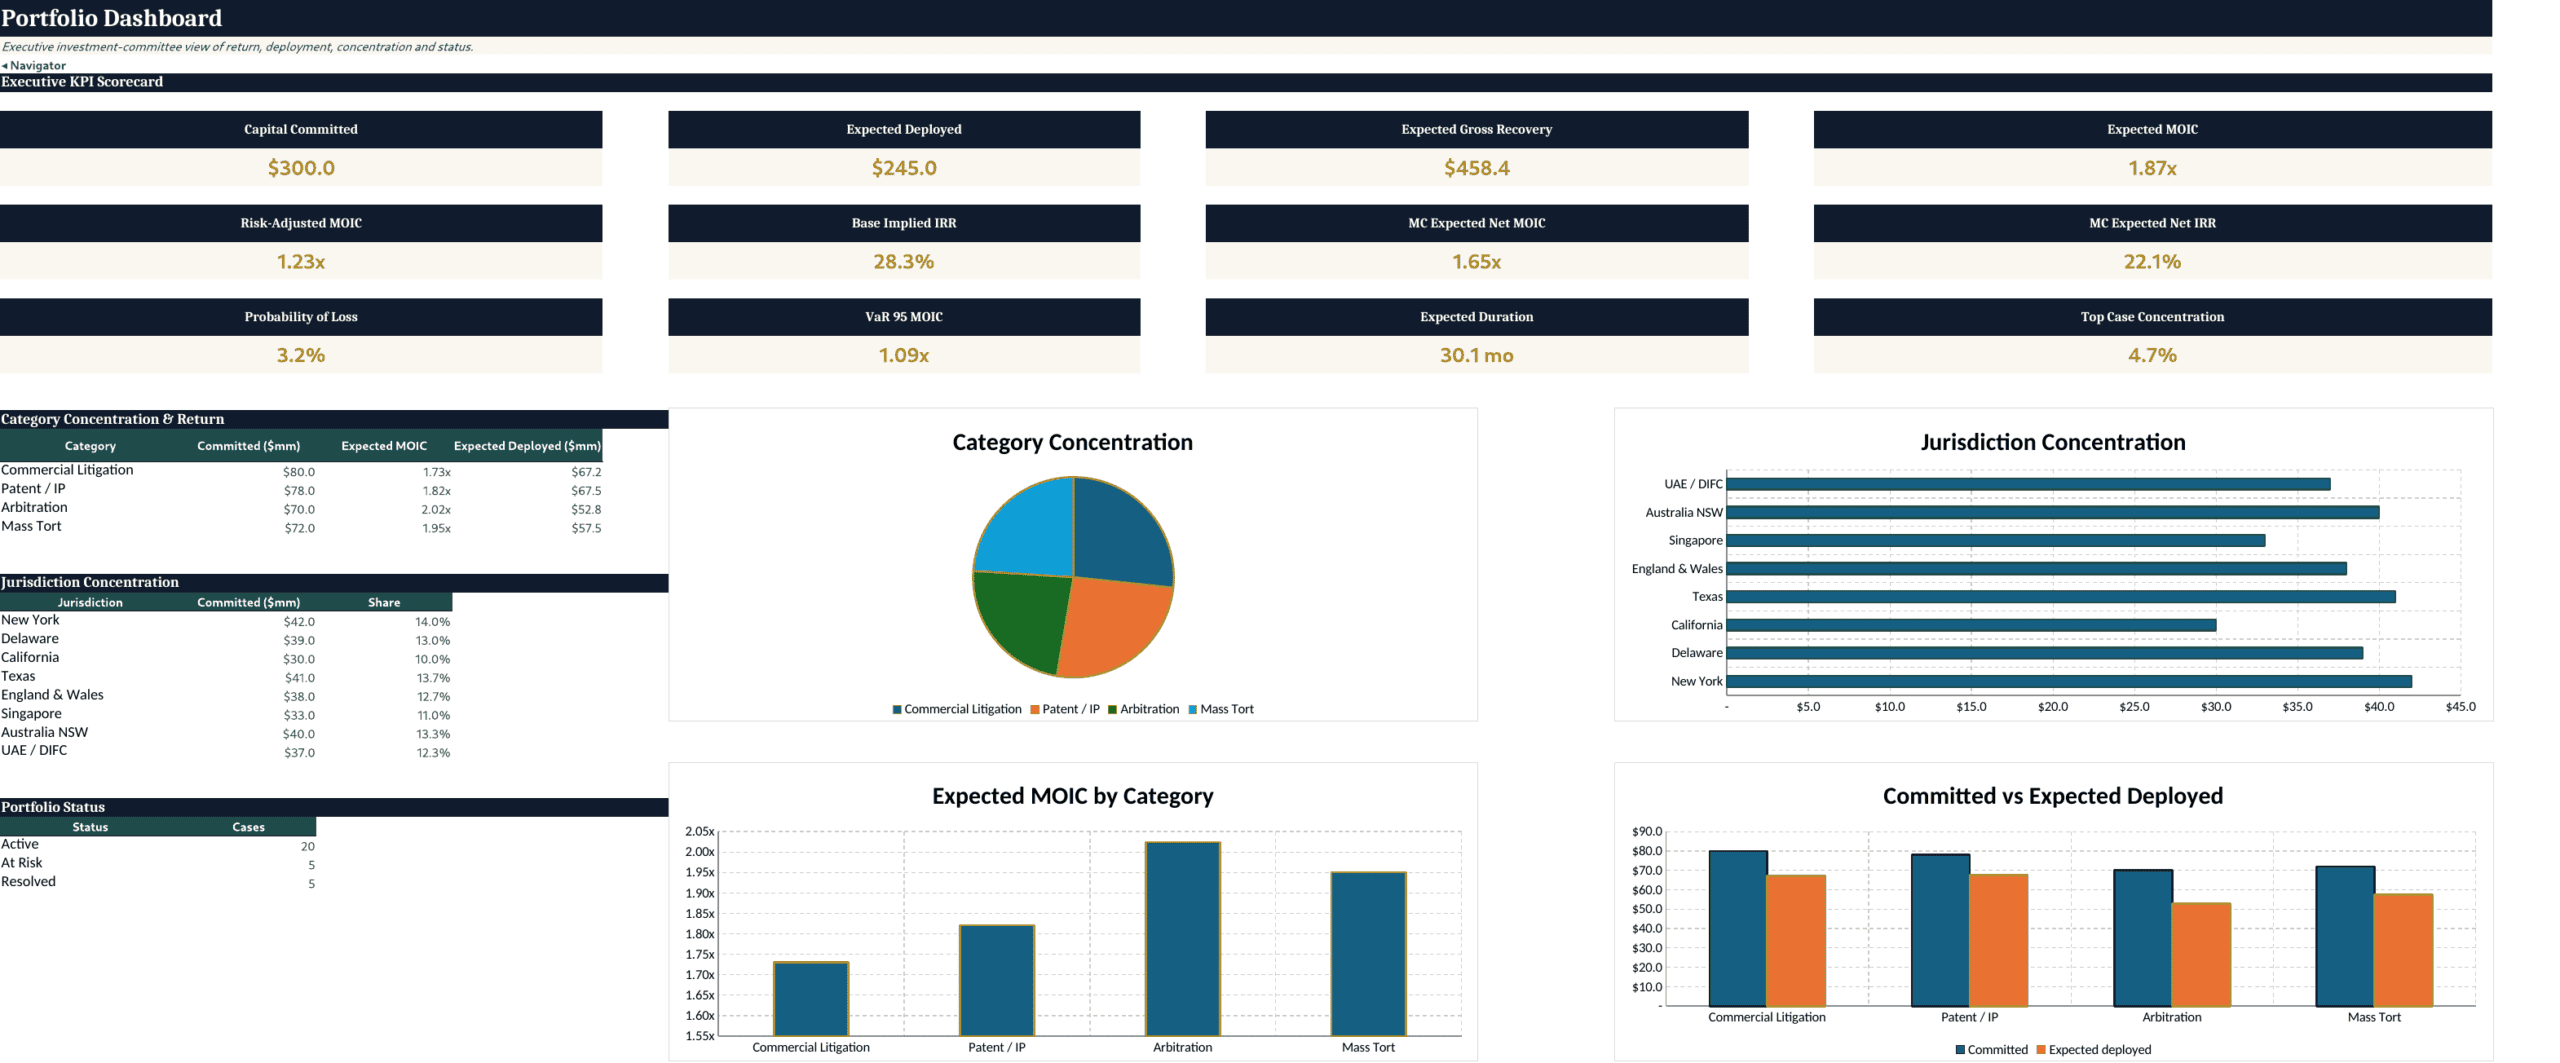
- Portfolio Dashboard – executive KPI scorecard for committed capital, expected deployment, expected recovery, expected MOIC, risk-adjusted MOIC, implied IRR, simulated net MOIC/IRR, probability of loss, VaR, duration and top-case concentration, with category and jurisdiction charts.
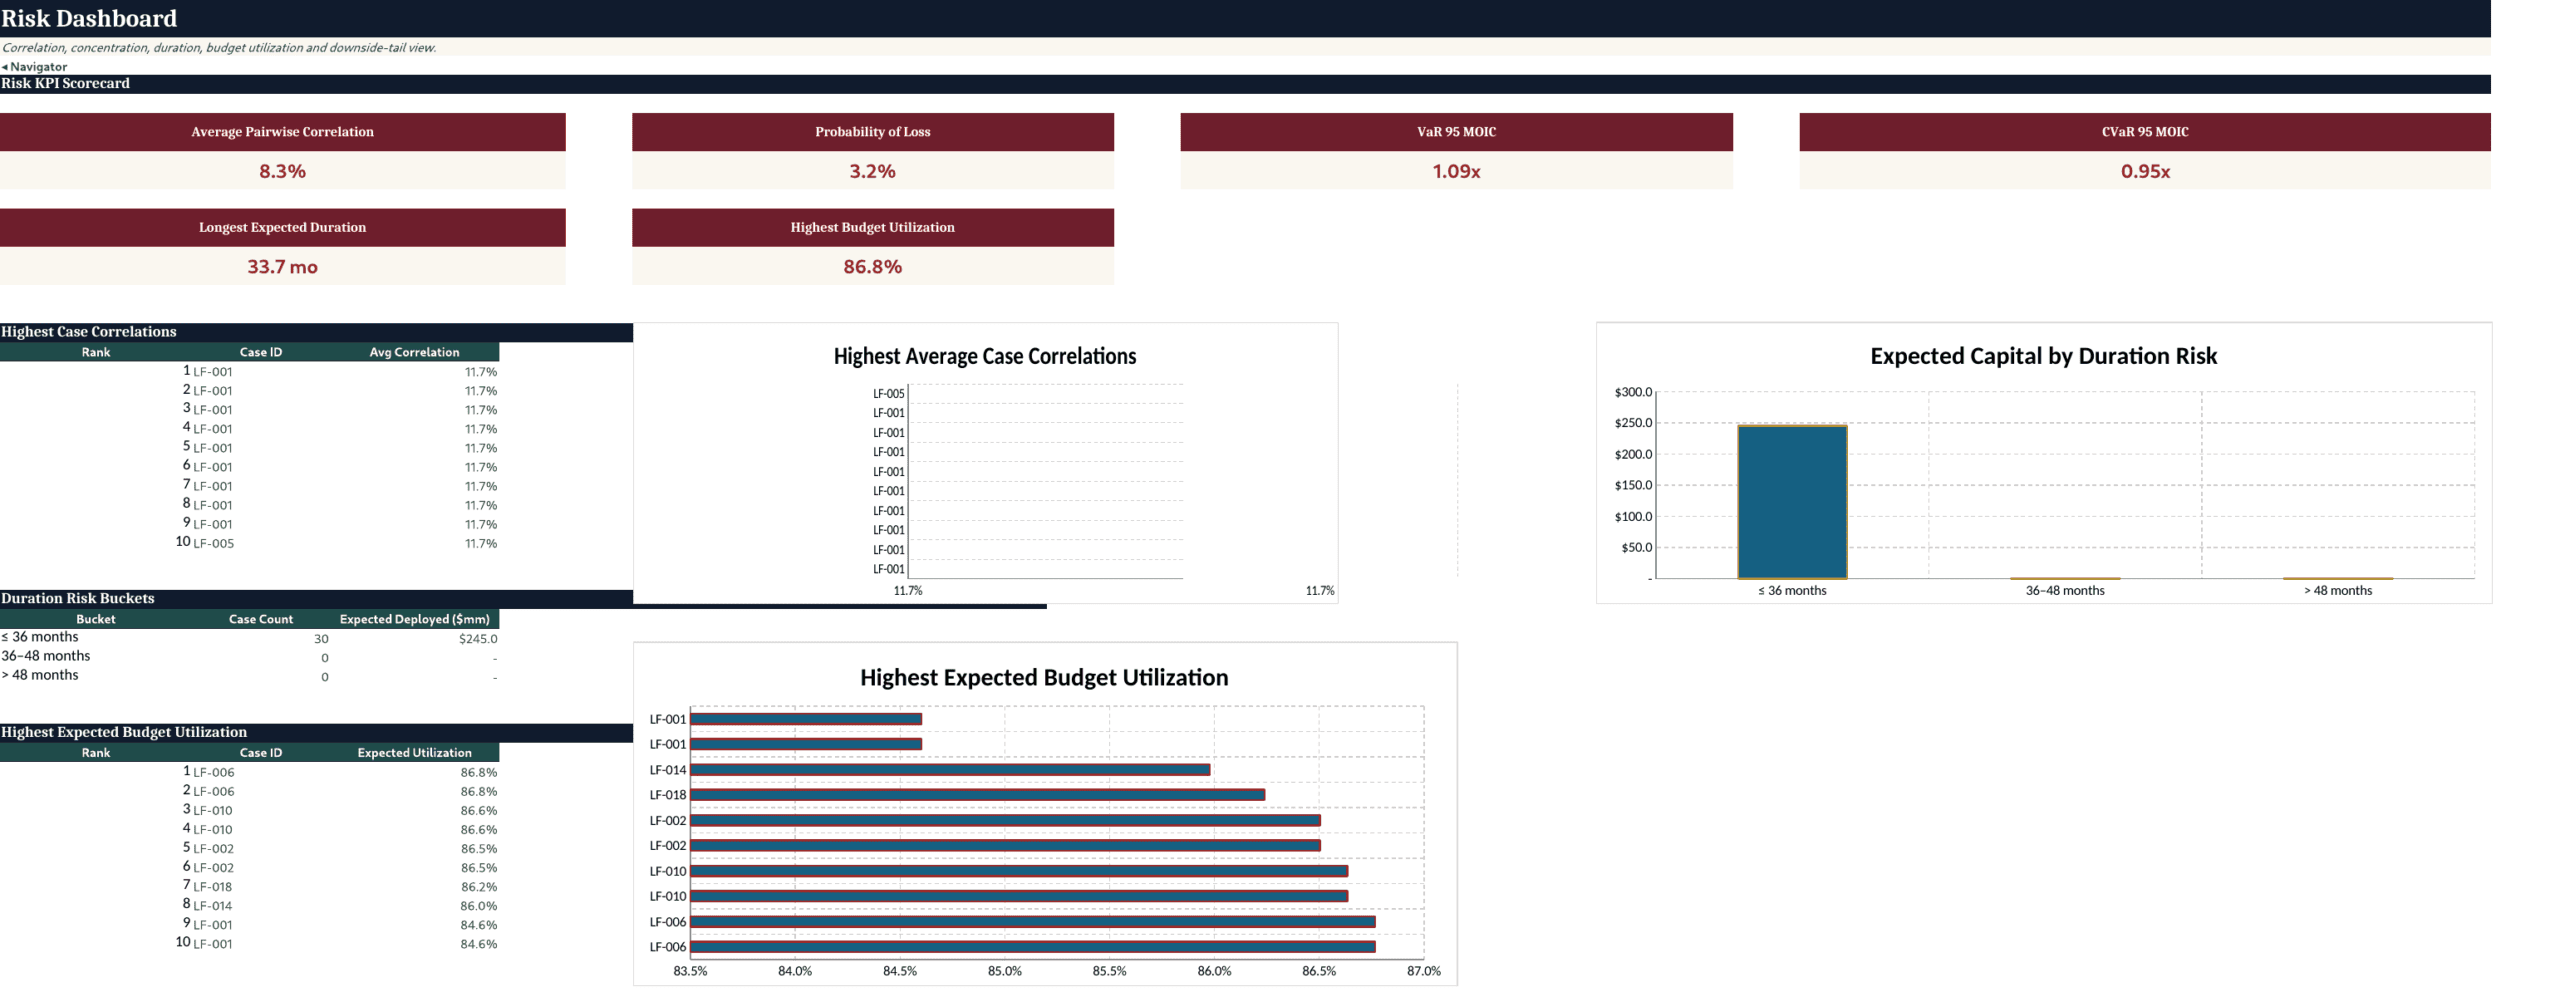
- Risk Dashboard – correlation, concentration, duration, budget-utilization and downside-tail view with ranked risk exposures.
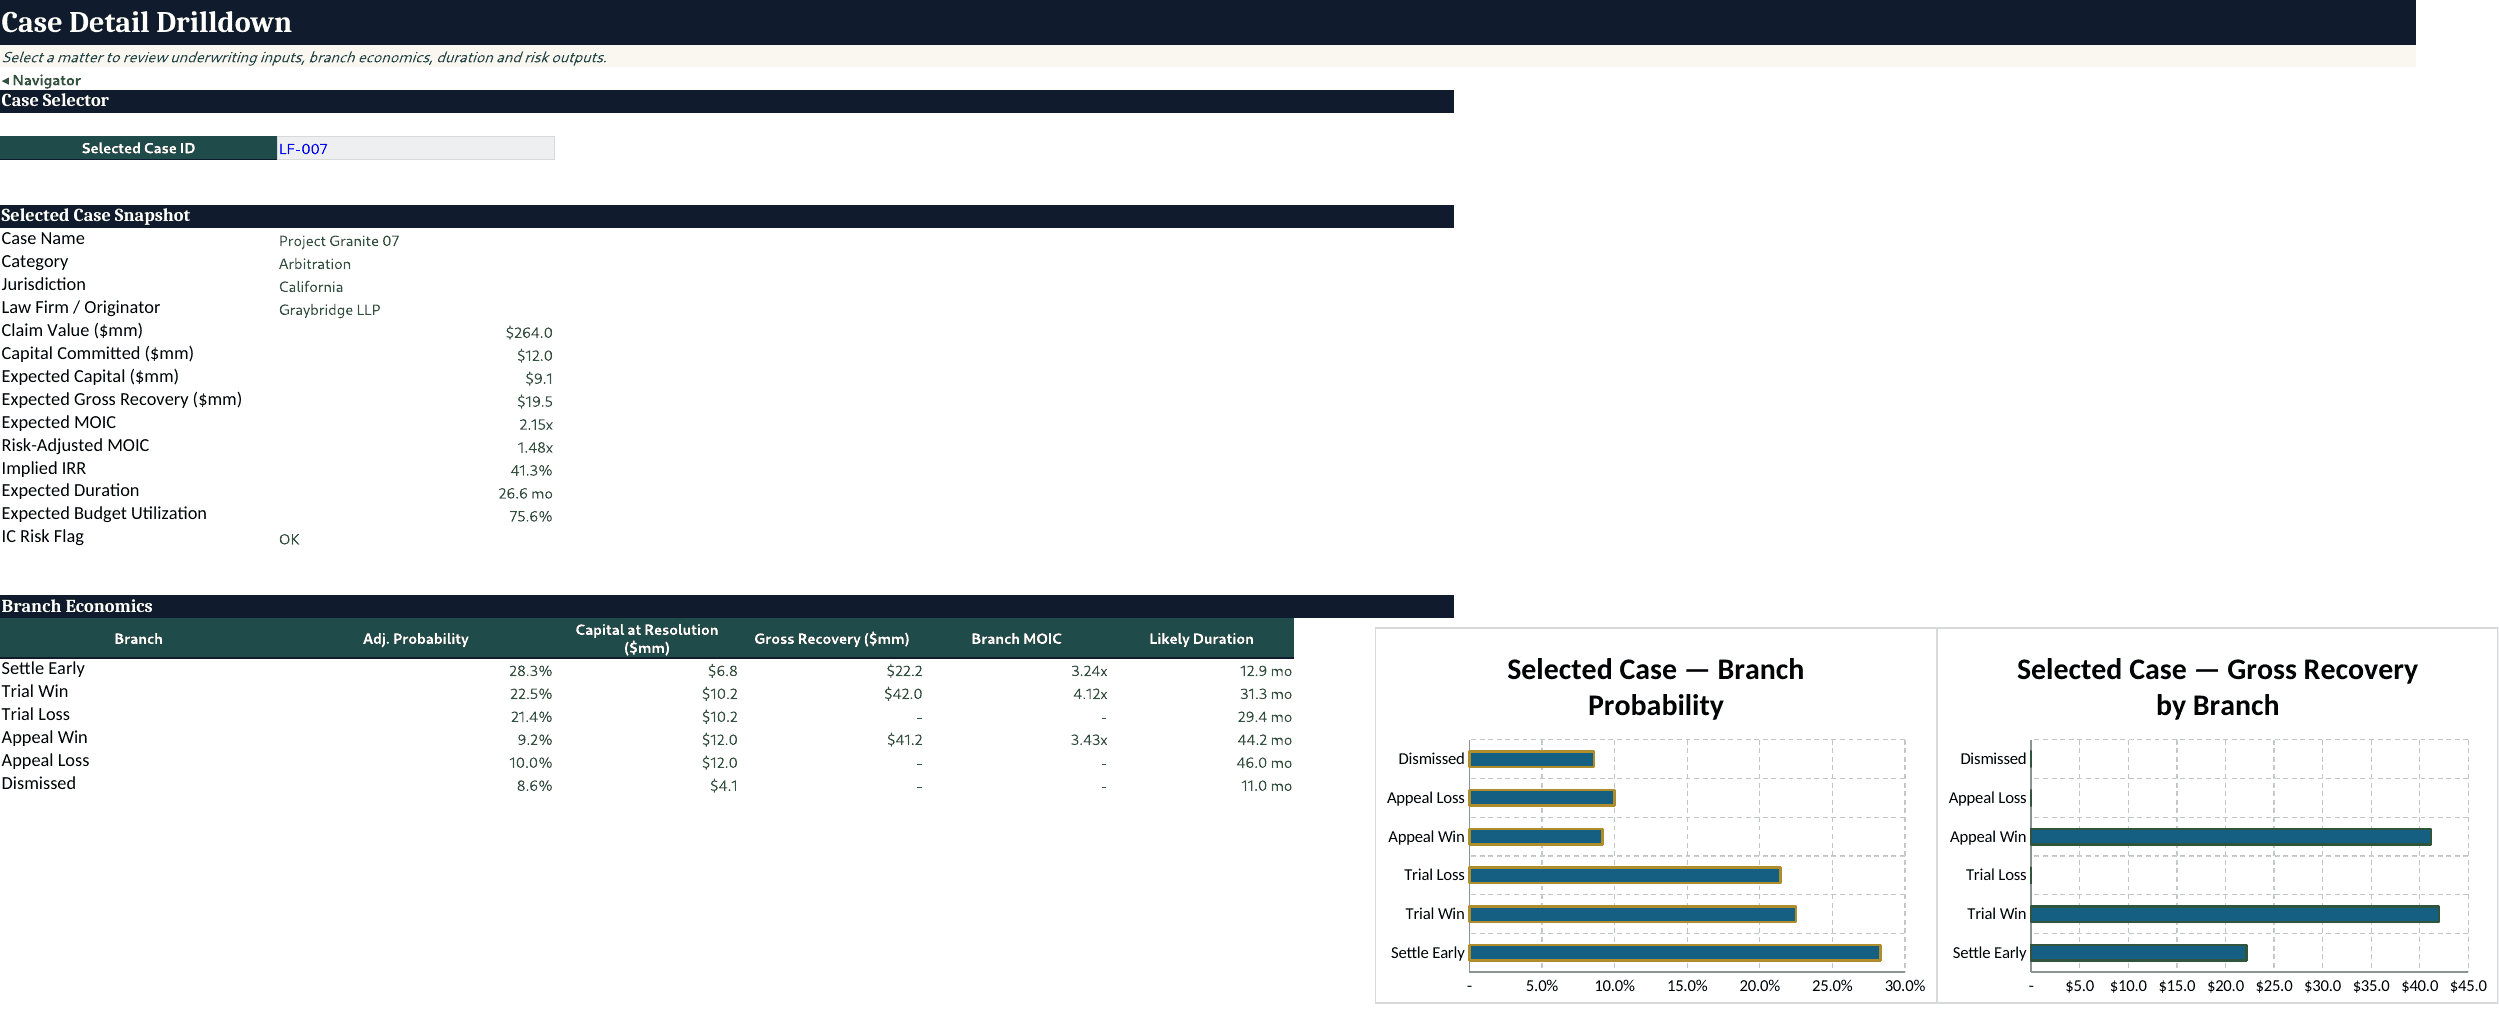
- Case Detail Drilldown – selectable matter view showing underwriting inputs, expected case economics and branch-level probability/recovery outputs.
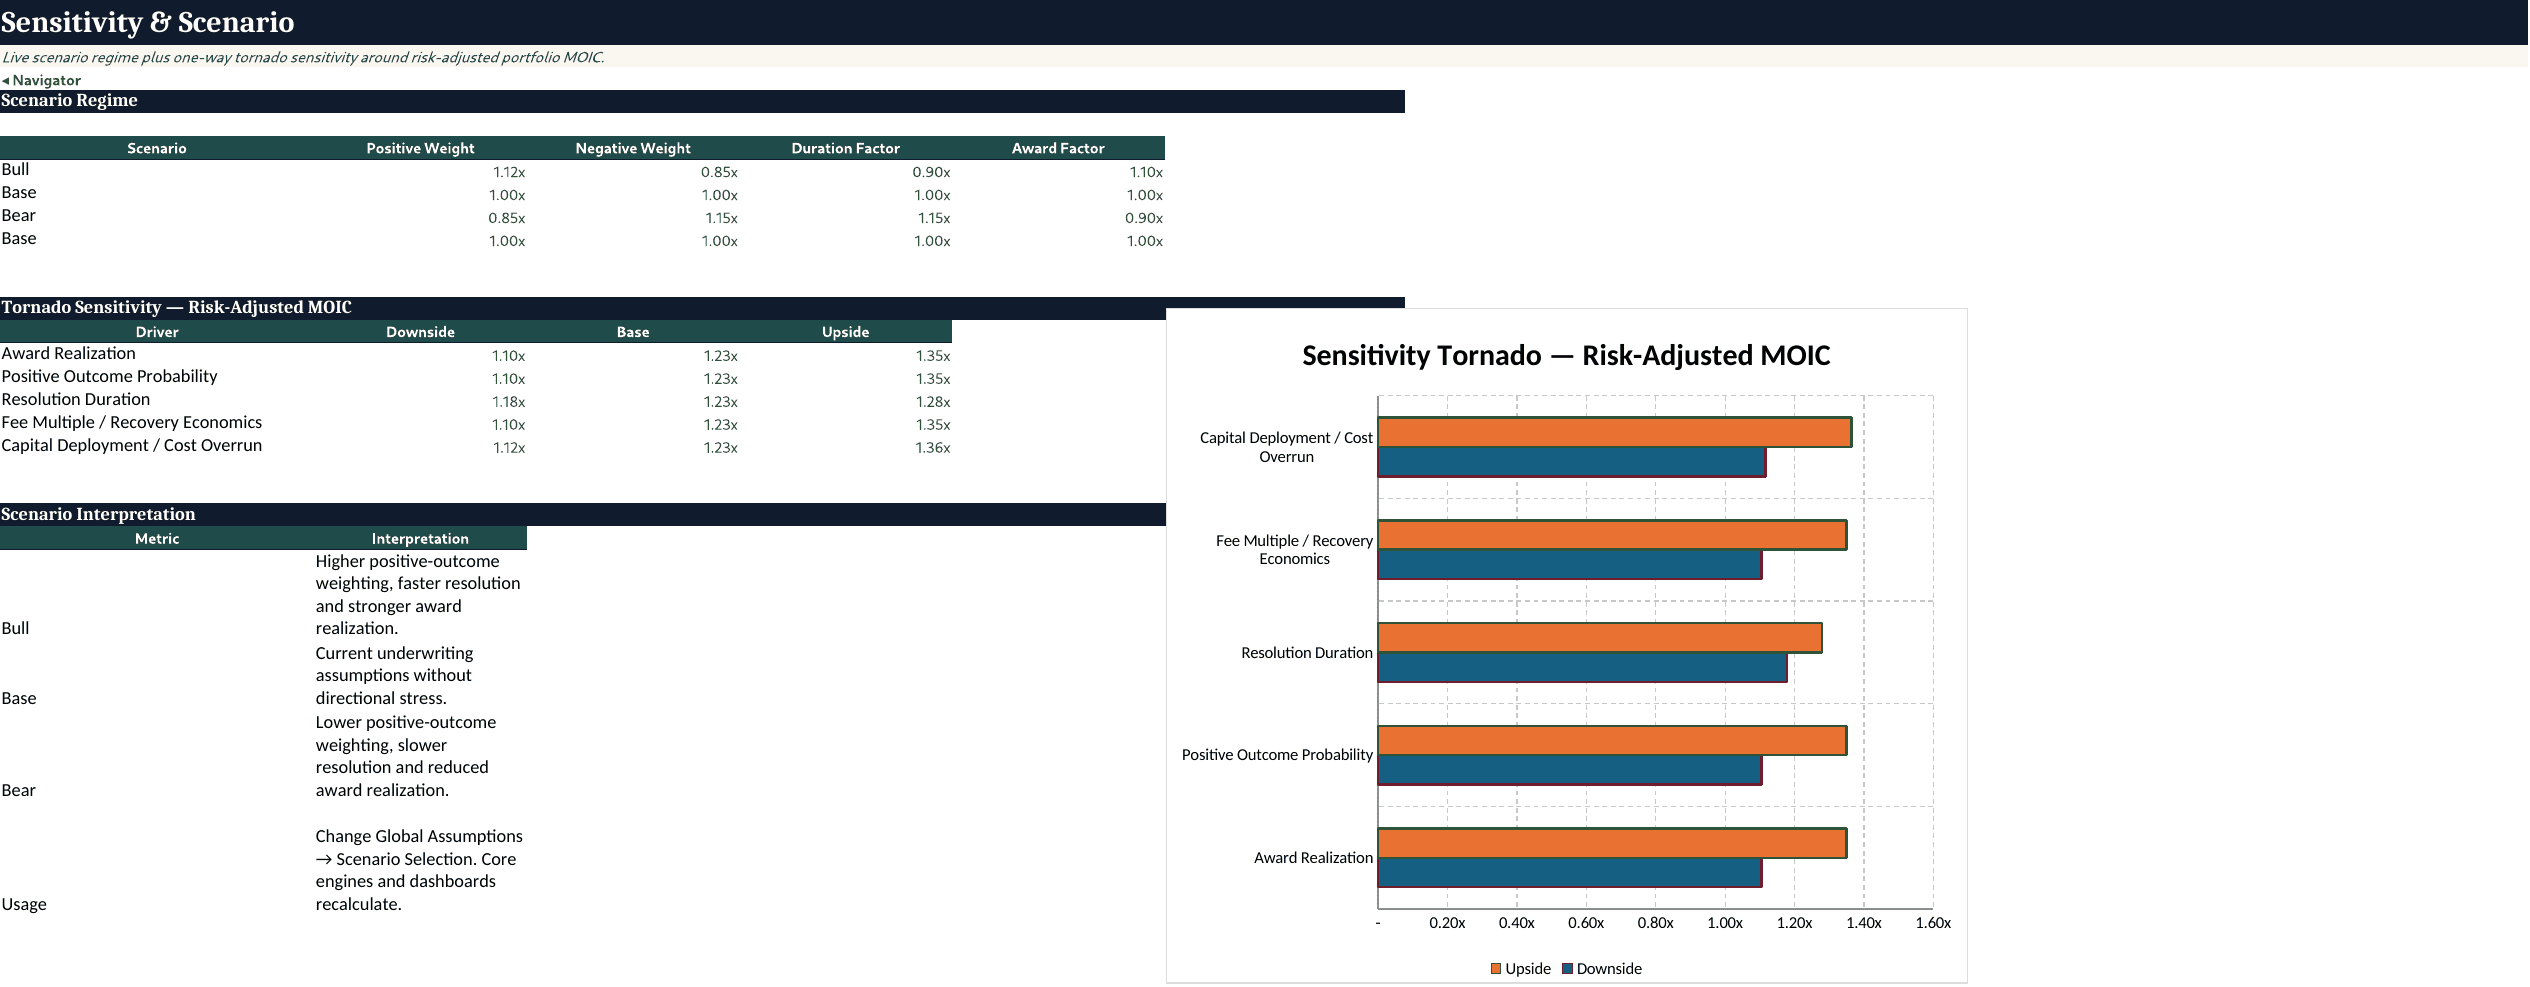
- Sensitivity & Scenario – Bull/Base/Bear regime plus a one-way tornado sensitivity for award realization, positive-outcome probability, resolution duration, recovery economics and capital deployment/cost overrun.
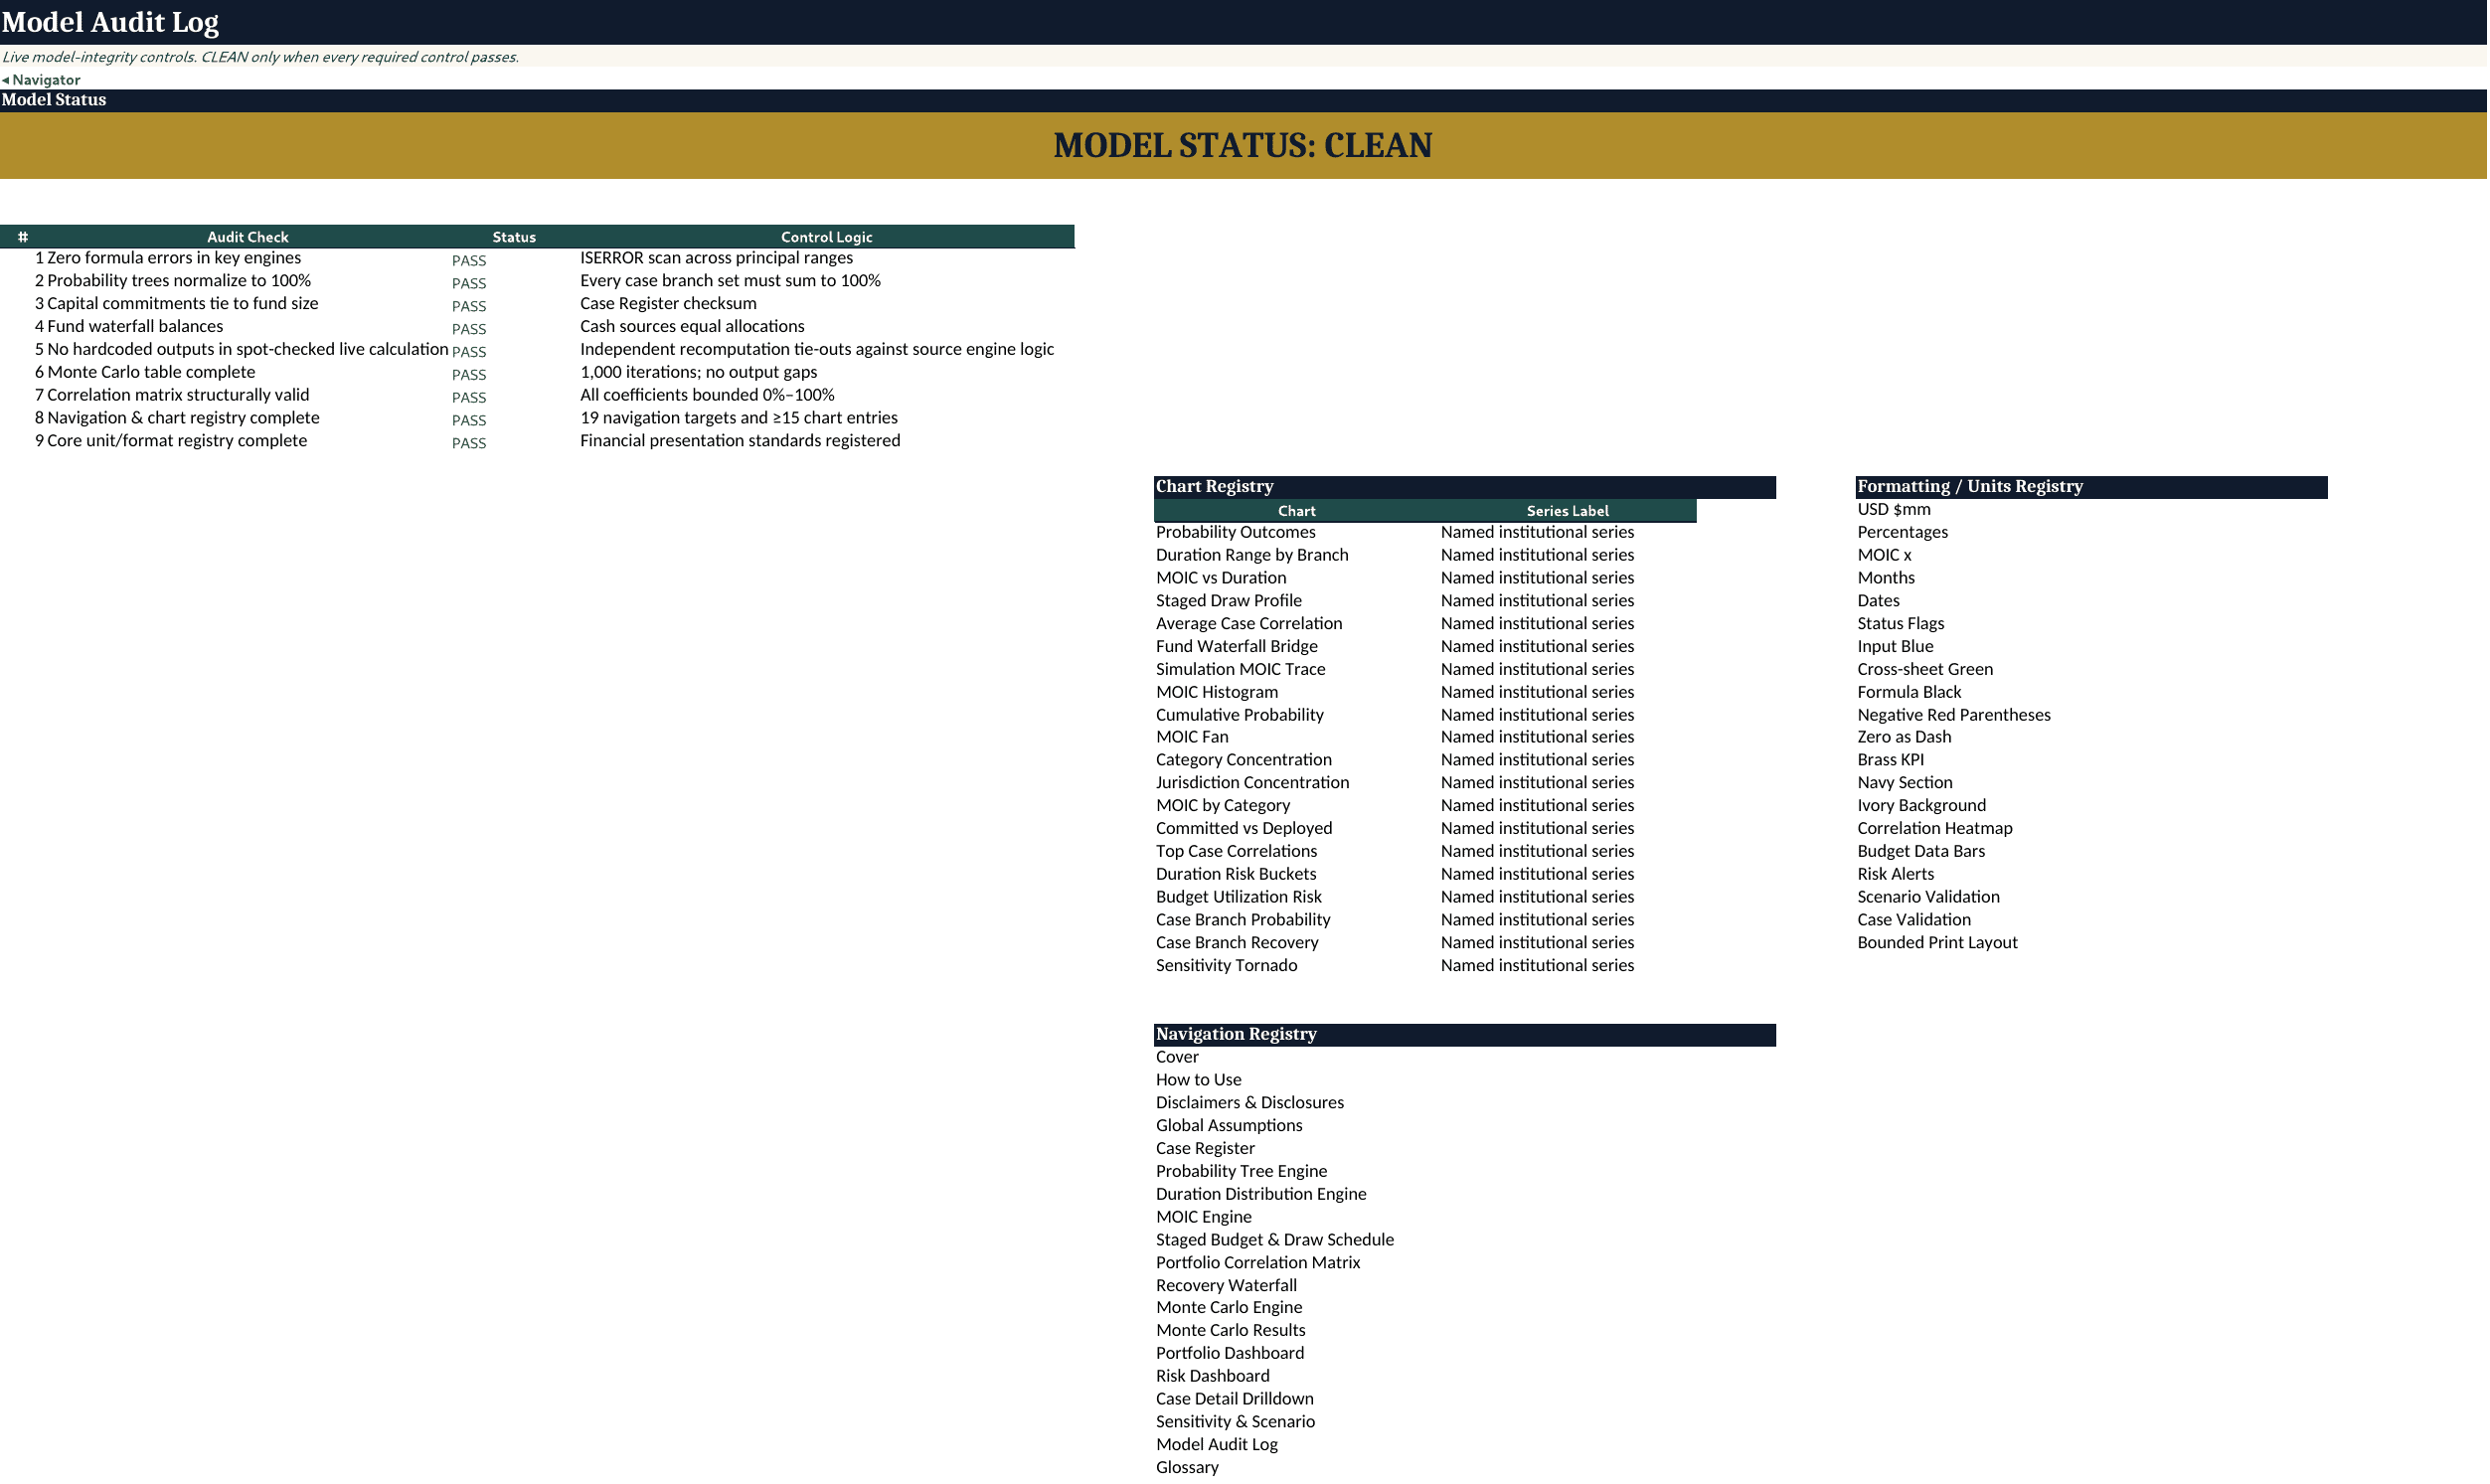
- Model Audit Log – workbook-authored control register covering probability normalization, commitment tie-outs, waterfall balance, simulation completeness, correlation bounds, navigation/chart registry and presentation-unit controls.
- Glossary – definitions for litigation-finance, portfolio-risk, return and waterfall terminology.
📊 Key analytical outputs
The model converts matter-level assumptions into both case and portfolio metrics. Core outputs include expected capital deployed, expected gross recovery, discounted recovery, expected MOIC, risk-adjusted MOIC, implied IRR, NPV, positive-outcome probability, expected duration, budget utilization, concentration by category and jurisdiction, pairwise correlation, net LP proceeds, probability of loss, VaR and CVaR.
Charts include portfolio outcome probability, branch duration range, MOIC versus resolution duration, staged draw profile, average pairwise correlation, fund waterfall bridge, simulation MOIC trace, MOIC distribution, cumulative probability, percentile fan, category and jurisdiction concentration, expected MOIC by category, committed versus expected deployed capital, highest case correlations, duration-risk buckets, budget-utilization risk and case-level branch views.
🛠️ Practical use cases
- Build a portfolio plan that links individual litigation matters to fund-level capital requirements.
- Forecast expected capital deployment when commitments are drawn in stages rather than funded entirely at inception.
- Compare case profitability using expected MOIC, risk-adjusted MOIC, implied IRR and expected NPV.
- Evaluate pricing and contractual recovery terms through fee multiples, award share and recovery caps.
- Stress Bull, Base and Bear assumptions for probability, award realization and resolution timing.
- Run one-way sensitivity analysis around the principal drivers of risk-adjusted portfolio MOIC.
- Measure concentration by case category, jurisdiction, case status and individual matter weight.
- Assess shared-attribute correlation across matters and identify cases with elevated average correlation.
- Quantify downside risk through probability of loss, 95%/99% VaR and CVaR.
- Examine LP/GP cash allocation through preferred return and carry waterfall mechanics.
- Review funding schedules, cumulative draws, unfunded commitments and budget-utilization warnings.
- Drill into one selected case to review branch probabilities, economics, duration and recovery outcomes.
- Prepare investment-committee views using executive and risk dashboards rather than raw engine tables.
- Compare portfolio construction choices before adding, resizing or repricing matters.
👥 Intended users
This workbook is suited to litigation-finance fund managers, underwriting teams, alternative-investment professionals, portfolio and risk analysts, investment committees, finance teams, advisors and legal-finance professionals who want a structured Excel decision tool for case and portfolio economics.
📦 Files and format
The core product is a completed .xlsx Excel workbook with 20 worksheets. The marketplace upload package also includes a 20-page full-sheet PDF preview. Values are presented primarily in USD millions where noted, and the workbook includes illustrative sample data so the model can be explored before replacing inputs with deal-specific assumptions.
Similar ProductsOther customers were also interested in...



 eFinancialModels
Electric Vehicle (EV) Charging Station Financial M...
With this comprehensive 5- or 10-year monthly tool, investors can assess the viability of setting up... Read more

Financial Model for Mobile App | Mobile App Busine...
The Mobile App Financial Plan Template in Excel allows you to develop financial projections when lau... Read more

 HenrySheykin
Food Truck Financial Model Excel Template
The Food Truck Financial Model helps entrepreneurs, founders, business owners, consultants, and anal... Read more

Green Hydrogen Production from Wind Energy Financi...
The Green Hydrogen from Wind Financial Model aims to comprehensively forecast a horizon of 40 years ... Read more

Simple Mutual Non-Disclosure Agreement Template
Protect your business secrets with ease using our Simple Mutual Non-Disclosure Agreement Template. S... Read more

Solar Energy Financial Model
The Solar Energy Financial Model Spreadsheet Template in Excel assists you in preparing a sophistica... Read more

 Peter Graf
The Customer-Centric Financial Model for Restauran...
Starting a restaurant without a financial plan is like driving a car blindfolded. You wouldn´t do i... Read more
You must log in to submit a review.