
0 ITEMS

Hospital Financial Model Excel Template
The Hospital Financial Model Financial Model Template helps entrepreneurs, healthcare founders, business owners, consultants, and financial analysts build a structured forecast for launching, expanding, or evaluating a hospital business. Instead of starting from a blank spreadsheet, users can work from a ready-made model designed around the financial realities of a healthcare facility, including treatment capacity, practitioner utilization, service pricing, medical supplies, pharmaceuticals, facility costs, staffing, capital expenditure, cash flow, and profitability. The template is built to support practical financial planning, business plan preparation, funding discussions, and internal decision-making. This Hospital Financial Model gives users a clear way to organize revenue assumptions, startup costs, operating expenses, payroll planning, cost of goods sold, and major capital investments in one connected forecast. It can be used to estimate income from core hospital revenue streams such as surgical procedures, emergency room visits, specialist consultations, treatments, radiology, and imaging services. By adjusting assumptions such as practitioner count, monthly treatment capacity, utilization rate, pricing, reimbursement expectations, and cost percentages, users can test how the hospital may perform under different operating conditions and understand which drivers have the greatest effect on financial results. The template is especially useful for people preparing investor presentations, lender packages, feasibility studies, budget plans, or strategic growth cases. It includes connected financial statements and planning outputs that help users review projected revenue, expenses, EBITDA, cash flow, balance sheet movement, profitability, and break-even analysis. The model also supports scenario planning so users can compare low, base, and high cases, evaluate risks, and make more informed decisions before committing capital. With editable assumptions, professional formatting, and compatibility with Excel and Google Sheets, the template provides a practical foundation for hospital financial forecasting without requiring users to build the model from scratch. Designed for both startups and established healthcare operators, the Hospital Financial Model helps translate operational plans into financial projections that stakeholders can understand. It supports decision-making around capacity planning, cost control, staffing, funding needs, equipment investment, pricing strategy, and long-term sustainability. Whether the goal is to validate a new hospital concept, secure financing, analyze expansion potential, or improve the quality of a business plan, this financial model template gives users a structured and customizable way to evaluate the numbers behind the opportunity.


Financial Model Overview
The Hospital Financial Model Financial Model Template is a ready-to-use planning tool designed to help users forecast the financial performance of a hospital startup, healthcare facility, or hospital expansion project. It brings together the key assumptions that matter in a hospital business, including practitioner capacity, patient volume, treatment pricing, utilization rates, medical supply costs, pharmaceutical costs, staffing, facility expenses, capital equipment, cash flow, profitability, and investor returns. Hospitals are capital-intensive and operationally complex, so a structured model is essential for understanding how revenue, expenses, funding needs, and liquidity interact over time.
This template helps entrepreneurs, healthcare founders, business owners, consultants, analysts, and finance teams turn a hospital plan into a clear five-year forecast that can support business planning, lender conversations, investor presentations, feasibility studies, and internal decision-making. Users can edit the assumptions to reflect their own market, facility size, service mix, reimbursement environment, staffing plan, and growth strategy, while the model calculates the financial outputs needed to evaluate whether the hospital can reach sustainable profitability.
All-in-One Dashboard
The all-in-one dashboard gives users a centralized view of the hospital model’s most important inputs and outputs in one place. It is designed to help users quickly understand how the business is expected to perform without searching through multiple worksheets or rebuilding summaries manually. The dashboard may include core assumptions such as launch timing, forecast period, service pricing, practitioner count, monthly treatment capacity, utilization rates, major cost assumptions, capital spending, and financing inputs. It then connects those assumptions to key outputs such as projected revenue, gross profit, EBITDA, net profit, cash balance, funding needs, payback period, and return metrics.
For hospital planning, this is especially useful because management teams and stakeholders often need to review complex information quickly, including whether patient volume is sufficient, whether margins can absorb medical supply and payroll costs, and whether the facility has enough cash to support operations. The dashboard helps users make faster decisions by turning the model into a practical control center for planning, budgeting, reviewing, and presenting the financial outlook.
Low, Base, and High Scenario Analysis
The low, base, and high scenario analysis section helps users compare multiple possible outcomes for the hospital instead of relying on one fixed forecast. A hospital’s results can change significantly based on patient demand, practitioner utilization, reimbursement rates, treatment pricing, payer mix, staffing levels, supply costs, collection timing, and capital spending. This component allows users to model a conservative case, a realistic base case, and an upside case so they can understand how sensitive the hospital’s financial performance may be under different conditions.
Inputs may include lower or higher patient volumes, different utilization rates, changes in service pricing, adjusted medical supply percentages, modified payroll assumptions, or alternative capital expenditure schedules. The outputs help users compare revenue, EBITDA, profit margins, cash flow, cash balances, funding requirements, and return metrics across each scenario. This is valuable for investor and lender discussions because it shows that the user has considered risk, downside protection, and growth potential. It also helps management prepare contingency plans, set realistic targets, and make better decisions before committing major capital to a hospital project.
Professional Charts
The professional charts component converts the hospital’s financial forecast into visual outputs that are easier to understand and present. Hospitals involve many moving parts, including multiple revenue streams, large fixed costs, high payroll requirements, expensive equipment, and working capital demands. Charts help users communicate these elements clearly by showing trends in revenue growth, expense structure, EBITDA, net income, cash flow, capital expenditure, cash balance, and other key financial metrics over time. Inputs are drawn automatically from the model’s assumptions and calculated financial statements, which means users can update their assumptions and see the visuals refresh as the forecast changes.
These charts are useful for pitch decks, bank meetings, board discussions, internal planning sessions, and executive summaries because they make complex financial information more accessible. Instead of presenting only rows of numbers, users can show stakeholders how the hospital is expected to scale, when profitability improves, how cash moves through the business, and which financial drivers matter most. This visual reporting format supports more confident communication and helps stakeholders quickly identify the story behind the forecast.
ROE Components and DuPont Analysis
The ROE components and DuPont analysis section helps users evaluate the hospital’s return on equity by breaking performance into the underlying financial drivers behind the result. Rather than viewing return on equity as a single percentage, DuPont analysis separates it into components such as profitability, asset efficiency, and leverage. In a hospital model, this is especially useful because returns may be influenced by high-value medical services, large capital investments, equipment utilization, debt financing, working capital efficiency, and operating margins.
Inputs may include net income, revenue, total assets, equity, debt, profit margins, and balance sheet assumptions. The output helps users understand whether returns are being driven by strong operating profit, efficient use of assets, financial leverage, or a combination of these factors. This is valuable for investors, lenders, owners, and analysts because it provides a more detailed explanation of financial performance and investment quality. For a hospital project with significant equipment and facility investment, DuPont analysis helps users evaluate whether capital is being used productively and whether the projected return profile is supported by the operating model.
Revenue Inputs
The revenue inputs section is where users define the core assumptions that drive hospital income. Hospital revenue is typically built from a combination of practitioner capacity, patient volume, service mix, pricing, utilization, and reimbursement assumptions. This component may allow users to input the number of surgeons, specialists, emergency care providers, radiology units, treatment rooms, monthly treatment capacity, expected utilization rate, average price per procedure, emergency visit revenue, consultation fees, imaging charges, and expected annual growth.
For example, revenue can be modeled from the bottom up by estimating how many practitioners are available, how many treatments each can perform each month, what percentage of capacity is actually used, and what average fee or reimbursement is expected for each service. The model then translates those assumptions into monthly and annual revenue projections. This is critical for hospital financial planning because revenue assumptions must be defensible, not arbitrary. By connecting operational capacity to financial output, the revenue inputs section helps users validate whether the hospital can generate enough income to cover direct medical costs, payroll, facility expenses, debt obligations, and capital requirements.
Bank-Ready Reports
The bank-ready reports component provides professionally structured financial outputs that can support lender reviews, financing discussions, and formal business planning. Hospitals often require significant upfront investment for equipment, facility preparation, technology, licenses, working capital, and staffing before revenue reaches its full potential. Lenders and financing partners need clear reports that show how the business will generate revenue, manage expenses, maintain liquidity, repay debt, and remain financially viable. This section may include projected Profit and Loss statements, cash flow statements, balance sheets, debt schedules, funding summaries, and key repayment indicators.
Inputs come from the model’s operating assumptions, startup cost estimates, financing terms, expense categories, and revenue forecast. The outputs help users present a complete view of financial performance, including revenue, gross profit, EBITDA, net income, working capital movement, cash reserves, assets, liabilities, and equity. This is useful because it saves time on report preparation and helps users communicate financial plans in a format that banks, lenders, investors, and advisors can evaluate more easily. It also strengthens credibility by showing that the forecast is connected and organized rather than assembled from disconnected estimates.
Revenue Breakdown
The revenue breakdown section provides a detailed view of the hospital’s income by revenue stream, helping users understand which services contribute most to overall sales and profitability. A hospital may earn revenue from surgical procedures, emergency room visits, specialist consultations, treatments, radiology, imaging services, diagnostic procedures, inpatient care, outpatient services, and other medical offerings. This component lets users separate the revenue forecast into specific categories, each with its own volume, pricing, utilization, and growth assumptions. The model can then calculate total revenue by stream and show how each category changes over time.
This is valuable because not all hospital services have the same economics. Some may generate high revenue but require expensive equipment or specialist staffing, while others may provide steady patient flow with different margin characteristics. A detailed revenue breakdown helps users evaluate the service mix, identify high-value areas, test the impact of adding new departments, and decide where to focus marketing, staffing, and capital investment. It also improves transparency for investors and lenders by showing exactly how projected revenue is built rather than presenting only a single top-line number.
KPI Dashboard
The KPI dashboard helps users monitor the hospital’s performance through key financial and operational metrics that are relevant to healthcare planning. While the all-in-one dashboard provides a broad view of the model, the KPI dashboard focuses on measurable indicators that help users evaluate whether the hospital is operating efficiently and progressing toward its financial goals.
Inputs may include patient volume, practitioner count, treatment capacity, utilization rate, revenue by service, direct medical costs, payroll, EBITDA, cash flow, capital spending, and balance sheet values. Outputs may include revenue growth, gross margin, EBITDA margin, net profit margin, average revenue per treatment, utilization percentage, cash balance, return on equity, payback period, and cost ratios such as medical supplies and pharmaceuticals as a percentage of revenue.
This section is useful for decision-making because it highlights performance drivers that management can act on. If utilization is too low, the team can review patient acquisition or scheduling. If supply costs are rising, procurement strategies can be adjusted. If cash flow tightens, working capital or financing options can be reviewed. The KPI dashboard helps turn the financial model into an ongoing management tool rather than a one-time forecast.
Break-Even Analysis
The break-even analysis section helps users determine when the hospital is expected to cover its costs and begin generating profit. This is one of the most important questions for any hospital startup or expansion because the business may require large upfront investment, significant fixed monthly expenses, and substantial staffing before patient volumes stabilize. Inputs may include fixed operating costs, variable costs, direct medical supply percentages, pharmaceutical costs, payroll, facility lease, utilities, insurance, administrative expenses, average revenue per service, utilization rates, and service mix assumptions.
The model uses these inputs to estimate the revenue level, patient volume, or time period required to reach break-even. Outputs may include monthly break-even timing, required revenue, required treatments or visits, contribution margin, and the gap between projected performance and break-even levels. This is useful for founders, investors, lenders, and operators because it clarifies the minimum performance required to sustain the business. It also helps users test whether the hospital can realistically reach profitability under different scenarios and whether cost reductions, pricing changes, staffing adjustments, or additional funding may be needed to support the path to break-even.
Startup Costs and Capital Expenditure Planning
The startup costs and capital expenditure planning section helps users estimate the initial investment required to open or expand the hospital. Hospitals often need substantial capital before operations begin, including medical equipment, imaging systems, surgical technology, facility improvements, IT infrastructure, compliance systems, furniture, licensing, deposits, initial inventory, and working capital. This component allows users to organize those costs into a clear plan, separating one-time launch expenses from recurring operating costs.
Inputs may include equipment purchases such as MRI machines, CT scanners, surgical systems, HVAC upgrades, diagnostic tools, hospital beds, medical software, facility buildout, pre-opening payroll, professional fees, insurance, and contingency reserves. The outputs help users understand total funding requirements, timing of cash outflows, depreciation assumptions, and the effect of capital investment on the balance sheet and cash flow forecast.
This is essential for funding preparation because investors and lenders need to see exactly how much capital is required and how it will be used. It also helps management avoid underestimating launch costs, plan equipment purchases responsibly, and ensure the hospital has enough financial runway to begin operations with the resources needed to serve patients effectively.
File types:
Excel – Single-User: .xlsx
Excel – Multi-User: .xlsx
Similar ProductsOther customers were also interested in...

 HenrySheykin
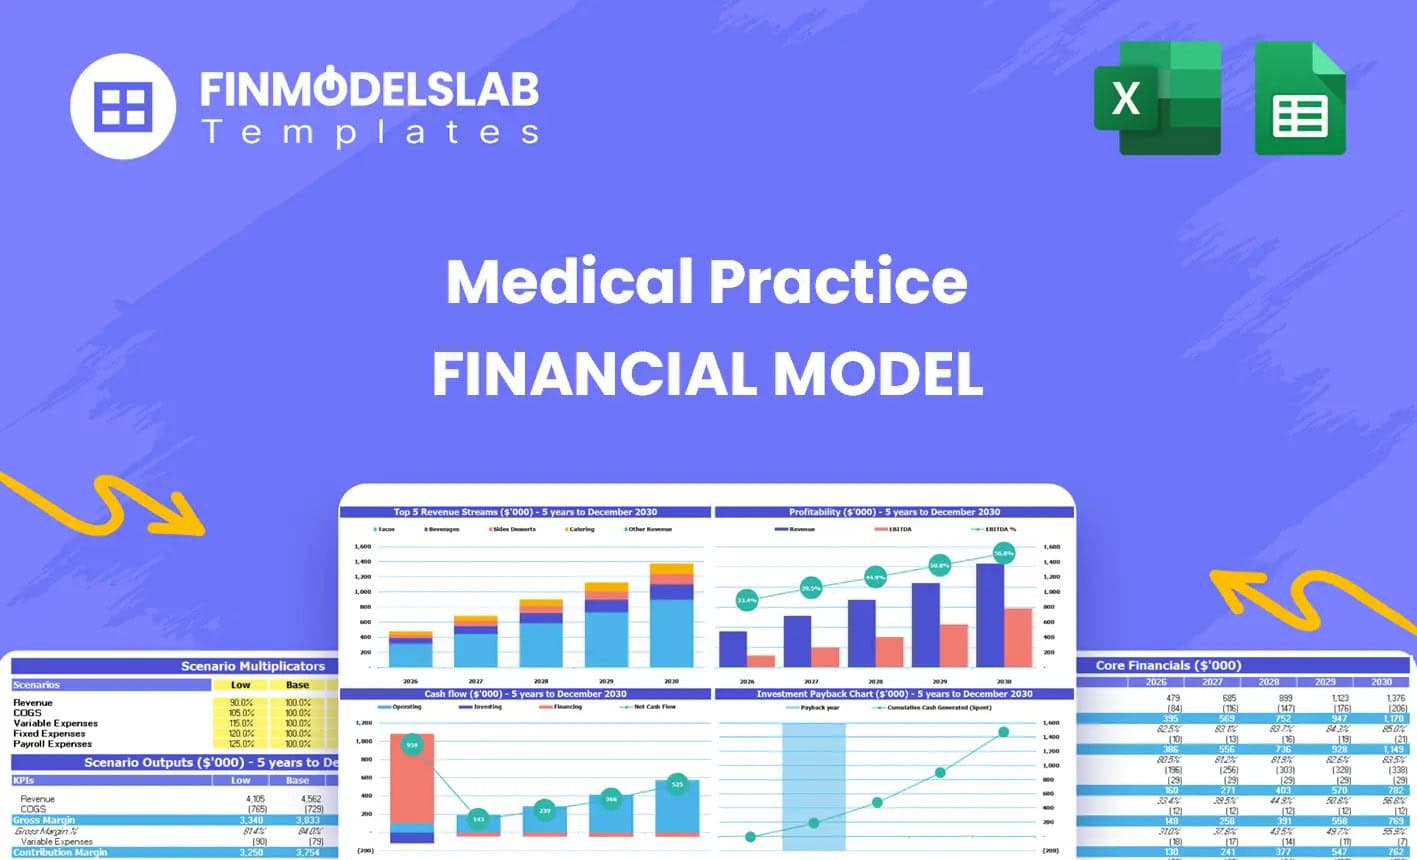
Medical Practice Financial Model Excel Template
The Medical Practice Financial Model helps users turn a clinic concept, expansion plan, or healthcar... Read more
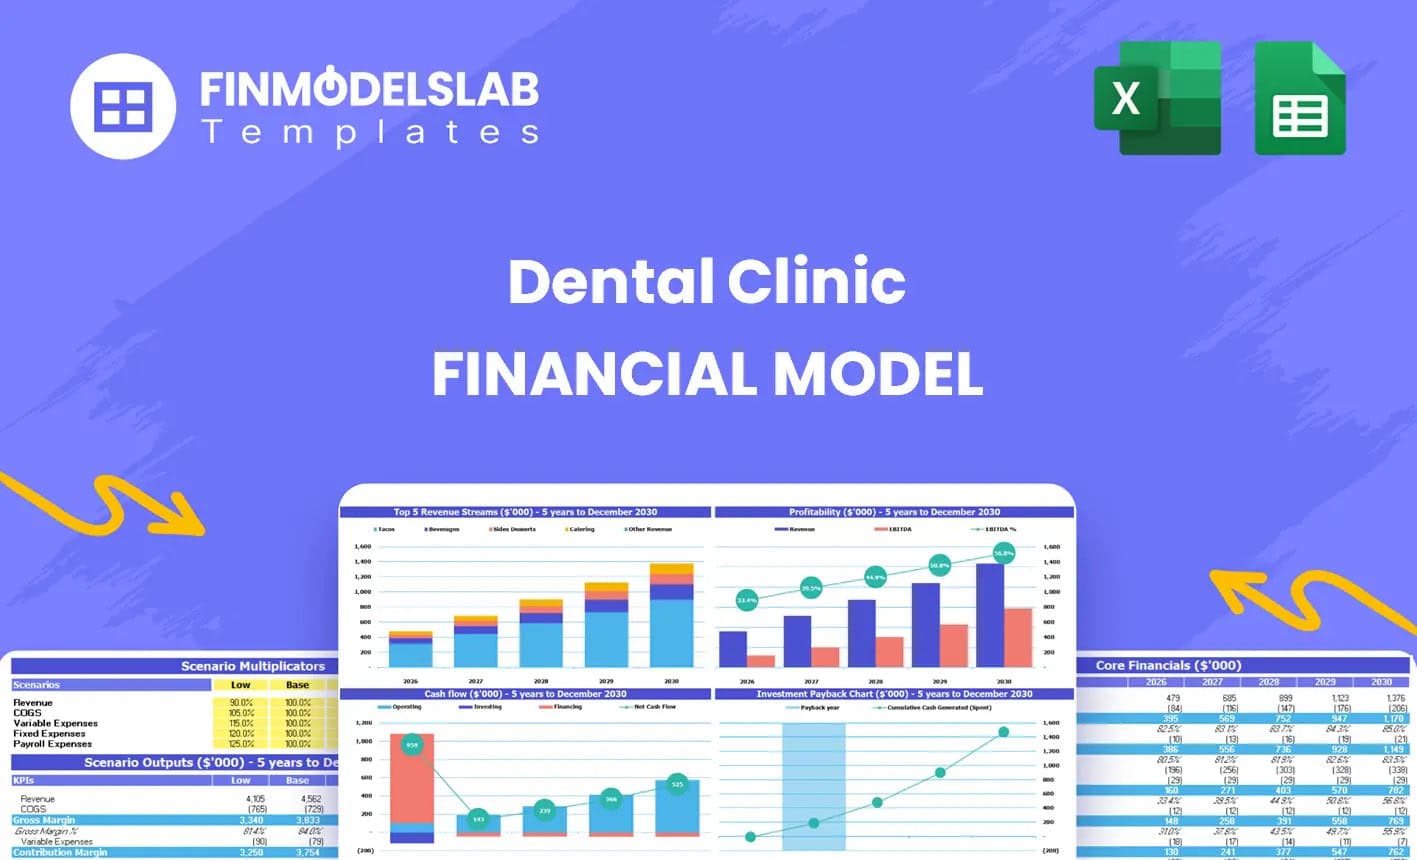
Dental Practice Financial Model Excel Template
The Dental Clinic Financial Model helps users turn a dental practice concept, launch plan, or expans... Read more

Ophthalmology Financial Model Excel Template
The Ophthalmology Clinic Financial Model is a ready-to-use financial model template designed to help... Read more
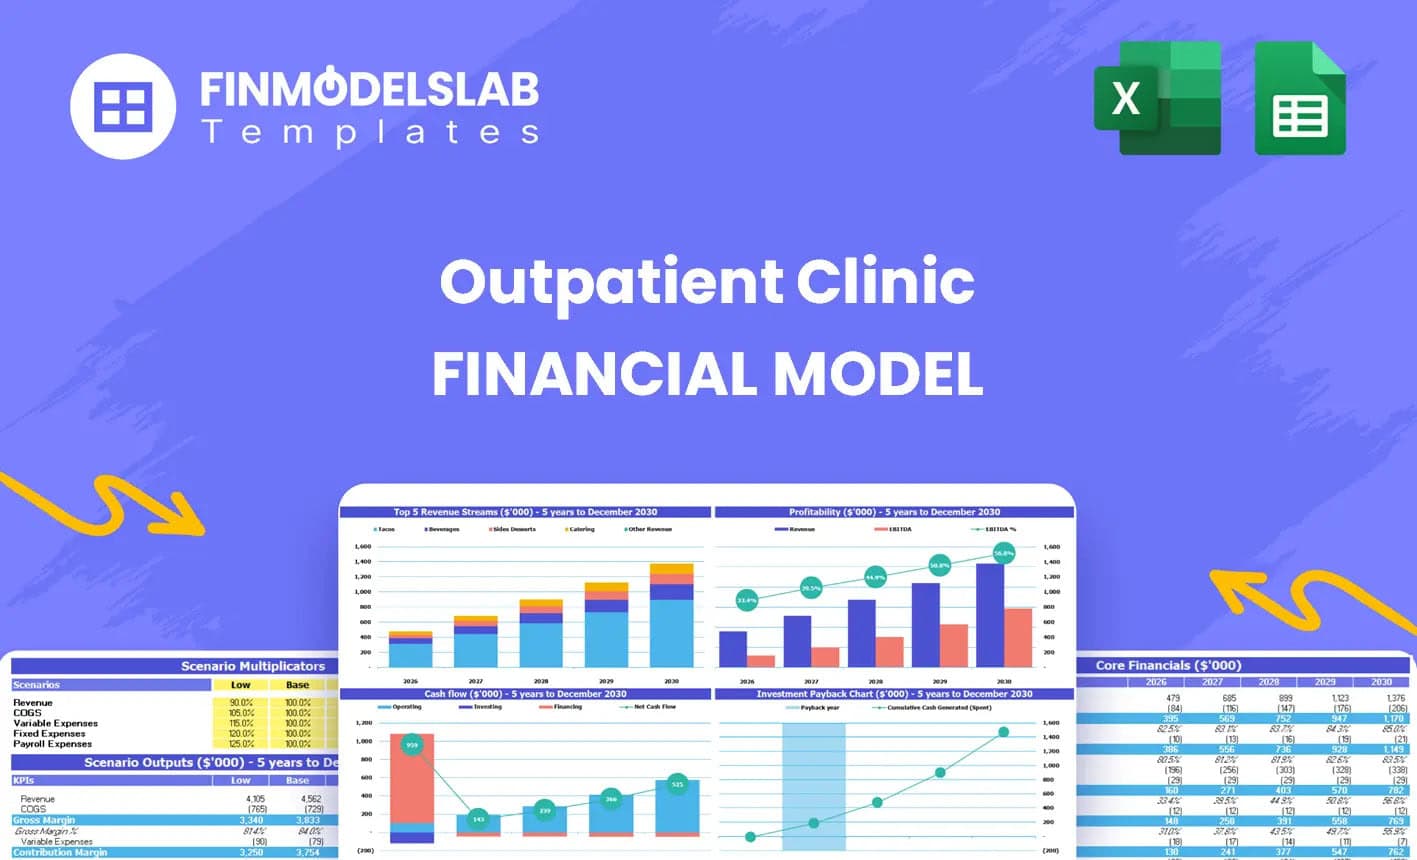
Outpatient Clinic Financial Model Excel Template
The Outpatient Clinic Financial Model helps users turn a clinic business concept into a structured, ... Read more
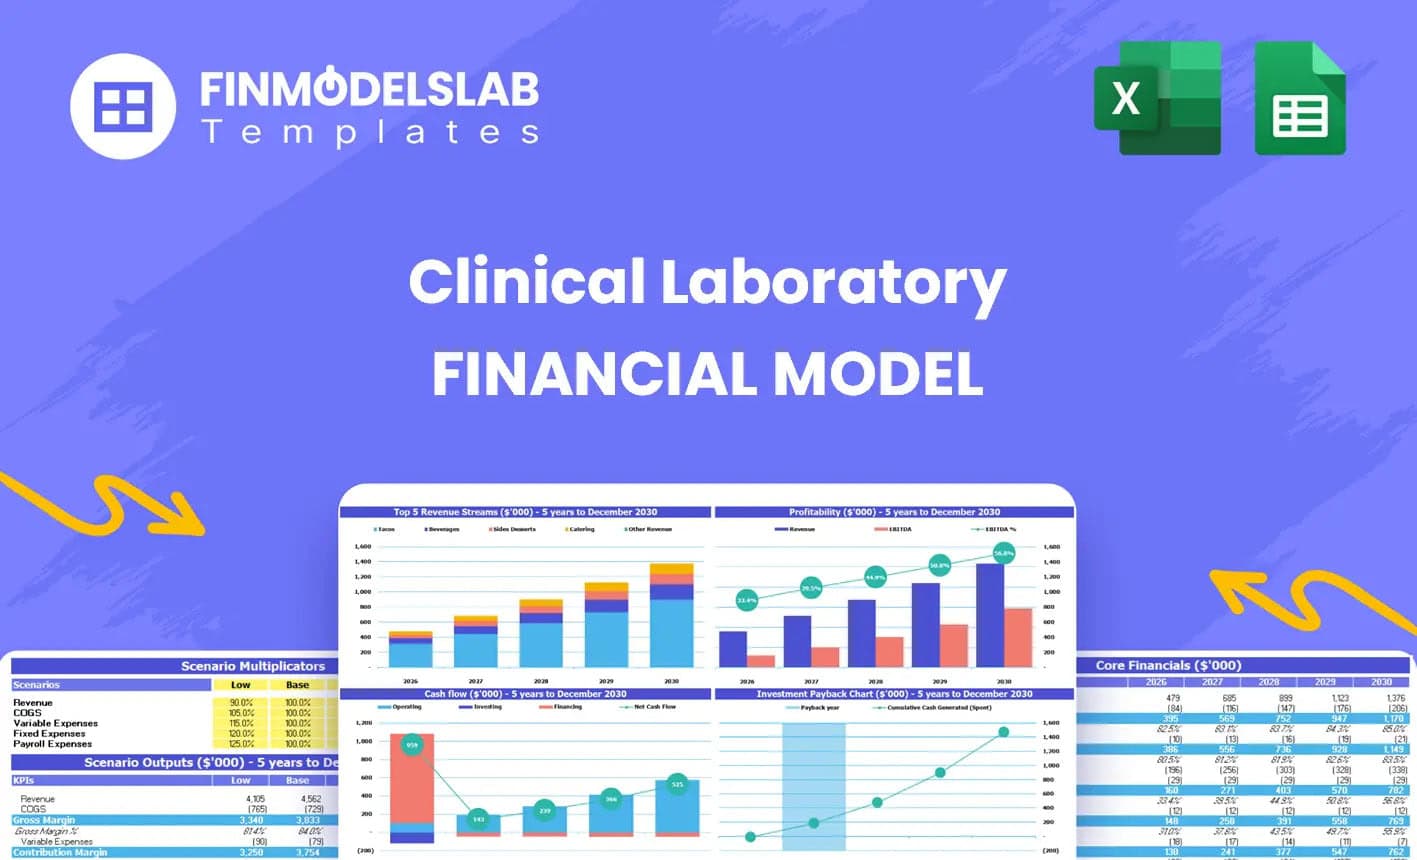
Clinical Lab Financial Model Excel Template
The Clinical Laboratory Financial Model helps users turn a diagnostic lab concept into a structured ... Read more

Medical Tourism Financial Model Excel Template
The Medical Tourism Financial Model Template helps users turn a cross-border healthcare business ide... Read more
Clinic Financial Model Excel Template
The Healthcare Clinic Financial Model helps founders, clinic owners, consultants, analysts, and busi... Read more
Urgent Care Center Financial Model Excel Template
The Urgent Care Center Financial Model helps users turn a walk-in clinic concept into a structured f... Read more

Physiotherapy Financial Model Excel Template
The Physiotherapy Clinic Financial Model helps founders, clinic owners, consultants, analysts, and b... Read more
Dialysis Center Financial Model Excel Template
The Hemodialysis Center Financial Model helps users evaluate the financial feasibility of launching,... Read more
You must log in to submit a review.