
0 ITEMS

Food & Beverage Manufacturing Financial Model Excel | 10-Year Forecast, SKU Costing & Investor Returns
Evaluate food and beverage manufacturing economics with 24 linked Excel worksheets, 15 SKUs, 500 BOM rows, 3 production lines, 4 scenarios, 3 financial statements, 8 native dashboard charts, investor IRR/NPV and a 28-page guide.
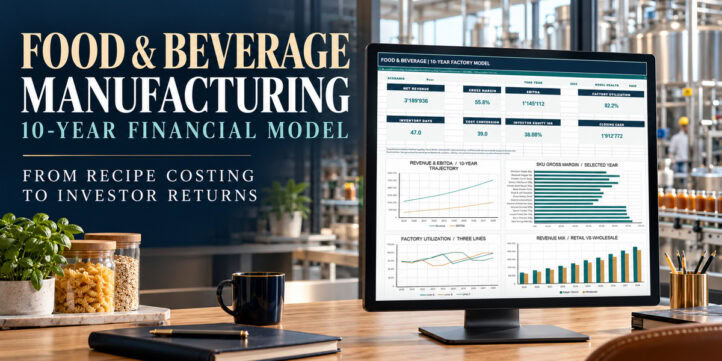
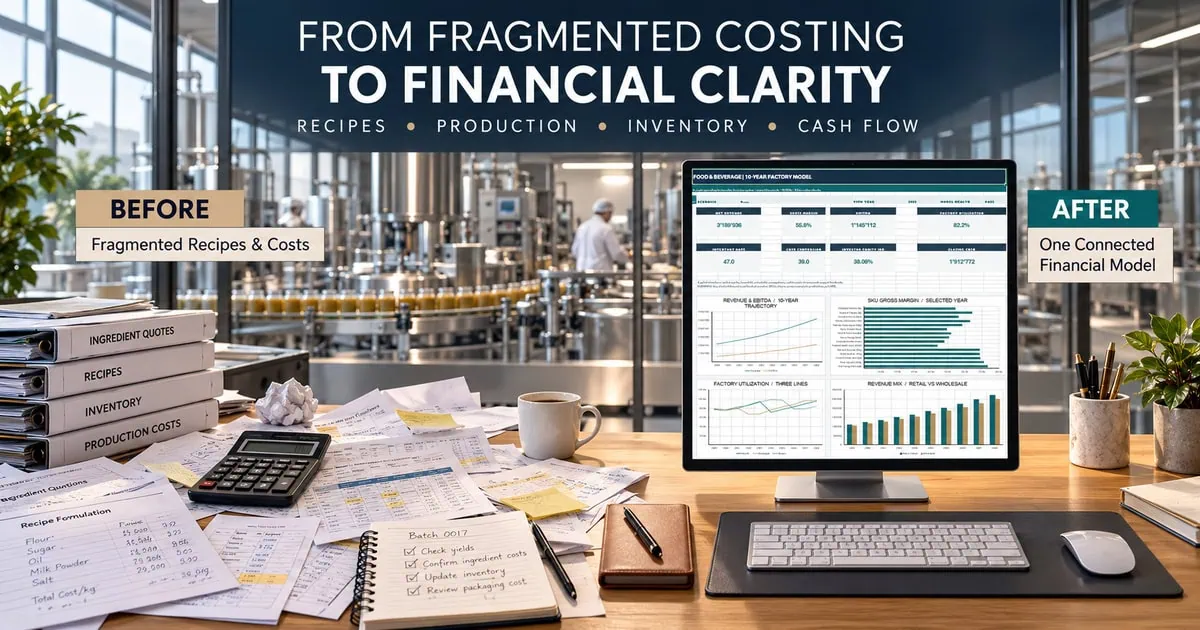
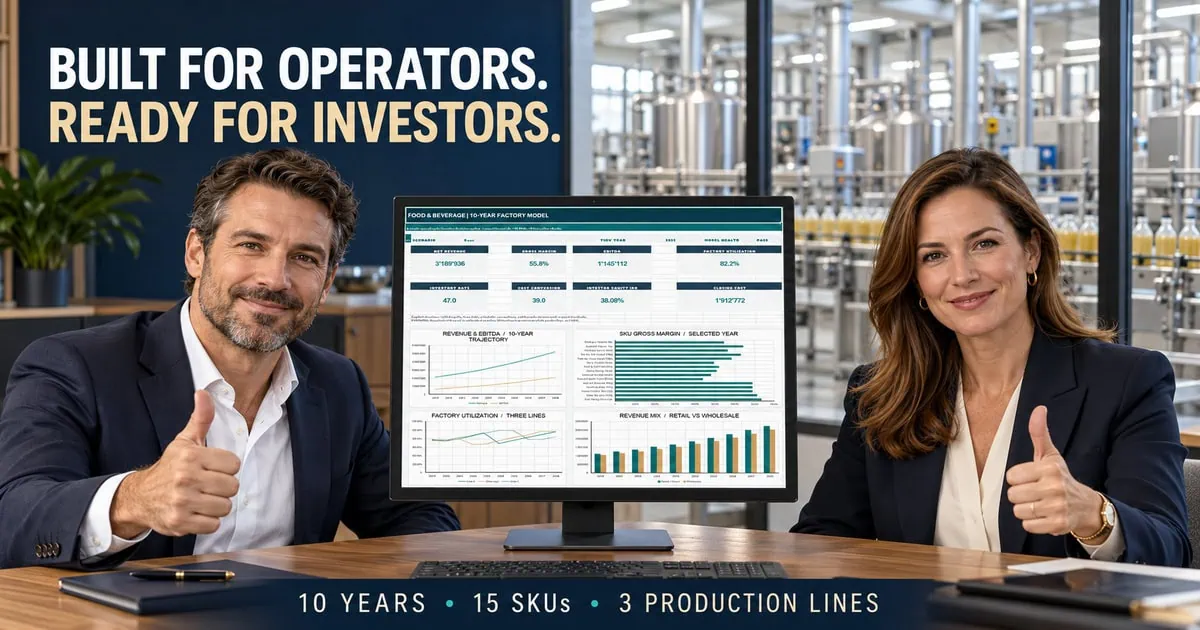
FOOD & BEVERAGE MANUFACTURING | 10-YEAR FINANCIAL MODEL
From Recipe Costing to Investor Returns
Plan a food or beverage manufacturing business through a connected, editable Excel system linking ingredient inputs, packaging costs, factory yield, constrained production lines, wholesale/direct channel pricing and inventory with financial statements and illustrative investor returns.
Designed for manufacturing founders, finance teams, product managers, operators and advisers seeking an assumption-driven view of factory economics. All initial businesses, prices and results are fictional illustrations rather than independently sourced market data.
📊 EXECUTIVE DASHBOARD & EIGHT NATIVE CHARTS
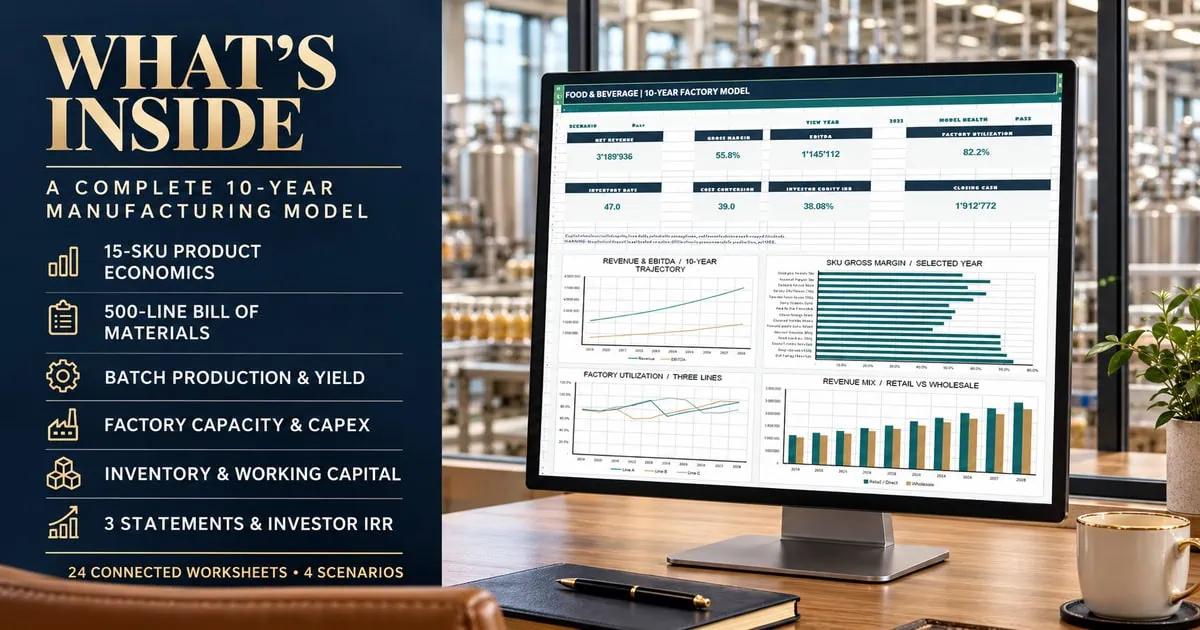
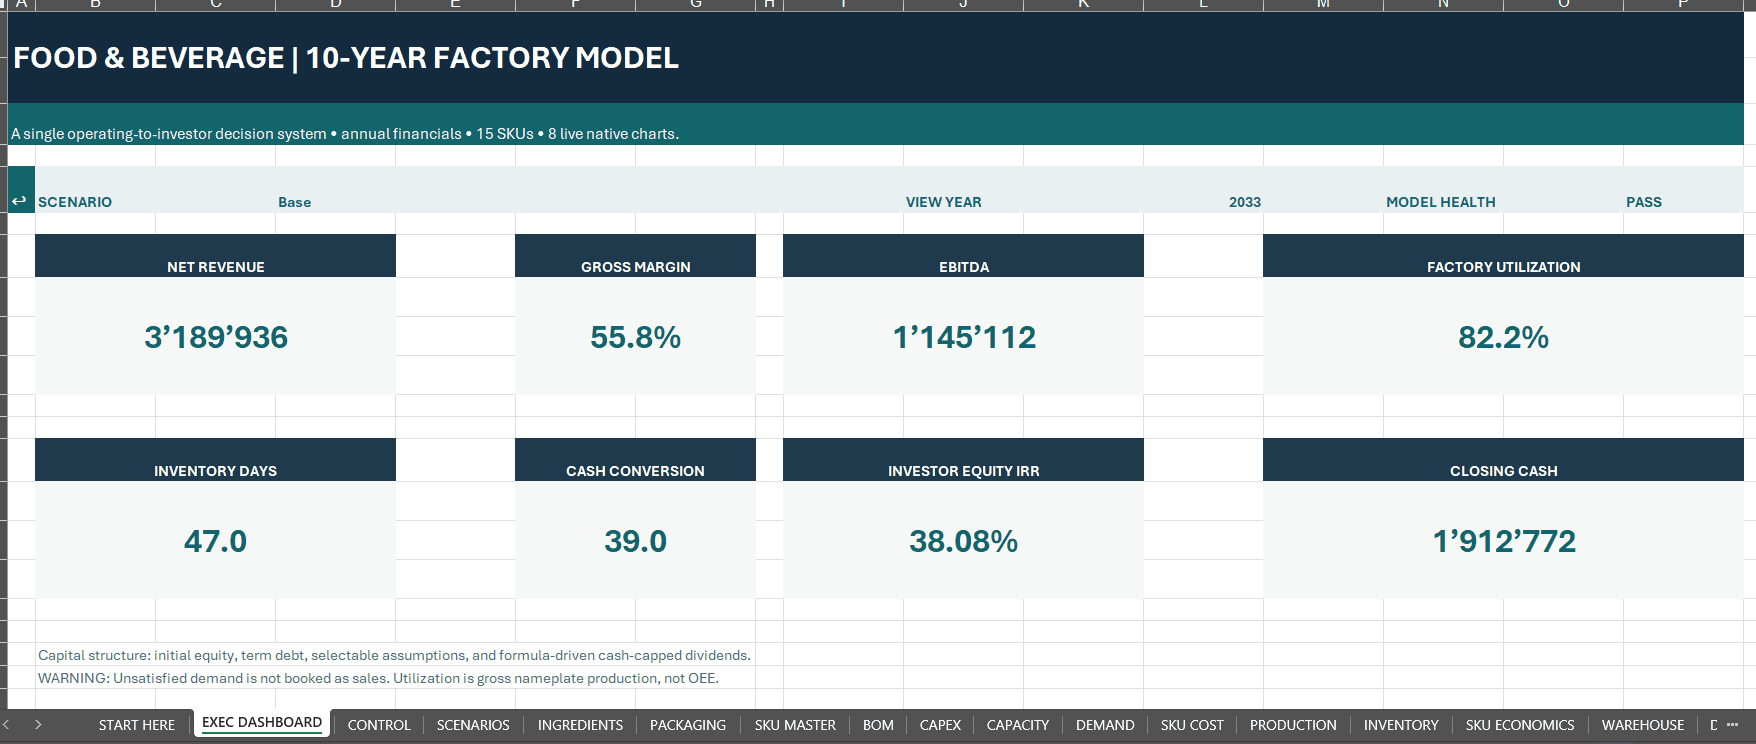
Eight prominently presented KPIs include net revenue, gross margin, EBITDA, factory capacity utilization, inventory days, cash conversion cycle, modeled equity IRR and closing cash.
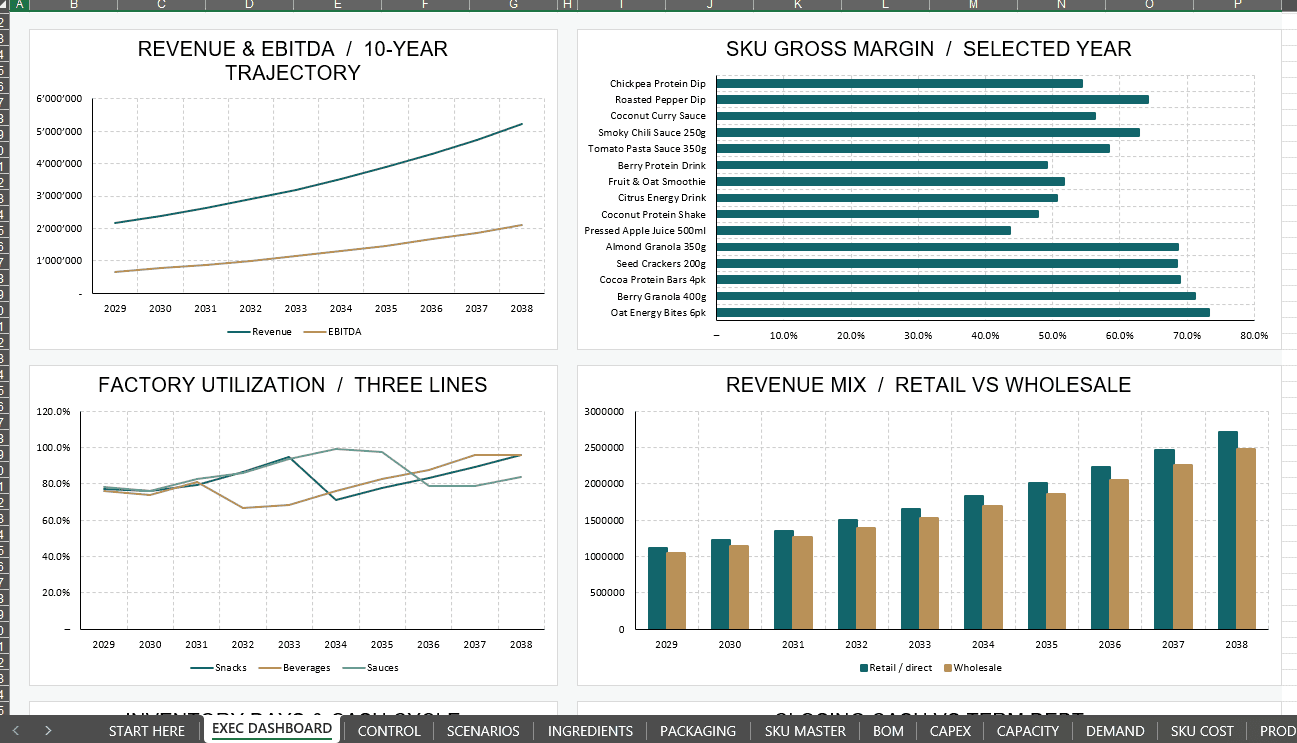
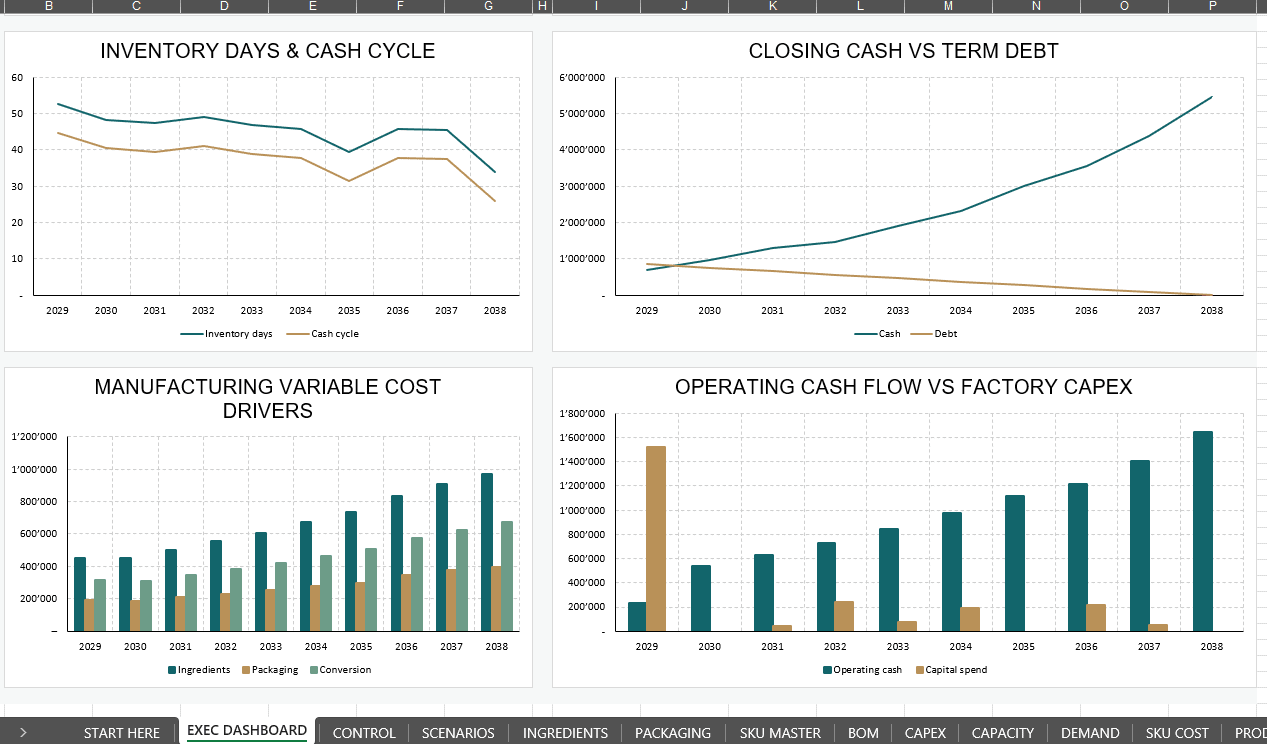
Eight native workbook charts show revenue versus EBITDA, 15-SKU margins for a selected forecast year, utilization of three production lines, retail/wholesale revenue mix, inventory days and cash cycle, closing cash versus debt, manufacturing cost drivers and operating cash versus factory CAPEX.
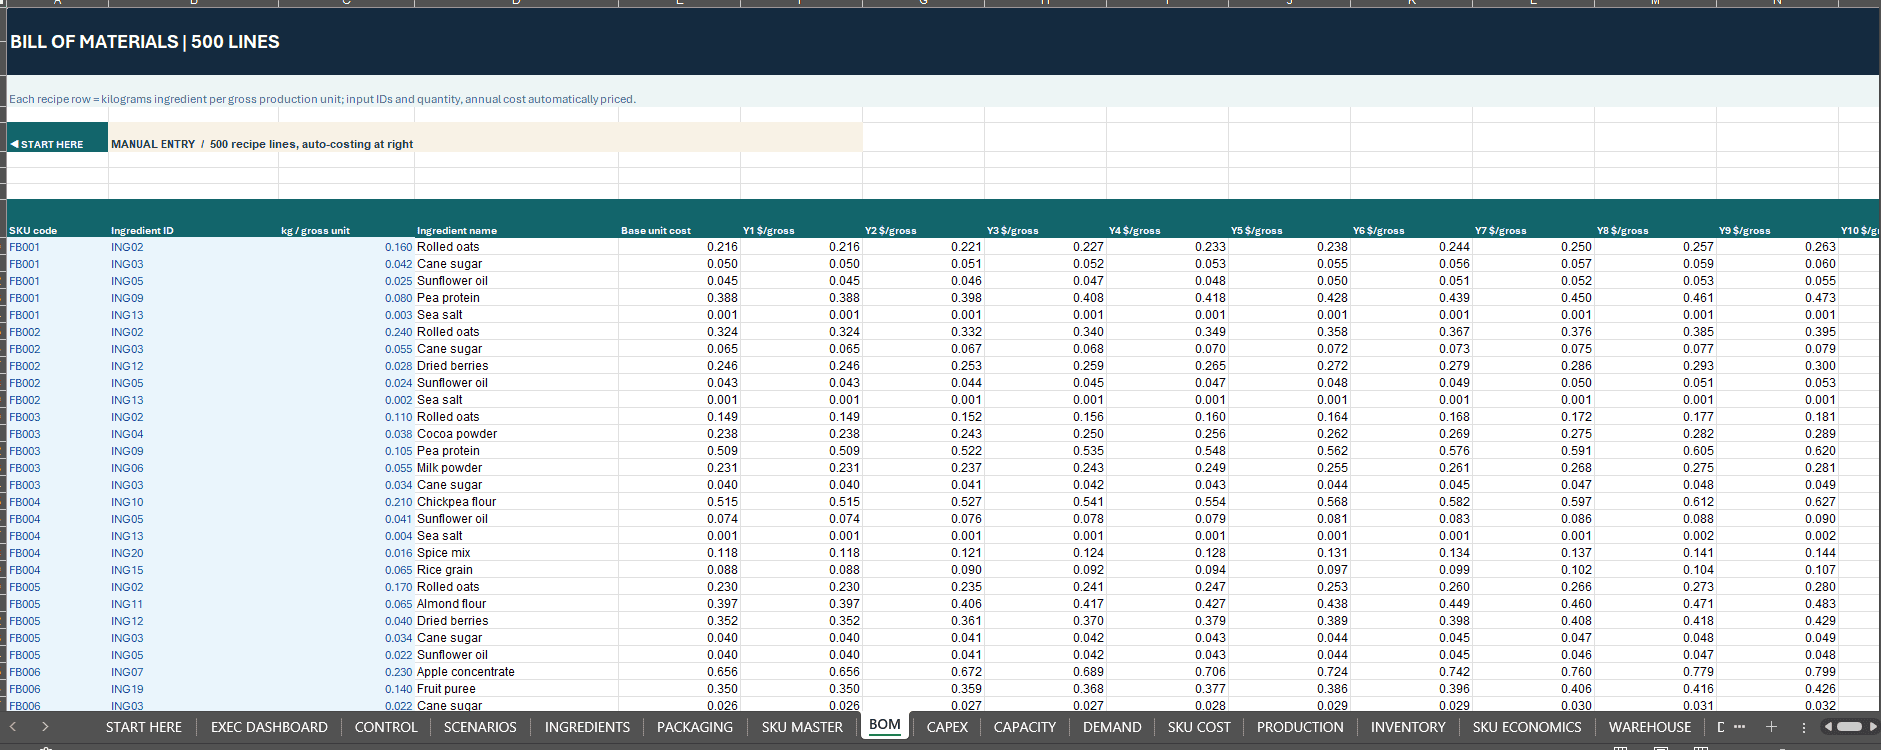
⚙️ 15 PRODUCT SKUs & 500-ROW BILL OF MATERIALS
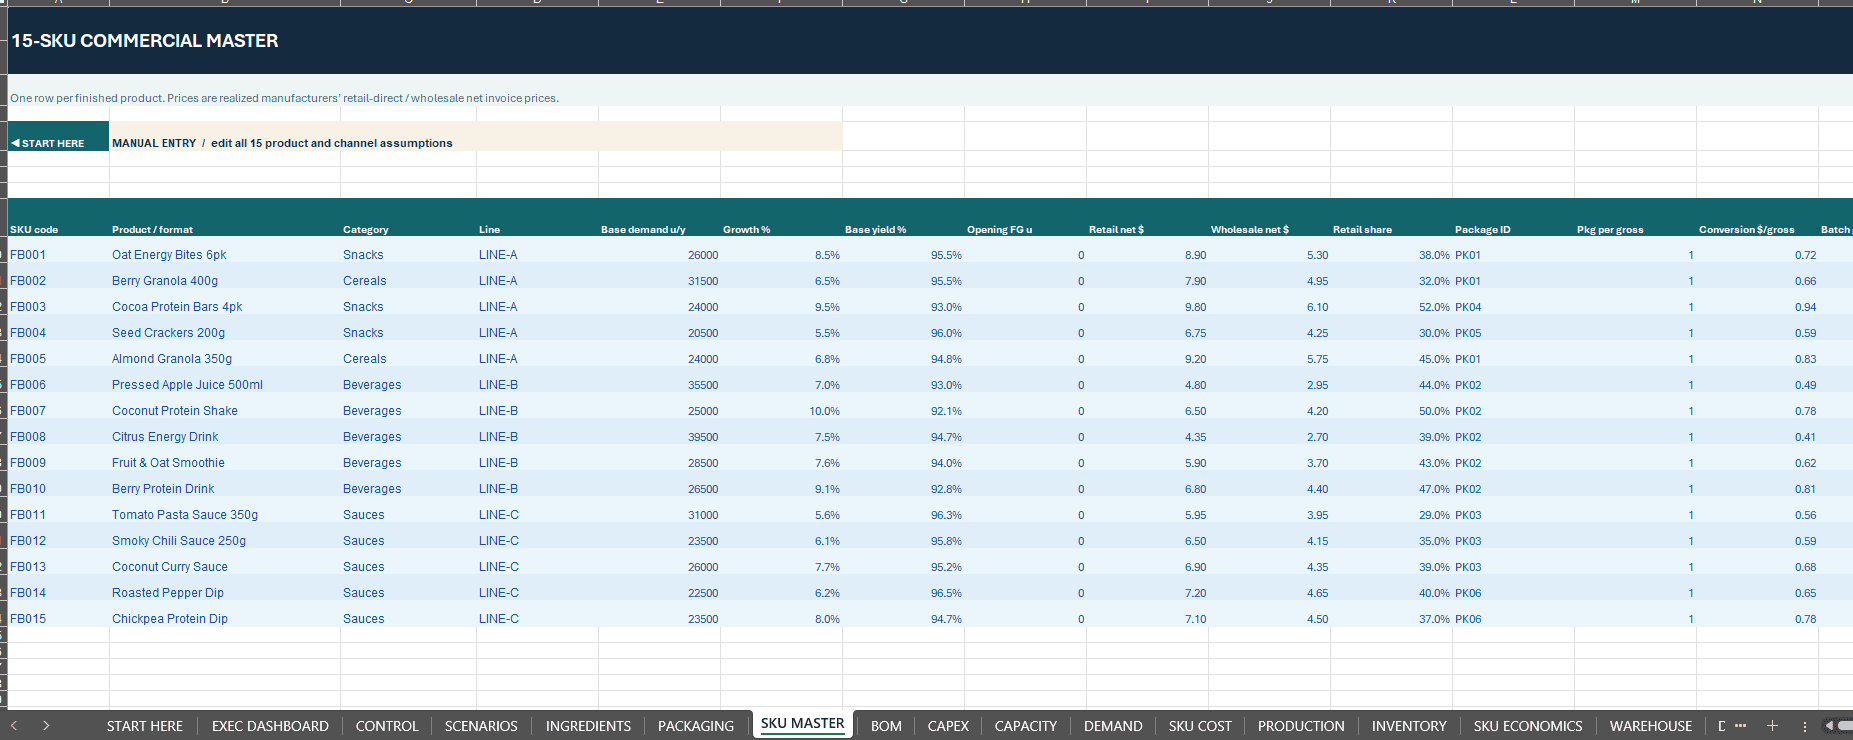
Fifteen fixed, prelinked product positions cover fictional snacks, beverages and sauces.
The prepared 500-row BOM lets you specify ingredient IDs and physical consumption quantities. Editable raw-material costs, packaging, per-unit conversion cost, manufacturing yield and product pricing determine annual variable cost per saleable unit and modeled SKU profitability.
Expanding the SKU universe beyond 15 requires rebuilding downstream formula ranges; BOM extension rows do not automatically add new SKUs.
🏭 PRODUCTION, BATCHES & CAPACITY
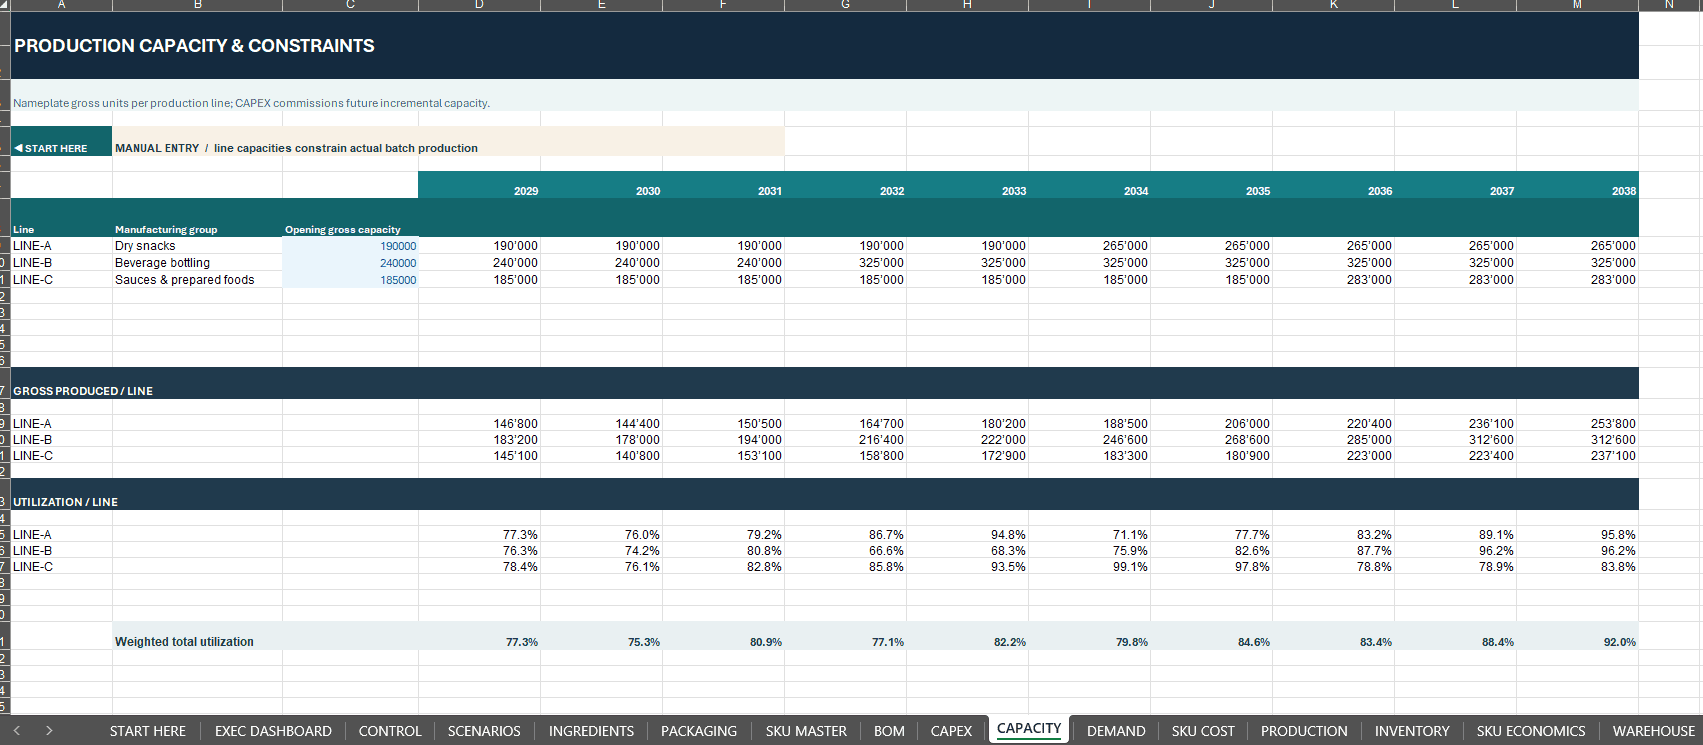
Three linked production lines with editable gross nameplate capacity and CAPEX-driven additions constrain realized output.
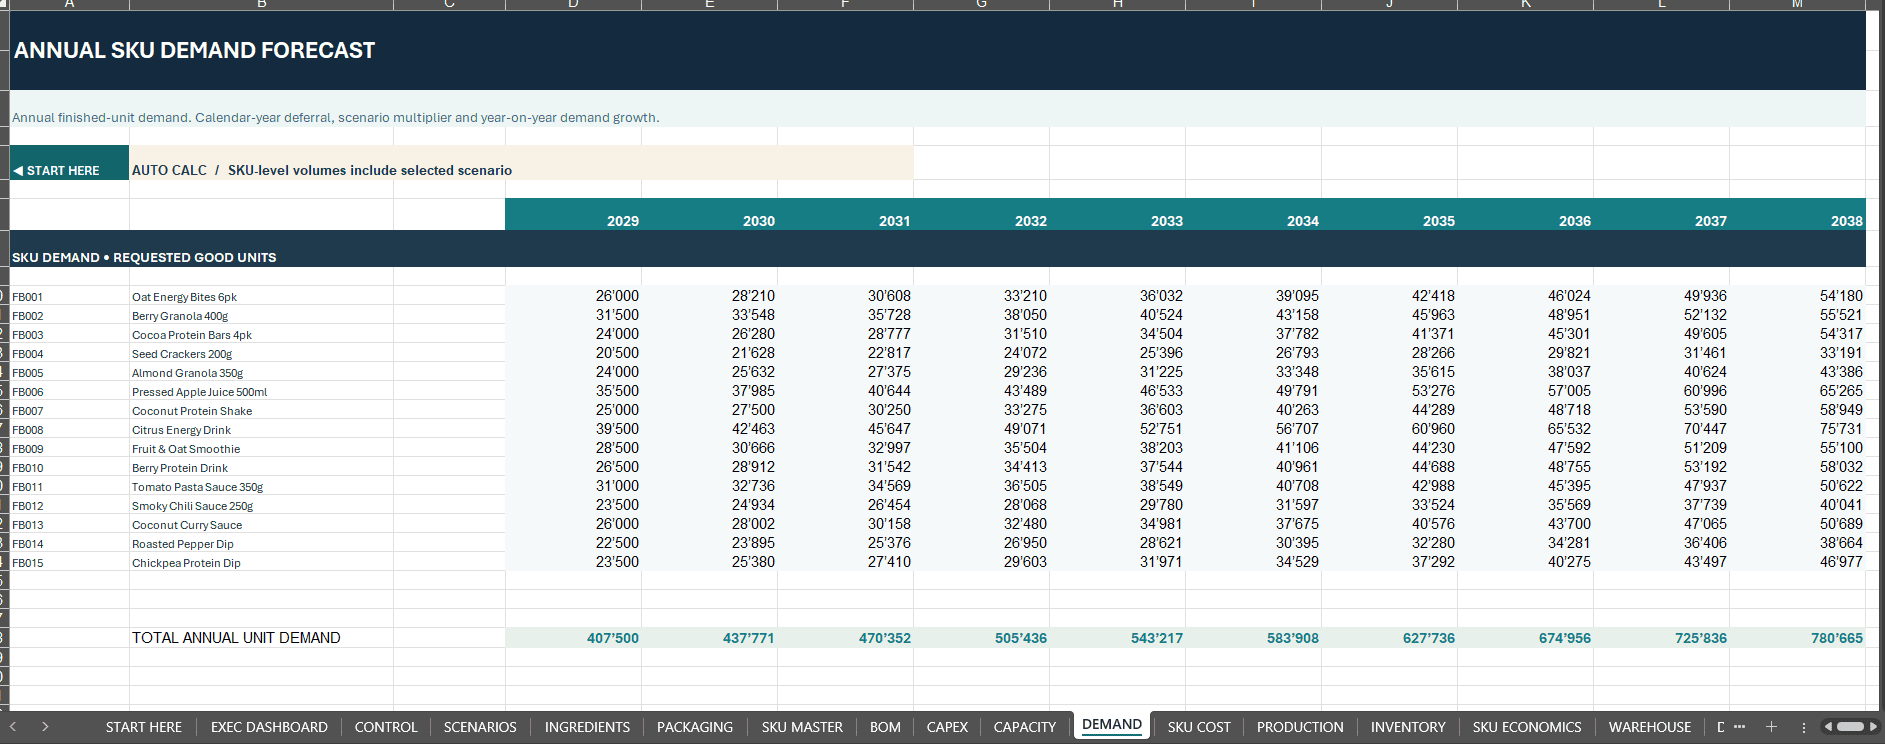
Manufacturing runs on annual whole-batch assumptions. Gross output multiplied by saleable yield determines usable product quantities; sales are restricted to actual shipments, so excess market demand is not falsely treated as recognized revenue.
Utilization is a nameplate-production ratio, not a detailed OEE or shift-scheduling calculation.
📦 WAREHOUSING, INVENTORY & WORKING CAPITAL
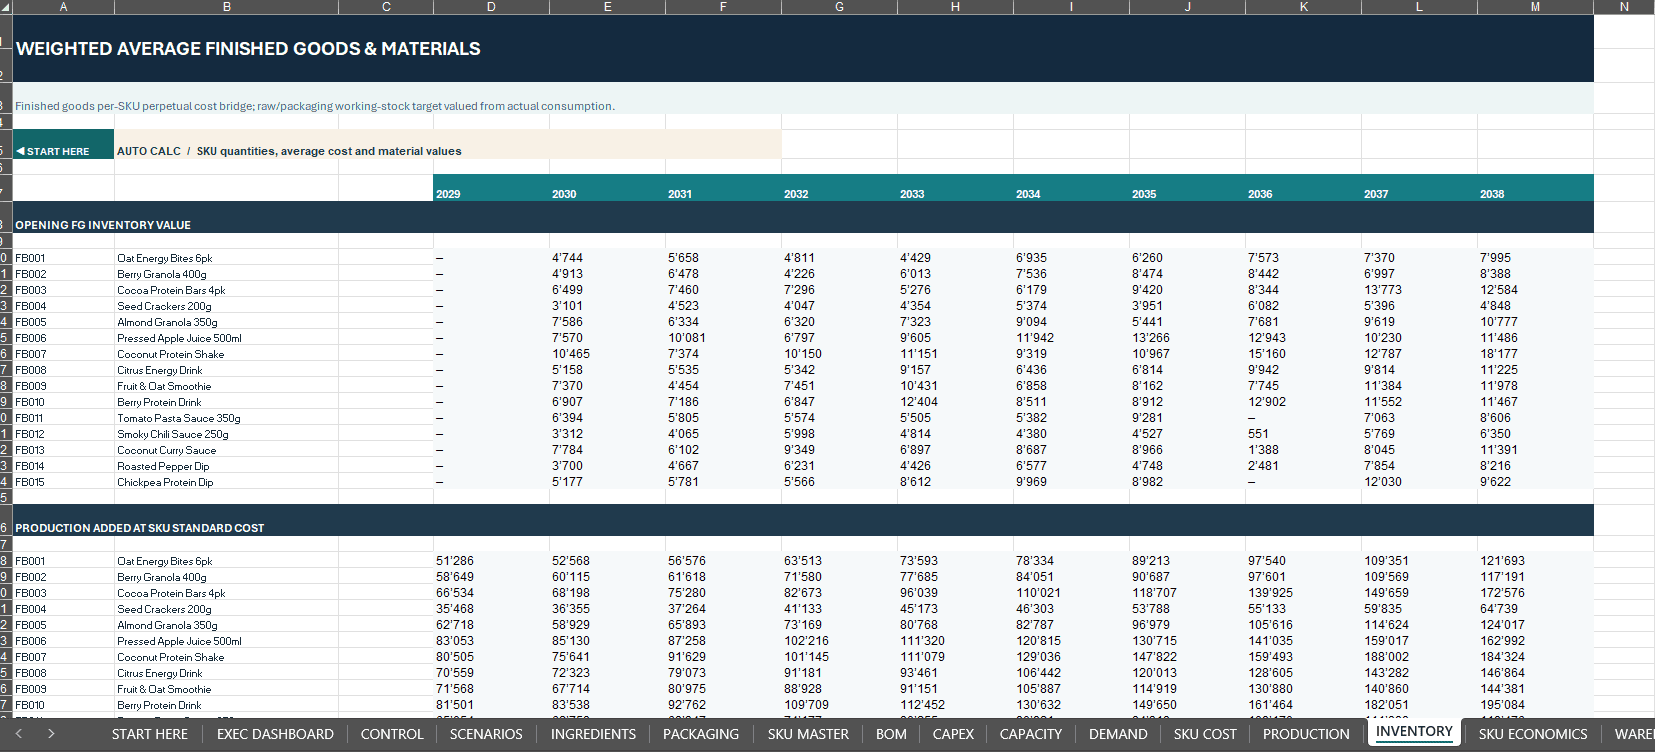
The workbook includes quantity and financial reconciliations for finished goods, annual weighted-average inventory costing, modeled raw/packaging stock requirements, distributor collections, vendor payments and logistics costs.
Analyze finished-goods inventory, manufacturing COGS, inventory days, receivables, payables and the cash conversion cycle.
It is not a detailed perishable expiry, SKU lot-tracing, food-safety or ERP platform.
📑 THREE CONNECTED FINANCIAL STATEMENTS
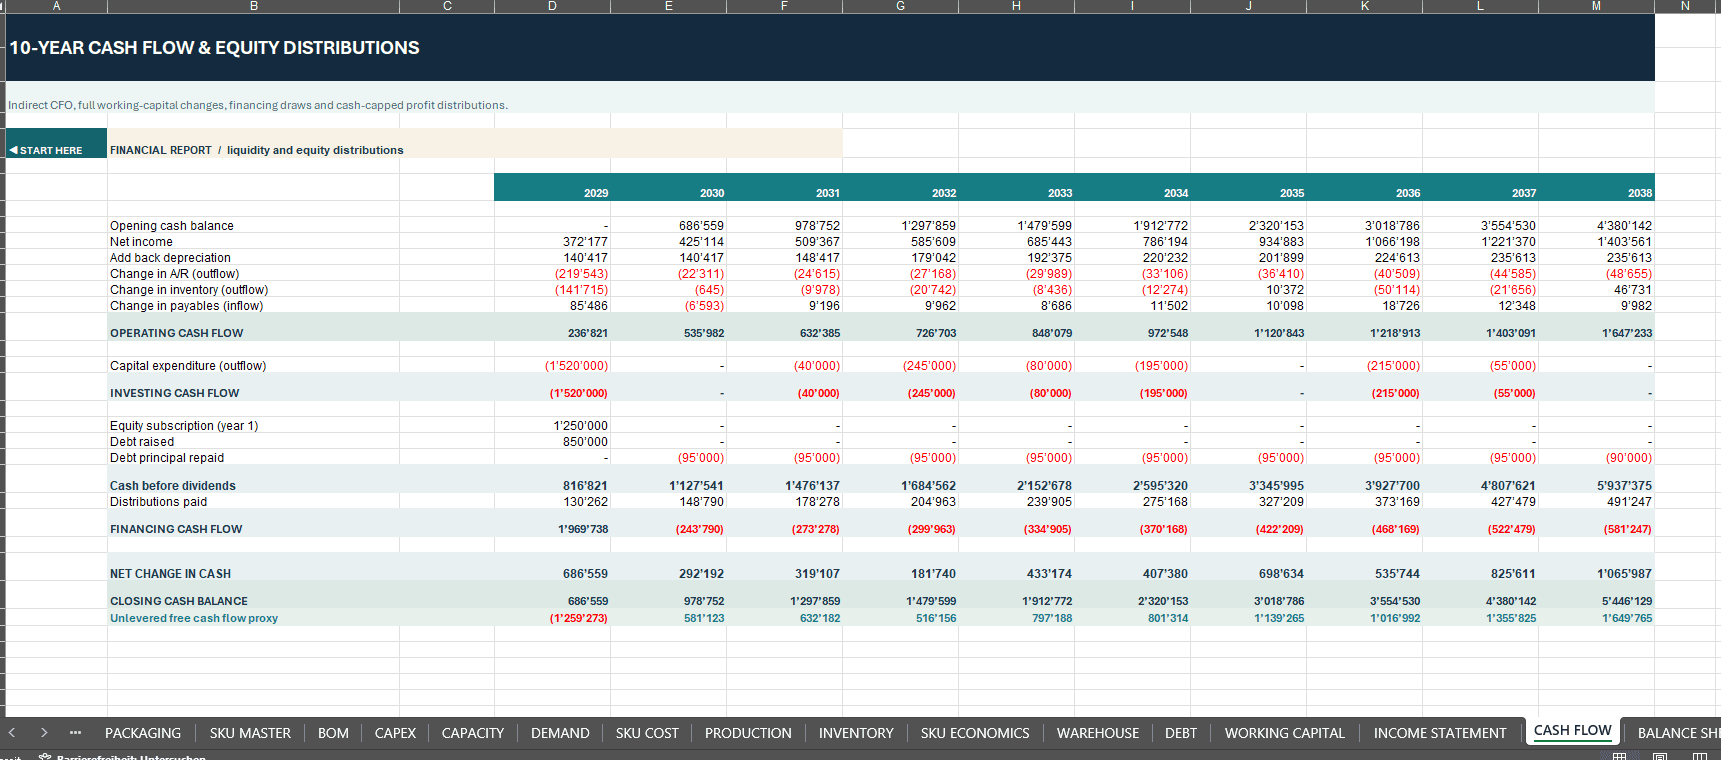
The ten-year Income Statement, Cash Flow Statement and Balance Sheet connect shipment revenue, manufacturing COGS, factory overhead, SG&A, marketing, capital investment, depreciation, debt, annual taxes, inventory and changes in net working capital.
Review EBITDA, operating cash flow, closing cash, balance-sheet reconciliation and financing needs.
🔀 FOUR LIVE SCENARIOS
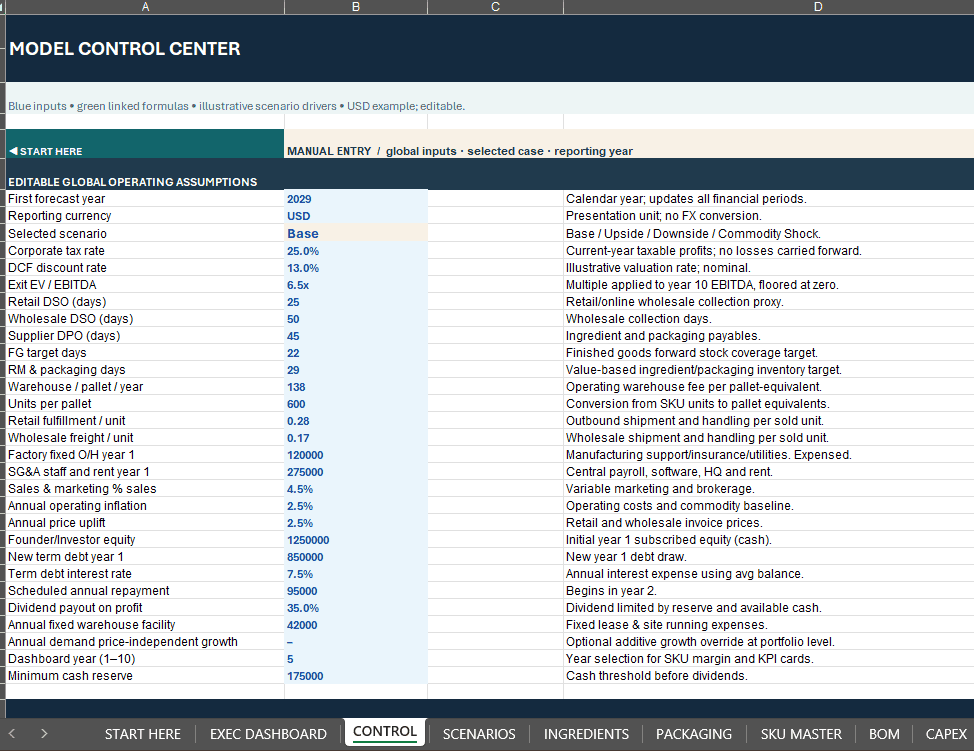
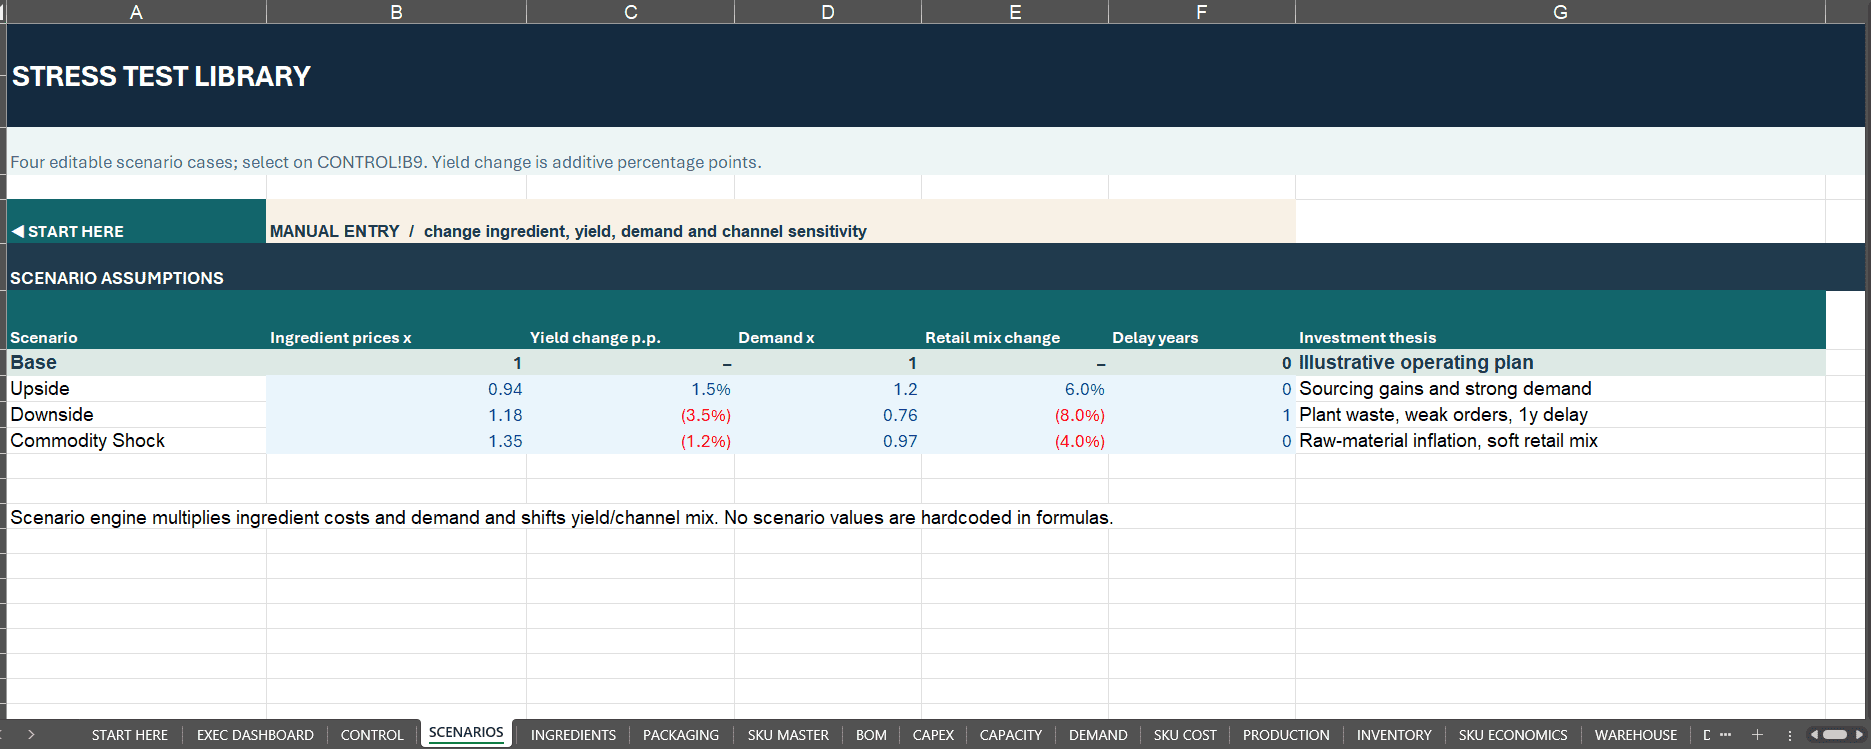
Select Base, Upside, Downside or Commodity Shock.
Scenario inputs adjust ingredient inflation, effective production yield, demand, direct-retail channel weighting and launch timing. Each case recalculates the integrated model. One scenario is active at a time.
The fictional Upside case can encounter additional unmet production demand as capacity becomes constrained. The Downside case includes a launch delay, first-year EBITDA loss and a temporarily negative year-end cash balance.
These are important economic warnings, not automatically corrected funding gaps.
📈 INVESTOR RETURNS & YEAR-10 EXIT
The VALUATION worksheet estimates investor equity IRR, MOIC and equity NPV from the initial investor contribution, modeled annual cash distributions and a hypothetical year-10 exit.
Terminal enterprise value uses an editable EBITDA multiple; net exit equity proceeds incorporate closing debt and cash.
The selected exit multiple is not independently benchmarked to real transactions.
✅ MODEL INTEGRITY & PRODUCTION WARNINGS
The MODEL CHECKS sheet reports financial-statement, debt, PP&E, manufactured-volume, inventory, SKU revenue and unit-cost reconciliations across ten years.
Economic WATCH flags separately identify unmet demand, insufficient cash buffers, negative EBITDA and elevated inventory days.
PASS means specified relationships reconcile; it does not certify profitability, real factory feasibility or lender approval.
📦 WHAT YOU RECEIVE
1 editable Excel financial model (.xlsx) containing 24 connected worksheets:
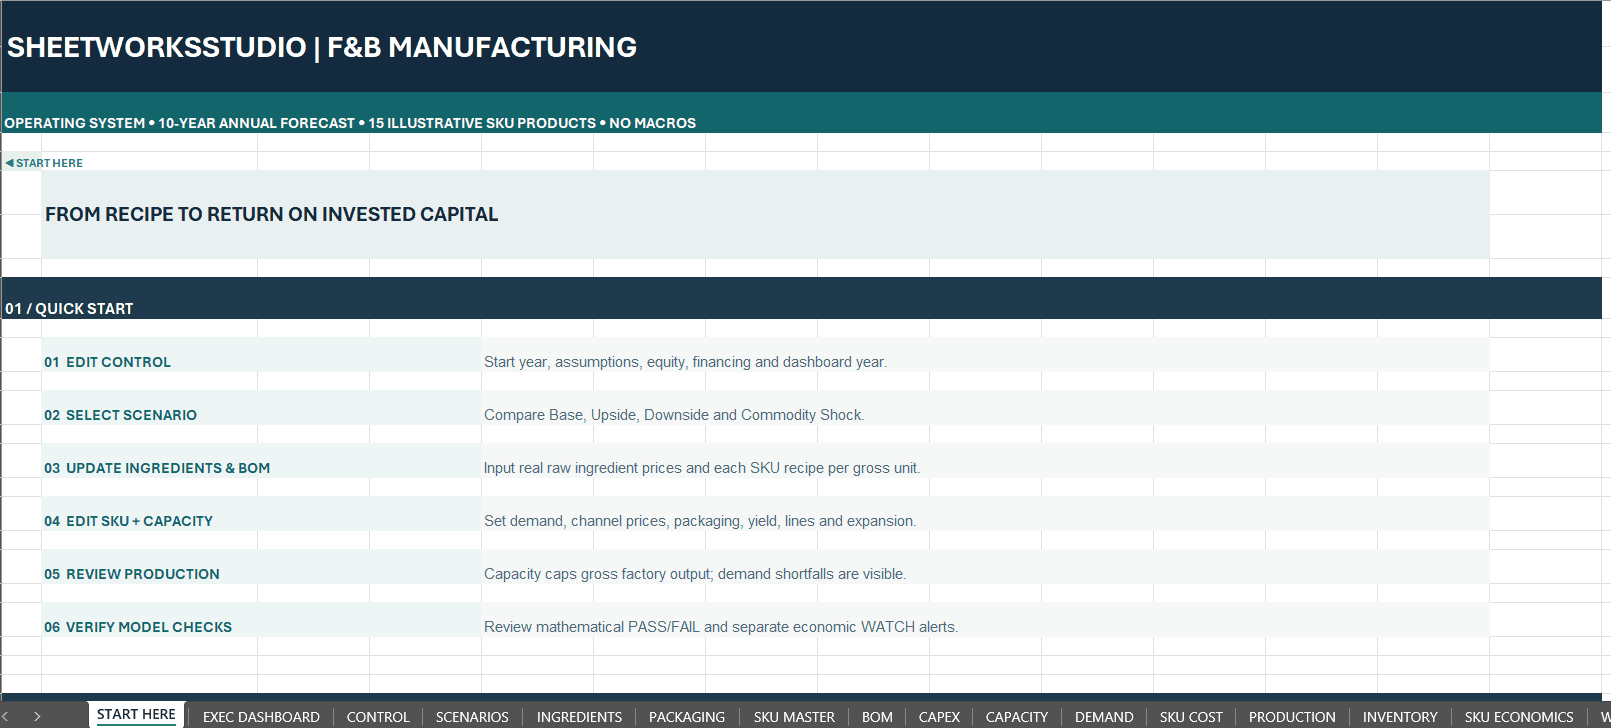
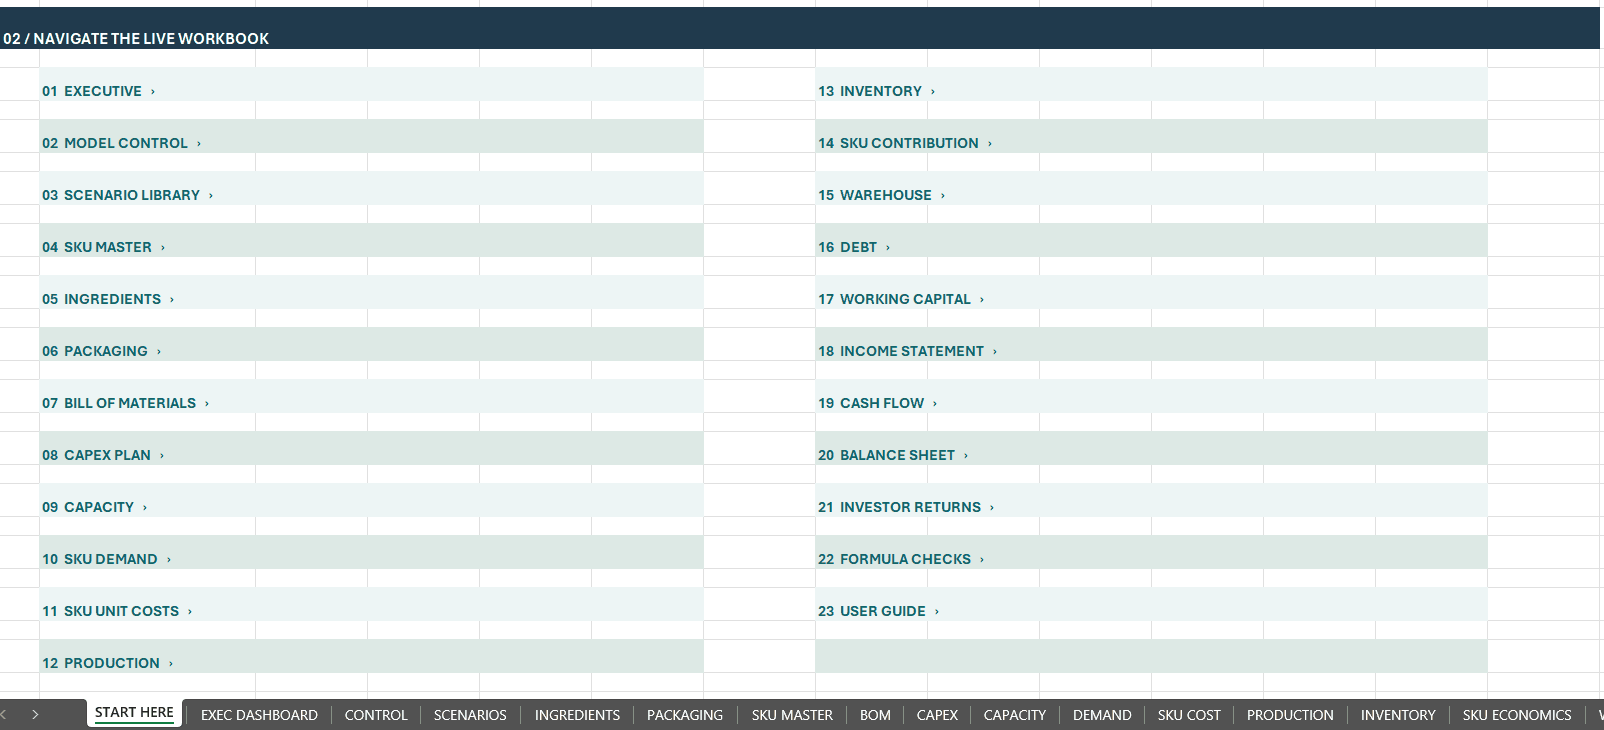
START HERE; EXEC DASHBOARD; CONTROL; SCENARIOS; INGREDIENTS; PACKAGING; SKU MASTER; BOM; CAPEX; CAPACITY; DEMAND; SKU COST; PRODUCTION; INVENTORY; SKU ECONOMICS; WAREHOUSE; DEBT; WORKING CAPITAL; INCOME STATEMENT; CASH FLOW; BALANCE SHEET; VALUATION; MODEL CHECKS; USER GUIDE.
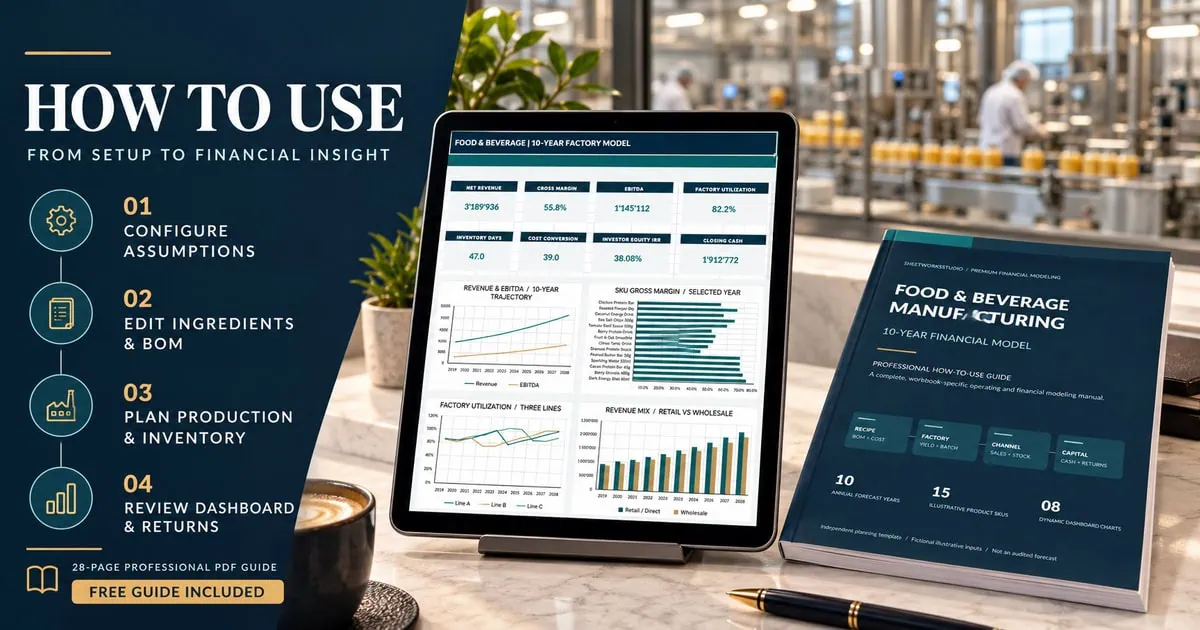
1 Professional 28-page English How-to-Use PDF Guide, covering setup, input ranges, recipe costing, units and yield, factory capacity, inventory, distribution, financing, investor valuation, eight native charts, validation and troubleshooting.
The guide is also separately available free of charge without the editable Excel workbook.
🧭 GETTING STARTED
Save a working copy. Enter the forecast start year, reporting currency label, scenario, costs, financing and sales terms in CONTROL.
Configure supplier pricing and recipe lines in INGREDIENTS, PACKAGING and BOM, then customize the 15 SKU positions.
Review CAPACITY and CAPEX, trace the operating and inventory schedules, and finish with all three financial statements, MODEL CHECKS and VALUATION.
⚙️ TECHNICAL SCOPE & COMPATIBILITY
The forecast contains ten annual periods, with a fictional sample timeline of 2029–2038. It is not a 120-month model.
The workbook is supplied in .xlsx format without macros, VBA, external workbook data feeds or live APIs.
Current Excel Desktop is recommended. An actual Microsoft Excel Desktop open/recalculate/save test and a live Google Sheets import have not been completed; buyers should review charts, formulas and formatting in their spreadsheet environment.
The editable currency label does not convert monetary figures.
🛡️ IMPORTANT DISCLAIMER
This is an independent, unofficial financial-planning and educational spreadsheet by SheetworksStudio. All data is illustrative.
This is not an audited, bank-approved, regulator-certified or guaranteed financial or engineering forecast and is not legal, accounting, tax, investment or food-safety advice.
Professional review of business-specific inputs, financing, accounting policy and applicable requirements remains essential.
This is a digital product; no physical item is supplied.
Explore how recipe costs, production decisions, inventory and financing jointly shape a manufacturing company’s projected economics.
Similar ProductsOther customers were also interested in...


 eFinancialModels
Electric Vehicle (EV) Charging Station Financial M...
With this comprehensive 5- or 10-year monthly tool, investors can assess the viability of setting up... Read more

Financial Model for Mobile App | Mobile App Busine...
The Mobile App Financial Plan Template in Excel allows you to develop financial projections when lau... Read more

 HenrySheykin
Food Truck Financial Model Excel Template
The Food Truck Financial Model helps entrepreneurs, founders, business owners, consultants, and anal... Read more

Green Hydrogen Production from Wind Energy Financi...
The Green Hydrogen from Wind Financial Model aims to comprehensively forecast a horizon of 40 years ... Read more

Simple Mutual Non-Disclosure Agreement Template
Protect your business secrets with ease using our Simple Mutual Non-Disclosure Agreement Template. S... Read more

Solar Energy Financial Model
The Solar Energy Financial Model Spreadsheet Template in Excel assists you in preparing a sophistica... Read more
 Peter Graf
The Customer-Centric Financial Model for Restauran...
Starting a restaurant without a financial plan is like driving a car blindfolded. You wouldn´t do i... Read more
You must log in to submit a review.