
0 ITEMS

Fintech Lending Financial Model Excel – 60-Month Forecast, Credit Risk, Warehouse Funding & 3 Statements
An integrated 60-month Excel financial model for balance-sheet lending businesses with 15 editable credit segments, simplified loan amortization, defaults and recoveries, expected credit allowances, warehouse funding, liquidity monitoring and three linked financial statements. Includes five operating scenarios, eight native dashboard charts, 16 worksheets and a 38-page English PDF guide.

FINTECH LENDING FINANCIAL MODEL – 60-MONTH SIGNATURE EDITION
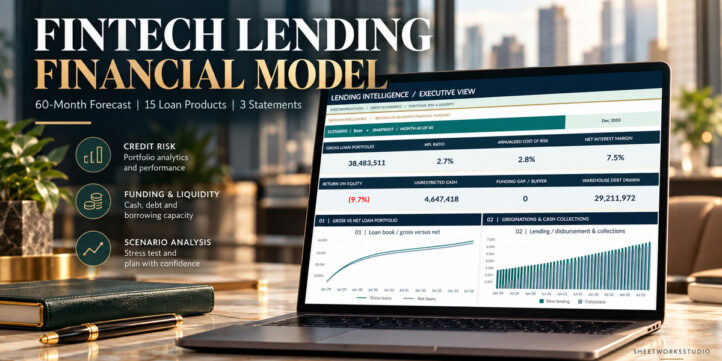
From Loan Origination and Credit Risk to Warehouse Funding, Liquidity and Financial Statements — One Connected Excel Financial Model.
The Fintech Lending Financial Model by SheetworksStudio is an integrated, fully editable Excel planning system for balance-sheet lending businesses.
Built around a 60-month financial forecast, the model connects 15 configurable lending segments, borrower pricing, principal repayments, credit losses, warehouse financing, operating expenses and three financial statements.
Designed for fintech founders, lending-business operators, CFOs, financial analysts and consultants who want to understand the relationships between lending growth, portfolio credit quality, capital requirements and projected liquidity.
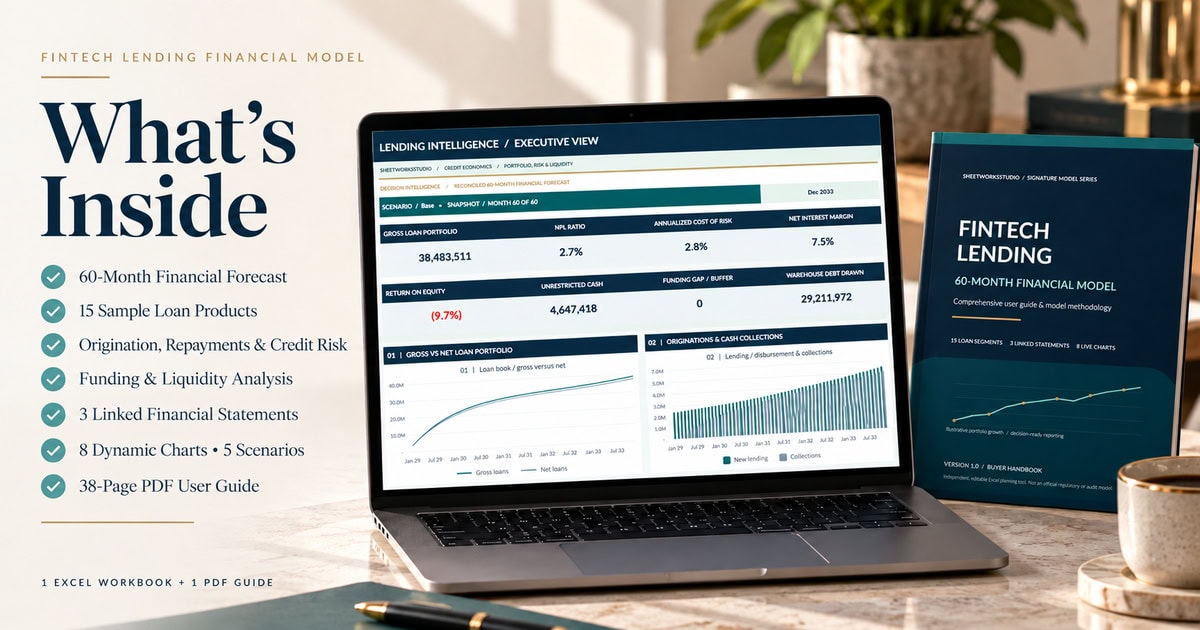
The package contains 16 interconnected worksheets, five operating scenarios, eight native dashboard charts and a detailed 38-page English PDF user guide.
📊 1. EXECUTIVE DASHBOARD & CREDIT PERFORMANCE
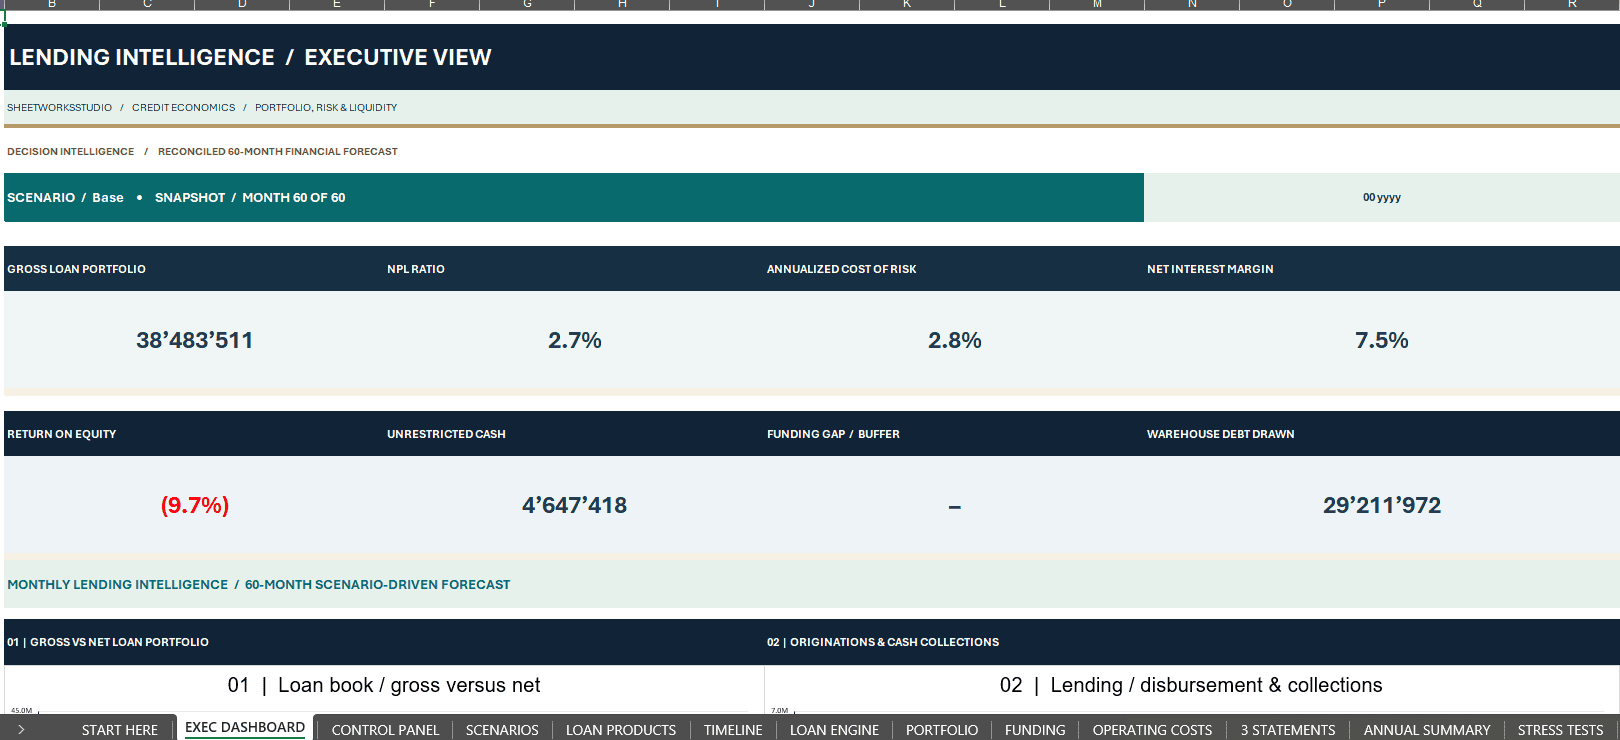
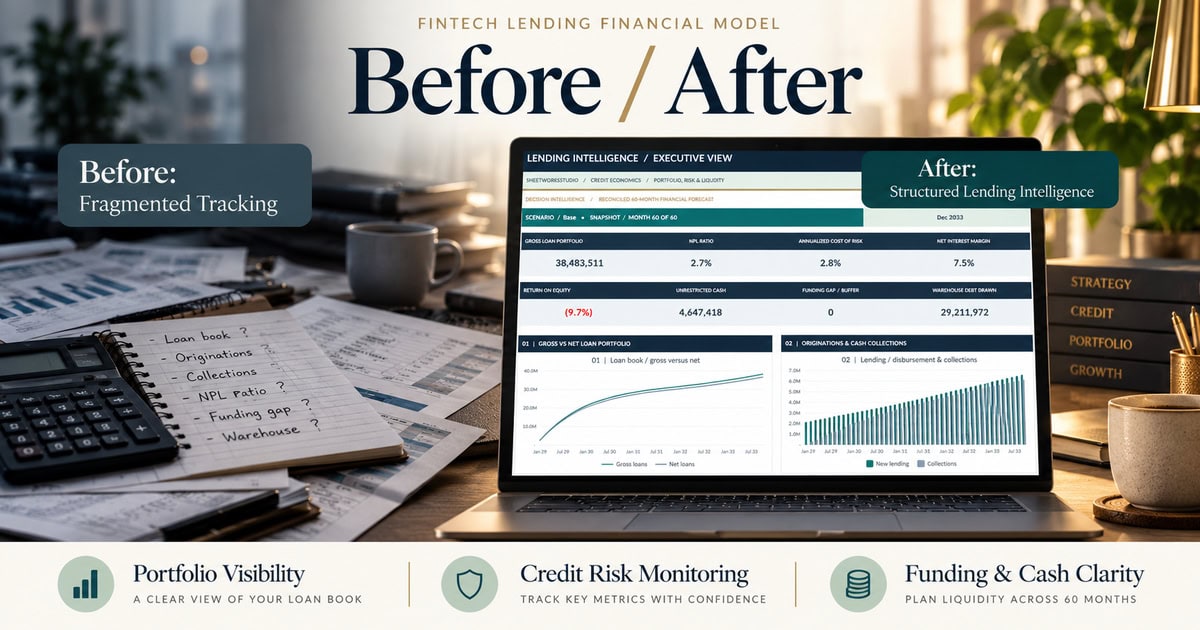
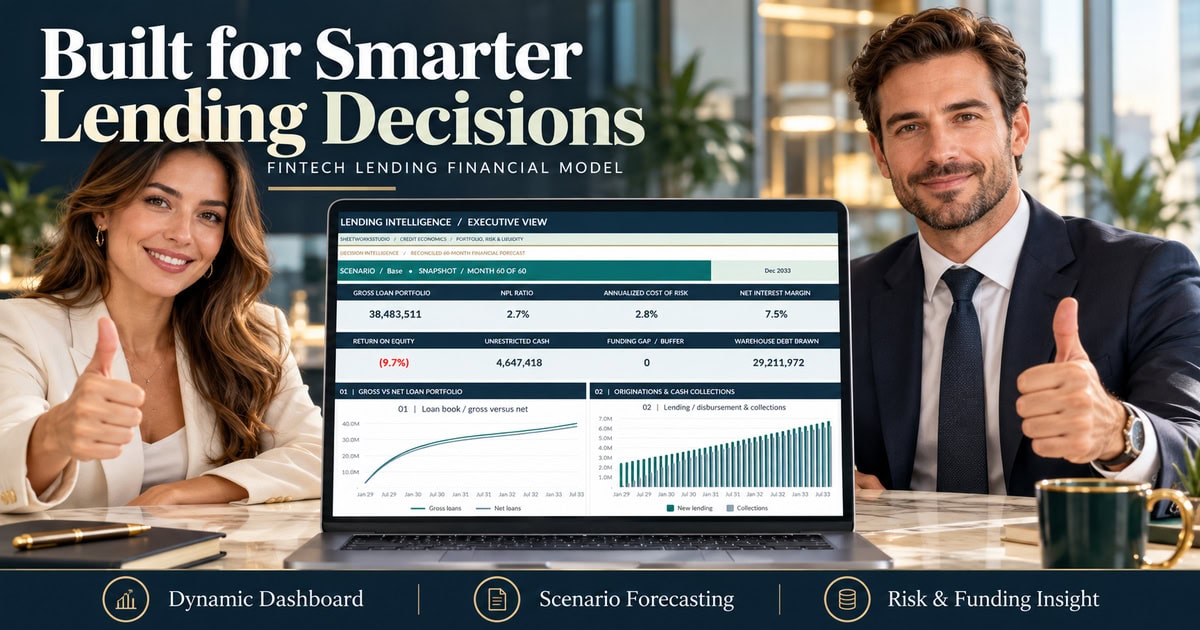
Review lending activity, credit quality, funding and profitability through a professional Executive Dashboard.
Key Performance Indicators:
✓ Gross Loan Portfolio
✓ Non-Performing Loan Ratio (NPL)
✓ Annualized Cost of Risk
✓ Net Interest Margin (NIM)
✓ Return on Equity (ROE)
✓ Unrestricted Cash
✓ Liquidity Funding Gap
✓ Warehouse Debt Drawn
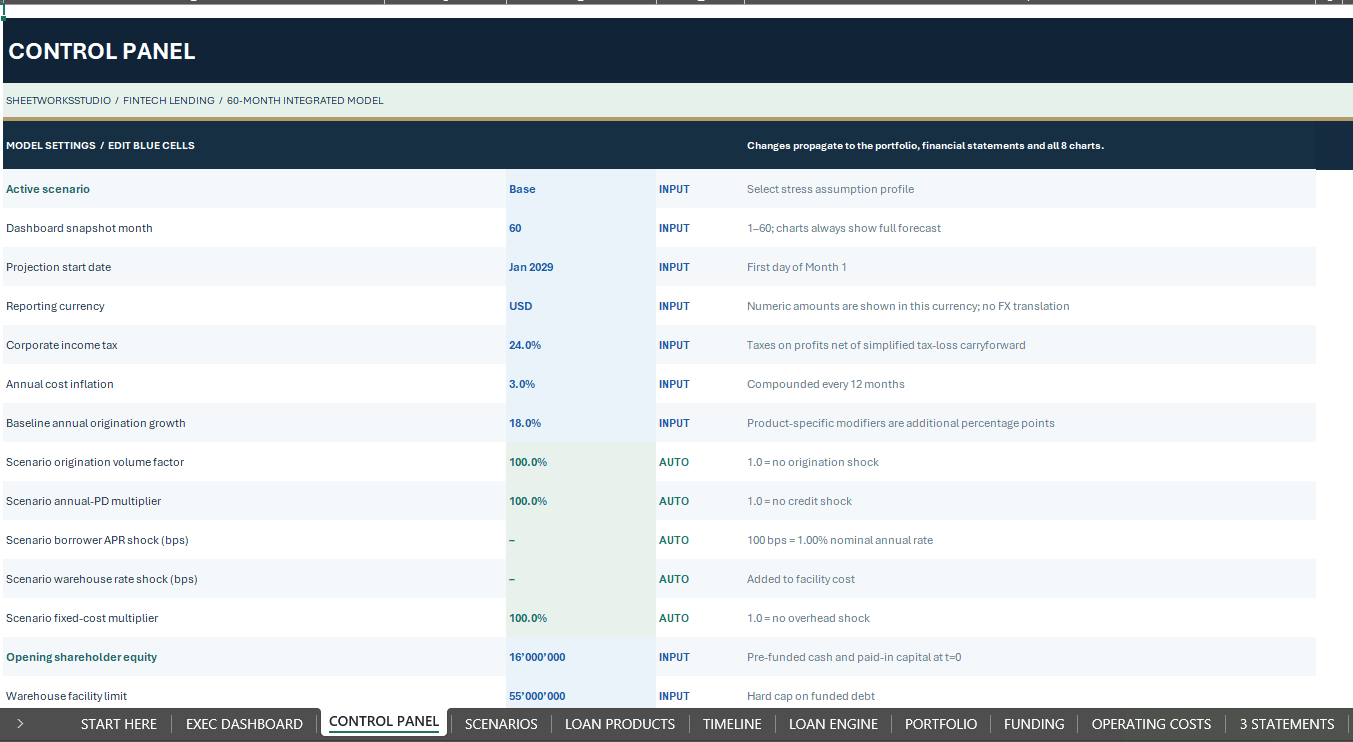
Choose any month from 1 to 60 for the dashboard KPI snapshot.
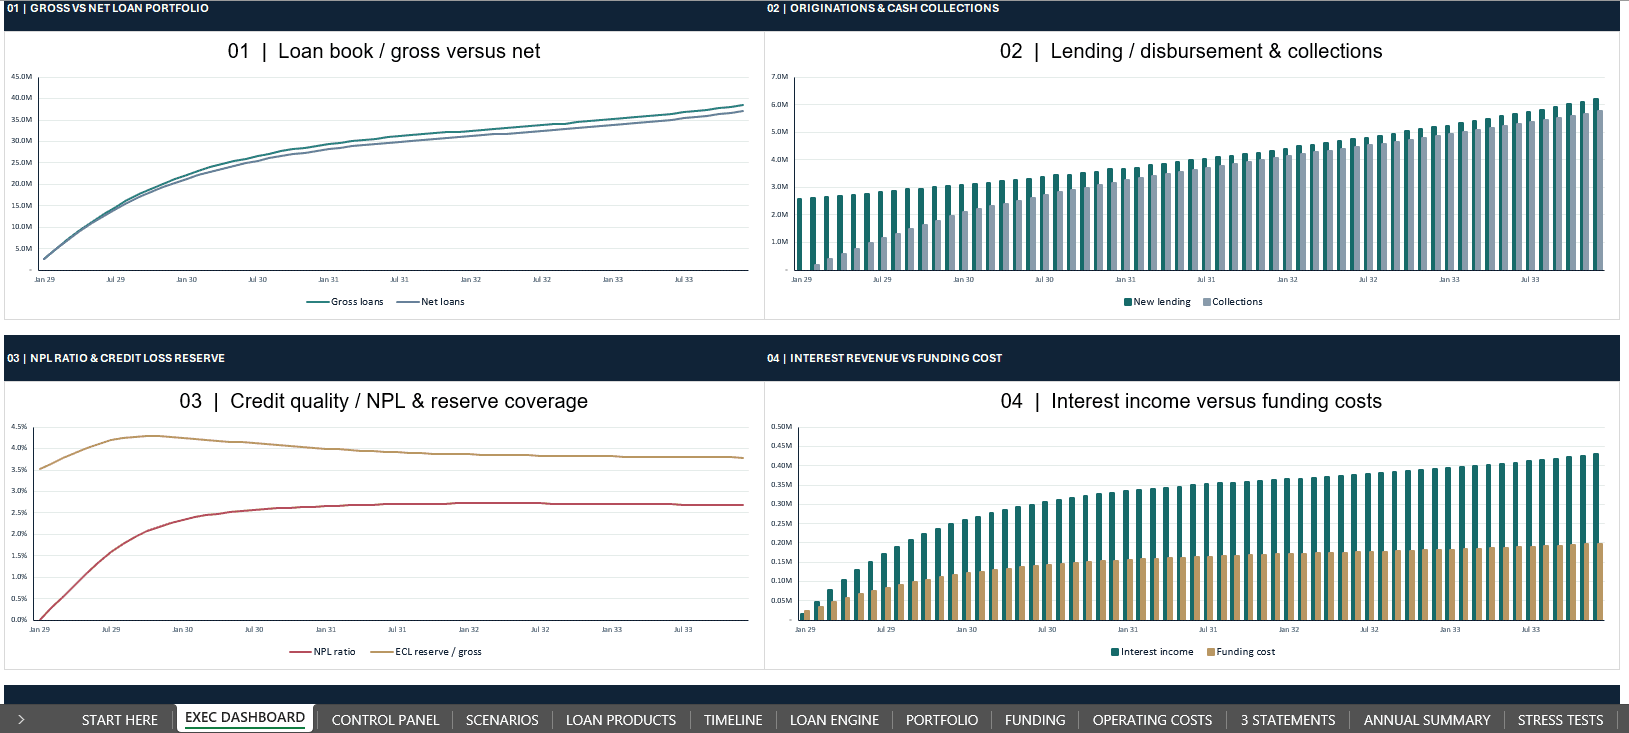
Eight native, data-linked charts visualize:
✓ Gross vs. Net Loan Portfolio
✓ Loan Originations vs. Principal Collections
✓ NPL Ratio vs. Credit Allowance Ratio
✓ Interest Income vs. Funding Costs
✓ Net Interest Margin vs. Return on Equity
✓ Cash Balances vs. Funding Gaps
✓ Net Income vs. Credit Loss Provisions
✓ Warehouse Facility Utilization & Headroom
The charts follow the connected 60-month forecast, allowing users to explore lending growth and financial performance across the full projection period.
▦ 2. LOAN ORIGINATION & 15 LENDING SEGMENTS
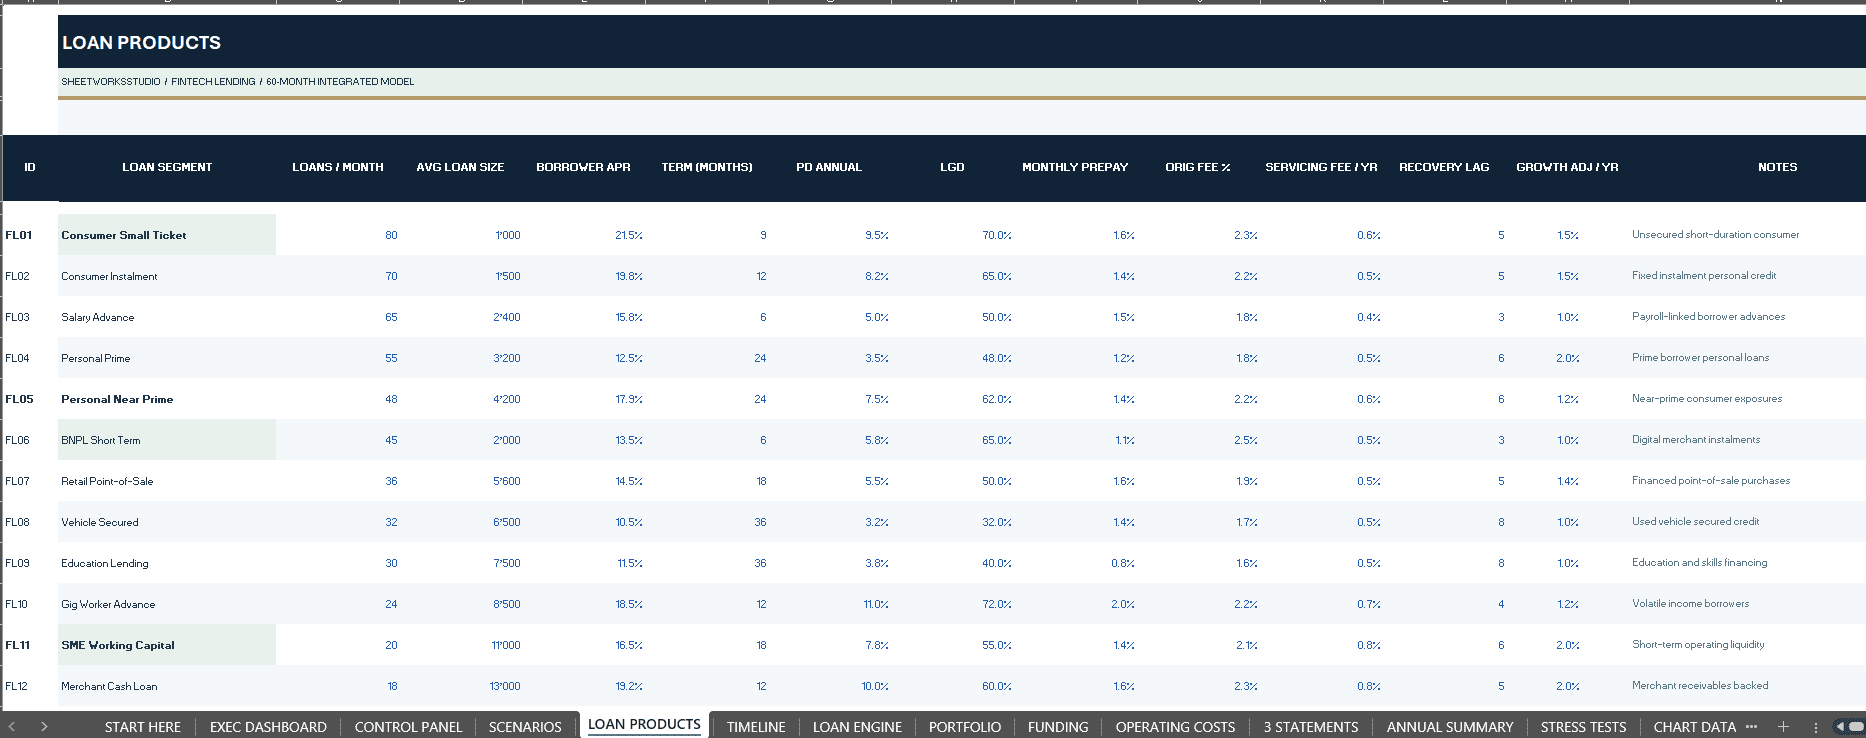
Configure 15 illustrative loan product segments covering consumer lending, salary advances, personal loans, BNPL, point-of-sale financing, education finance, vehicle lending and SME lending.
Editable Input Assumptions:
✓ New Loans per Month
✓ Average Loan Size
✓ Nominal Annual Borrower Interest Rate
✓ Loan Repayment Term
✓ Annual Probability of Default
✓ Loss Given Default
✓ Voluntary Prepayment Rates
✓ Origination Fees
✓ Servicing Fees
✓ Recovery Timing
✓ Annual Origination Growth Adjustments
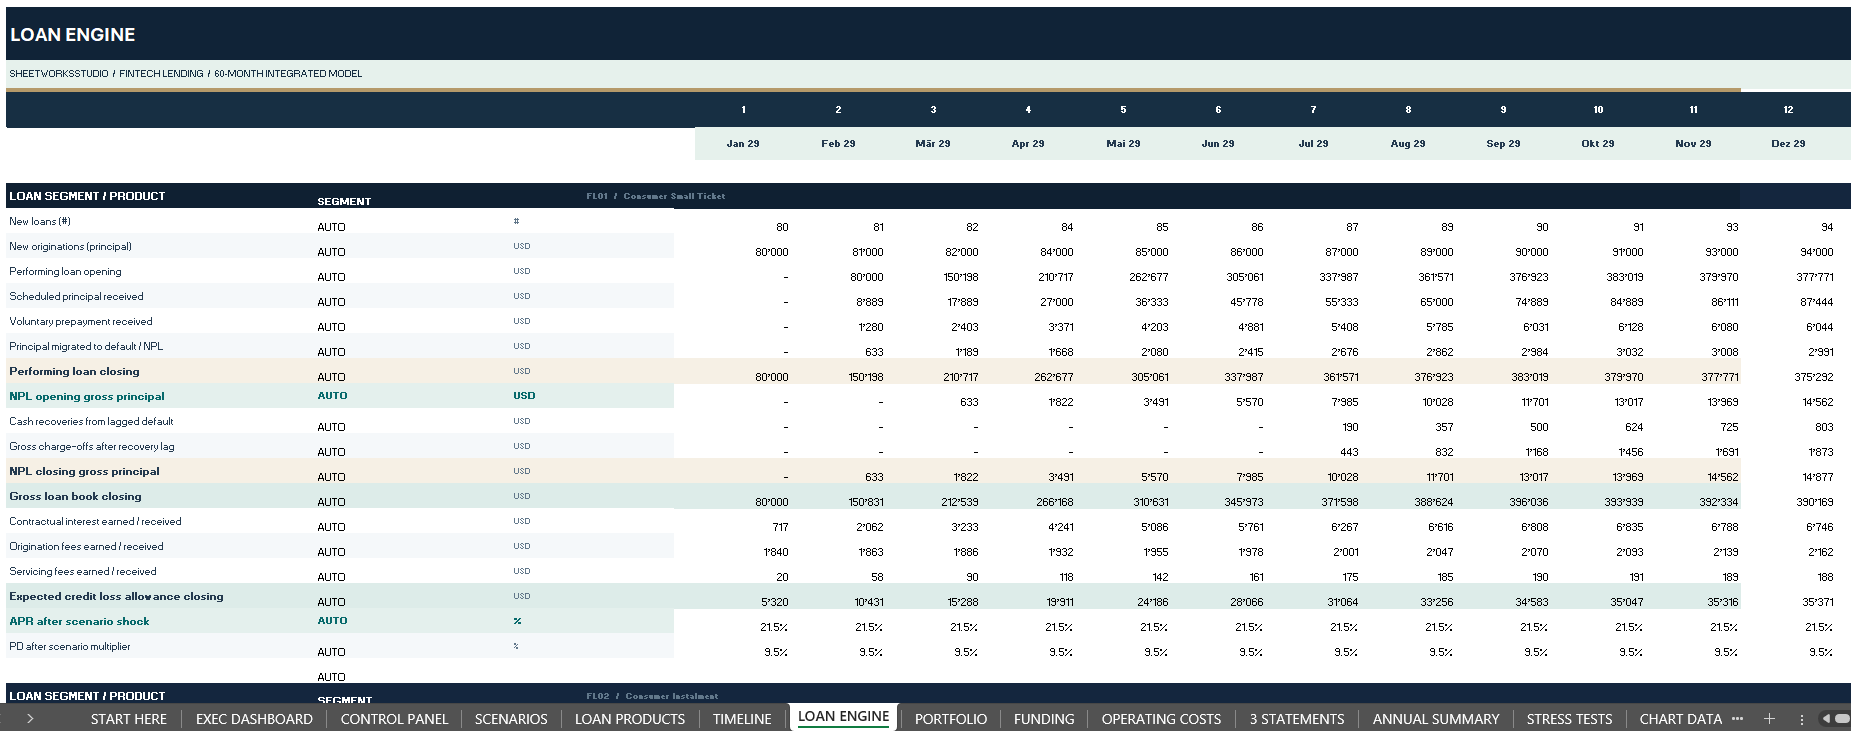
The linked LOAN ENGINE calculates:
✓ New Lending Originations
✓ Performing Loan Balances
✓ Scheduled Principal Collections
✓ Voluntary Prepayments
✓ Default Migration
✓ Non-Performing Loan Balances
✓ Recoveries and Chargeoffs
✓ Contractual Interest Income
✓ Fee Revenue
✓ Simplified Expected Credit Allowances
The loan engines represent aggregated product segments rather than individual borrower records.
🏦 3. WAREHOUSE FINANCING & LIQUIDITY PLANNING
Analyze whether projected lending growth can be supported by available financing and shareholder capital.
The integrated warehouse facility includes:
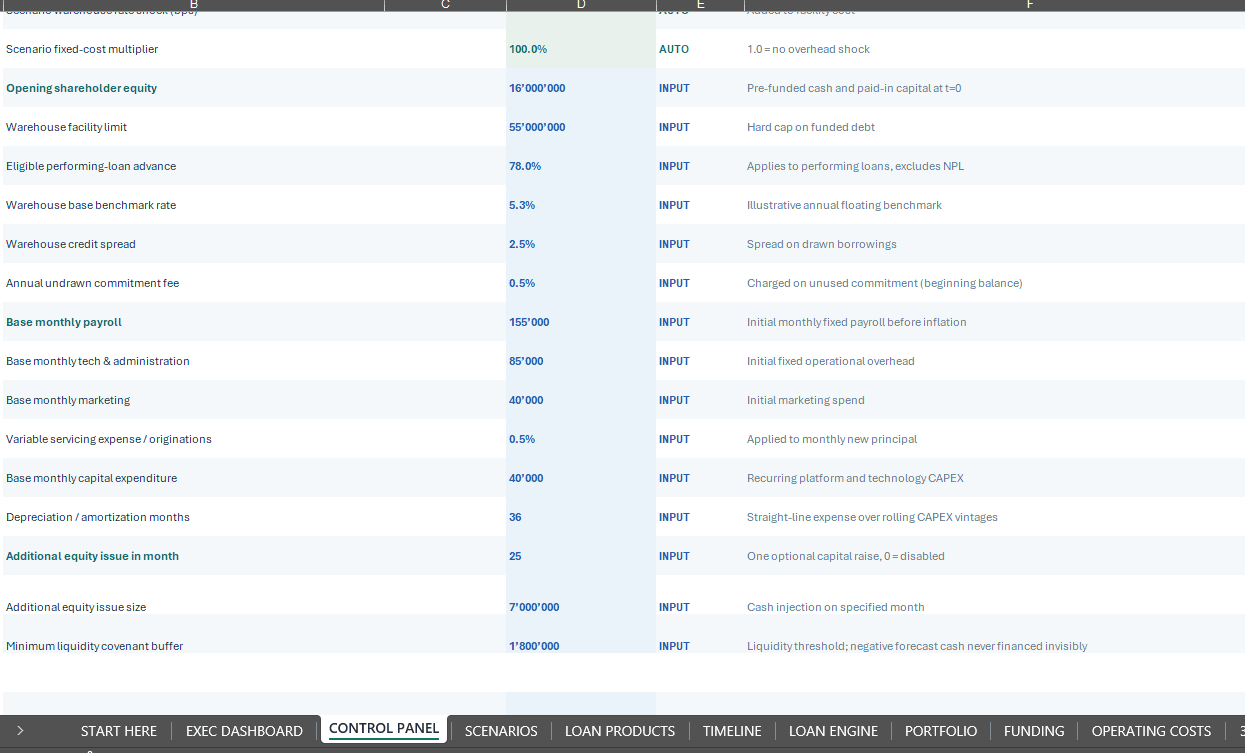
✓ Facility Commitment
✓ Borrowing-Base Advance Rate
✓ Benchmark Funding Rate
✓ Warehouse Financing Spread
✓ Unused Commitment Fee
✓ Facility Drawdowns
✓ Debt Repayments
✓ Outstanding Borrowing
✓ Undrawn Capacity
✓ Funding Costs
The CONTROL PANEL allows users to configure opening shareholder capital, an additional equity injection, minimum cash requirements and funding assumptions.
Liquidity analysis links loan originations, customer collections, operating costs and financing movements to cash balances.
Potential cash deficits remain visible rather than being automatically eliminated through artificial financing assumptions.
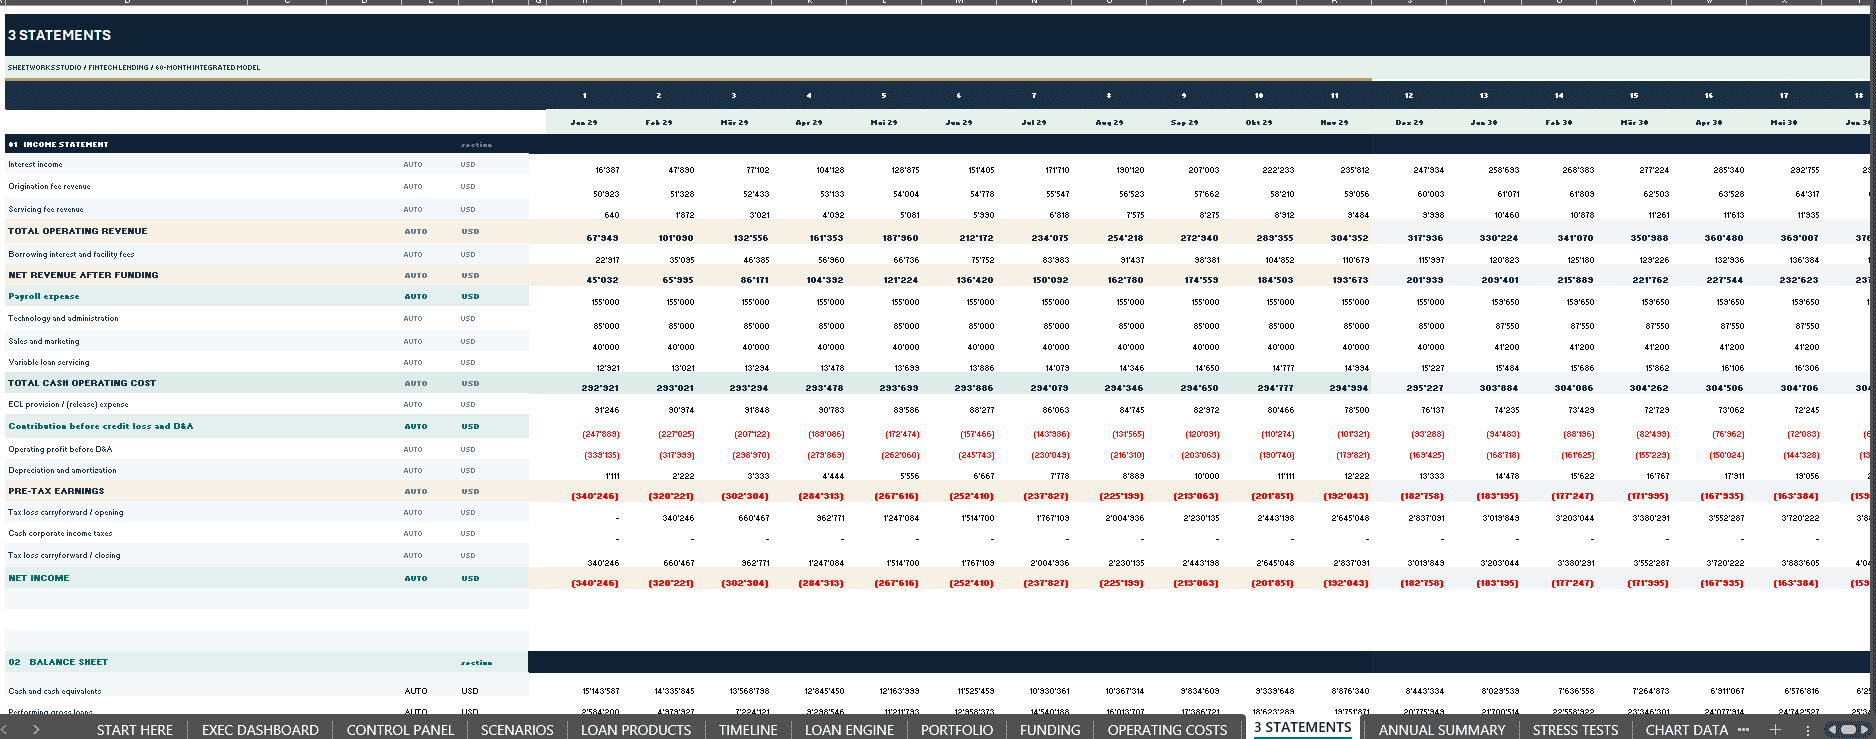
📈 4. THREE INTEGRATED FINANCIAL STATEMENTS
Review 60 months of connected operating and financial projections.
Included Financial Statements:
✓ Income Statement
✓ Balance Sheet
✓ Cash Flow Statement
Supporting calculations cover:
✓ Interest and Fee Revenue
✓ Credit Loss Provisions
✓ Warehouse Financing Expenses
✓ Payroll and Employee Costs
✓ Technology and Administration
✓ Marketing Expenses
✓ Variable Loan Servicing Costs
✓ Recurring Capital Expenditure
✓ Depreciation
✓ Simplified Corporate Income Taxes
✓ Shareholder Equity
✓ Monthly Cash Movements
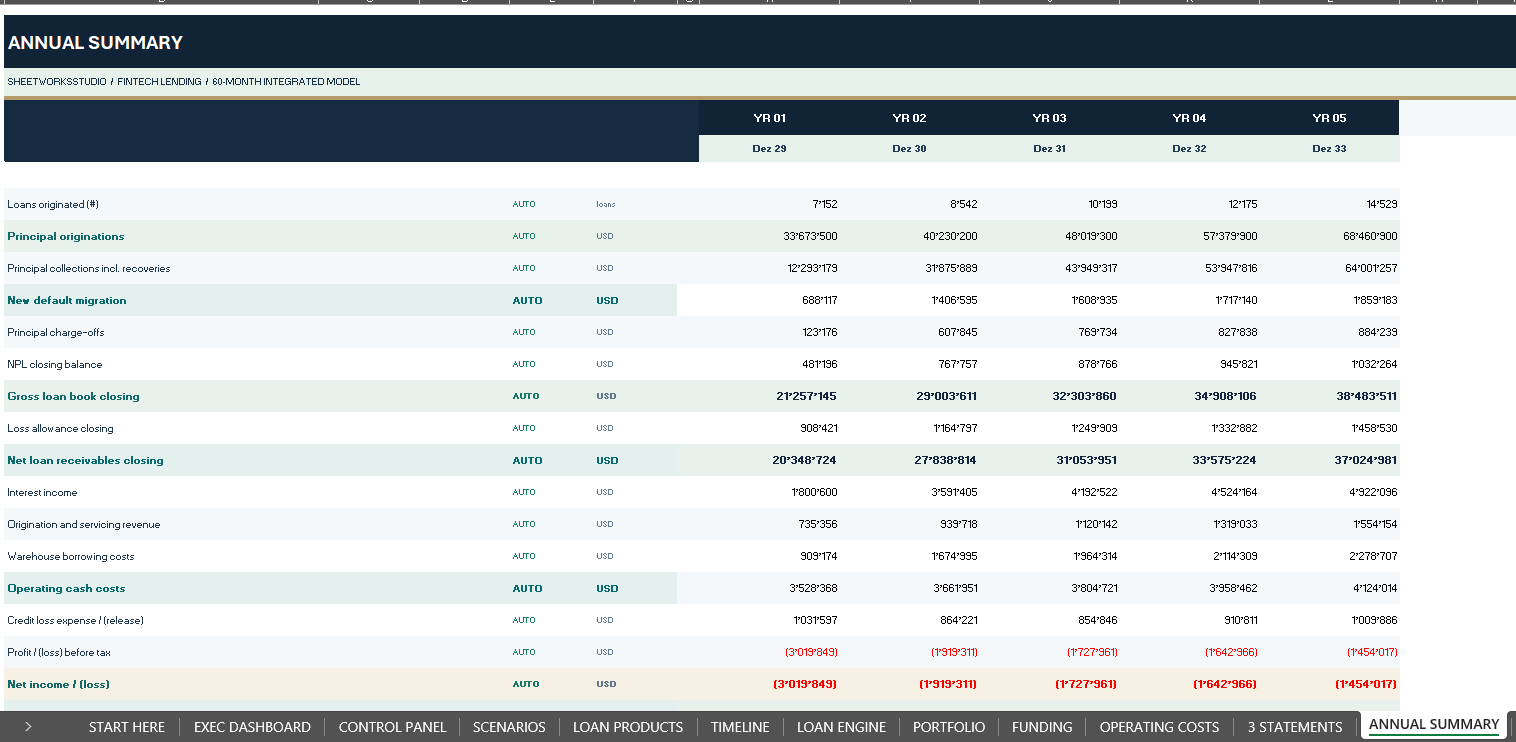
The ANNUAL SUMMARY consolidates monthly results into five consecutive reporting years.
Income and cash-flow measures are aggregated across each year, while portfolio balances, debt, cash and equity use the corresponding period-end positions.
⚙ 5. FIVE EDITABLE OPERATING SCENARIOS
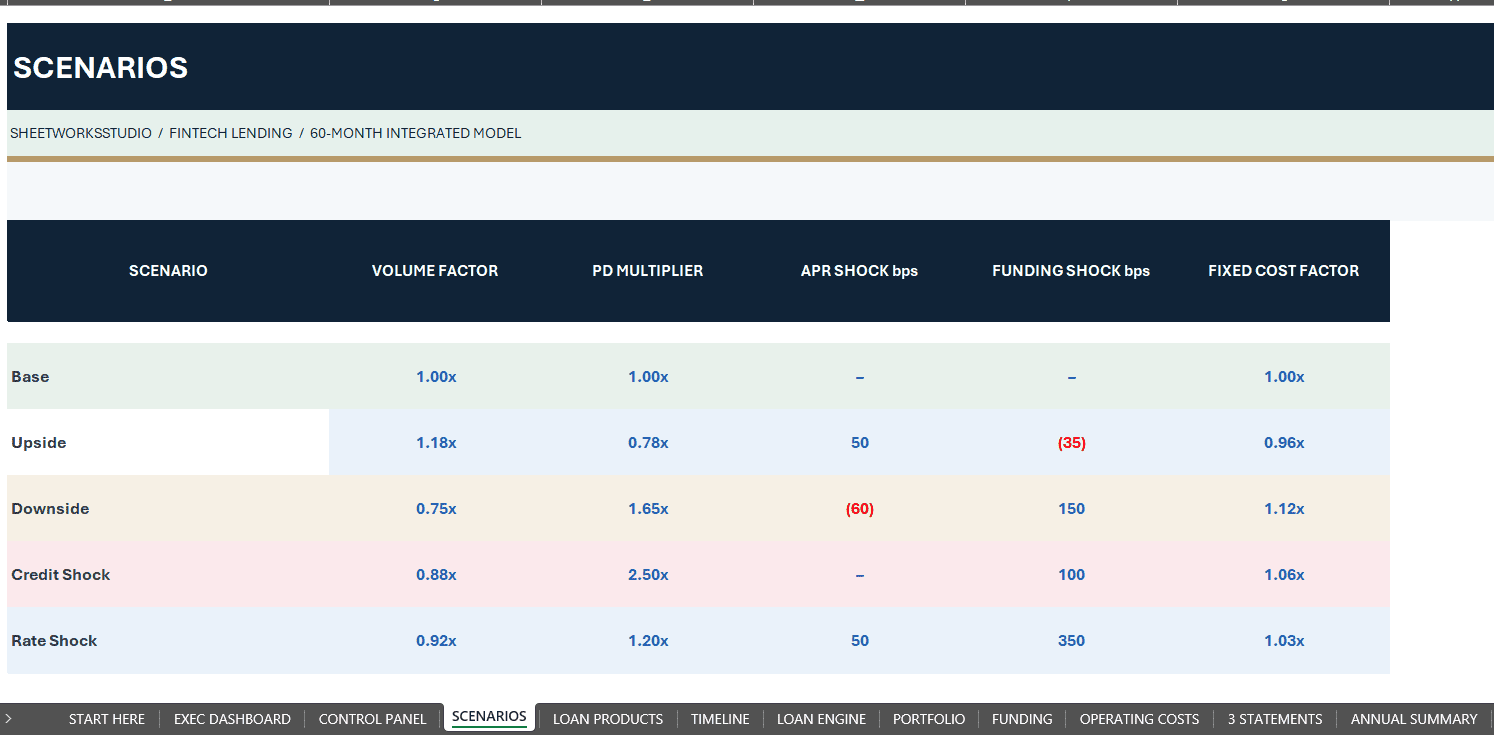
Evaluate alternative lending environments using five selectable scenarios.
BASE — Central operating and credit assumptions.
UPSIDE — More favorable origination, credit and financing conditions.
DOWNSIDE — Lower origination activity, weaker credit performance and increased expenses.
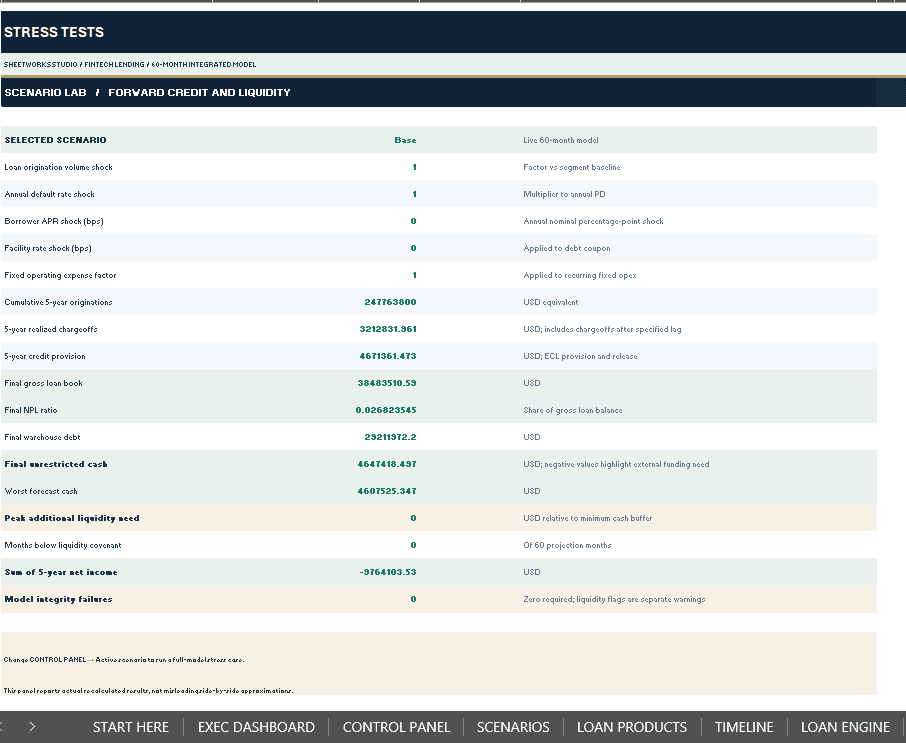
CREDIT SHOCK — Increased borrower defaults and credit-loss pressure.
RATE SHOCK — Higher funding costs and changing lending spreads.
Editable scenario factors include:
✓ Loan Origination Volume
✓ Annual Default Probability
✓ Borrower Interest Rates
✓ Warehouse Funding Costs
✓ Fixed Operating Expenses
Selecting a scenario recalculates the connected operating and financial schedules.
The STRESS TESTS worksheet displays the selected scenario’s results. It does not automatically preserve independent historical snapshots of all five cases.
🔎 6. CREDIT RISK & PORTFOLIO ANALYSIS
Analyze how changes in default rates, repayments, borrower pricing and funding assumptions influence the loan portfolio.
Credit and portfolio metrics include:
✓ Gross Loan Balances
✓ Net Loan Receivables
✓ Performing Portfolio
✓ Non-Performing Portfolio
✓ Credit Allowances
✓ Credit Loss Provisions
✓ Recoveries
✓ Writeoffs
✓ Portfolio Interest Yield
✓ Cost of Risk
The forecasting methodology uses simplified monthly amortization, annual-to-monthly default approximations and defined recovery conventions.
This creates a transparent framework for credit planning without requiring borrower-level data or proprietary risk software.
✅ 7. MODEL CONTROLS & FINANCIAL WARNINGS
The MODEL CHECKS worksheet provides automated reconciliation controls across the monthly projection.
Control Areas Include:
✓ Performing Loan Book Continuity
✓ Non-Performing Loan Book Continuity
✓ Gross Loan Portfolio Reconciliation
✓ Credit Allowance Movements
✓ Cash Flow Reconciliation
✓ Balance Sheet Reconciliation
✓ Warehouse Debt Continuity
✓ Facility Commitment Limits
✓ Borrowing-Base Constraints
✓ Fixed Asset Roll-Forward
✓ Shareholder Equity Continuity
✓ Tax-Loss Carryforward Continuity
Liquidity warnings are distinguished from mathematical reconciliation failures.
A PASS result confirms only the programmed numerical checks. It does not guarantee adequate liquidity, profitability or creditworthiness.
The fictional Base scenario includes negative cumulative earnings and a negative Year-5 return on equity. Certain downside scenarios also produce negative closing cash balances.
These economic outcomes are retained intentionally for transparent financial planning.
📦 8. WHAT YOU RECEIVE
FILE 1 — FINTECH LENDING FINANCIAL MODEL (.XLSX)
✓ 16 Interconnected Worksheets
✓ 60 Monthly Forecast Periods
✓ Five Annual Financial Summaries
✓ 15 Editable Lending Segments
✓ Five Selectable Scenarios
✓ Eight Native Excel Dashboard Charts
✓ Loan Origination and Repayment Schedules
✓ Non-Performing Loan and Credit-Loss Calculations
✓ Warehouse Financing
✓ Liquidity and Funding Gap Analysis
✓ Three Integrated Financial Statements
✓ Model Checks
✓ In-Workbook Navigation and Guidance
FILE 2 — COMPLETE HOW-TO-USE GUIDE (.PDF)
A comprehensive 38-page English user manual covering:
✓ Workbook Setup
✓ Worksheet Navigation
✓ Loan Product Assumptions
✓ Loan Amortization and Repayment Calculations
✓ Default and Recovery Methodology
✓ Credit Allowance Calculations
✓ Warehouse Financing
✓ Financial Statements
✓ Dashboard and KPI Interpretation
✓ Five Scenario Experiments
✓ Model Checks and Troubleshooting
✓ Financial Modeling Conventions
✓ Important Scope Limitations
Both files are supplied together in one downloadable ZIP package.
The guide may also be provided separately as a complimentary reference resource without the paid Excel financial model.
🧭 9. HOW TO USE
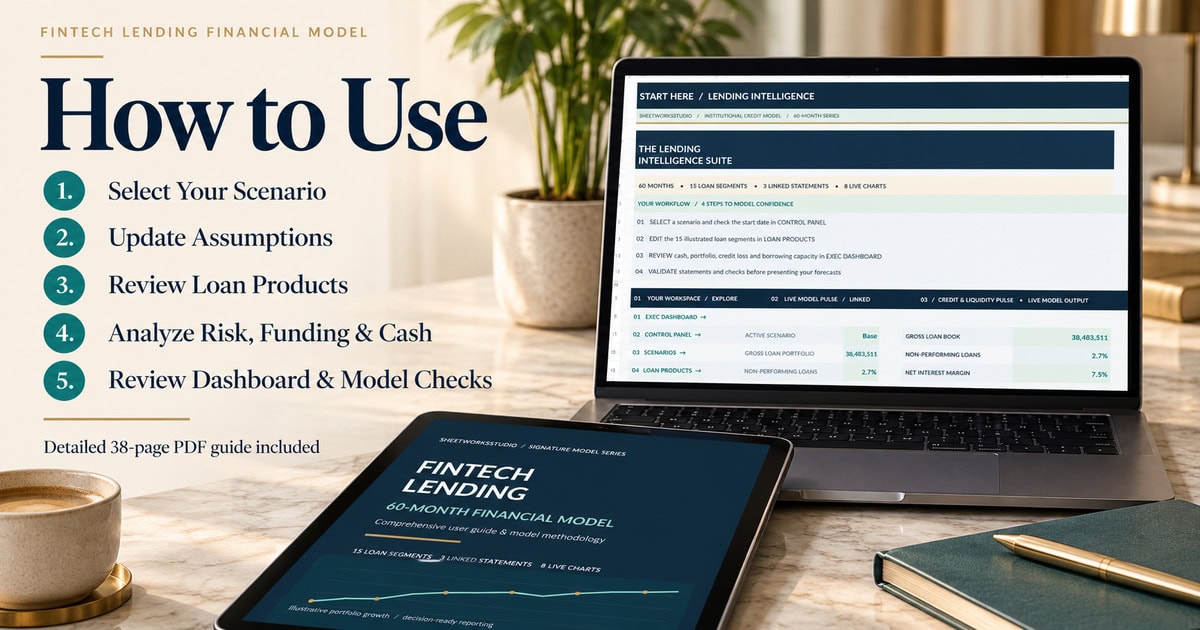
STEP 1 — Open START HERE and review the recommended workflow.
STEP 2 — Configure the forecast date, funding assumptions, shareholder capital and scenarios.
STEP 3 — Replace fictional lending-segment assumptions in LOAN PRODUCTS.
STEP 4 — Review LOAN ENGINE, PORTFOLIO, FUNDING and the financial statements.
STEP 5 — Test Base, Upside, Downside, Credit Shock and Rate Shock assumptions.
STEP 6 — Investigate MODEL CHECKS and liquidity warnings before relying on the financial results.
👥 10. WHO IS THIS MODEL FOR?
✓ Fintech Lending Startups
✓ Consumer and SME Lenders
✓ Lending-Business Founders
✓ Chief Financial Officers
✓ FP&A Professionals
✓ Financial Consultants
✓ Credit Portfolio Analysts
✓ Lending Operations Managers
✓ Financial Modeling Students
⚙ 11. TECHNICAL SPECIFICATIONS
Forecast Horizon: 60 Months / Five Years
Illustrative Period: January 2029–December 2033
Worksheets: 16
Loan Product Segments: 15
Scenarios: Base, Upside, Downside, Credit Shock, Rate Shock
Native Dashboard Charts: 8
Financial Statements: Income Statement, Balance Sheet and Cash Flow Statement
Documentation: 38-Page English PDF Guide
File Formats: XLSX + PDF
Recommended Software: Microsoft Excel Desktop
Macros / VBA: Not Required
External Data Connections: Not Required
Delivery: Digital ZIP Download
Google Sheets import and functional compatibility have not been independently verified. Equivalent formulas, charts, validations and formatting are not guaranteed.
The reporting currency setting changes the displayed label and does not perform automatic foreign-exchange conversion.
🛡 12. IMPORTANT MODEL LIMITATIONS & DISCLAIMER
This workbook is an illustrative, aggregated balance-sheet lending financial model. It is not a borrower-level underwriting platform or statutory banking reporting system.
Loan repayments use simplified aggregate amortization conventions. Expected credit losses use simplified planning assumptions and do not implement a complete IFRS 9 or CECL framework.
The model excludes detailed loan-vintage tracking, regulatory capital, complex financing structures, sophisticated covenant testing, multi-currency translation and business valuation.
All borrowers, credit characteristics and financial forecasts are fictional examples.
The template is an independent, unofficial product by SheetworksStudio. It is not certified, audited, approved or endorsed by any financial institution, software provider or financial regulator.
It does not constitute investment, financial, accounting, lending, tax, legal or regulatory advice.
Users must validate all assumptions and calculations and obtain appropriate professional review before making material financial decisions.
MODEL LOAN GROWTH. ANALYZE CREDIT RISK. CONTROL FUNDING. FORECAST LIQUIDITY.
SheetworksStudio | Premium Financial Modeling Templates
Similar ProductsOther customers were also interested in...


 eFinancialModels
Electric Vehicle (EV) Charging Station Financial M...
With this comprehensive 5- or 10-year monthly tool, investors can assess the viability of setting up... Read more

Financial Model for Mobile App | Mobile App Busine...
The Mobile App Financial Plan Template in Excel allows you to develop financial projections when lau... Read more

 HenrySheykin
Food Truck Financial Model Excel Template
The Food Truck Financial Model helps entrepreneurs, founders, business owners, consultants, and anal... Read more

Green Hydrogen Production from Wind Energy Financi...
The Green Hydrogen from Wind Financial Model aims to comprehensively forecast a horizon of 40 years ... Read more

Simple Mutual Non-Disclosure Agreement Template
Protect your business secrets with ease using our Simple Mutual Non-Disclosure Agreement Template. S... Read more

Solar Energy Financial Model
The Solar Energy Financial Model Spreadsheet Template in Excel assists you in preparing a sophistica... Read more

 Peter Graf
The Customer-Centric Financial Model for Restauran...
Starting a restaurant without a financial plan is like driving a car blindfolded. You wouldn´t do i... Read more
You must log in to submit a review.