
0 ITEMS

Auto Spares Marketplace Financial Model Excel Template
The Auto Parts Store Financial Model helps entrepreneurs, store owners, consultants, analysts, and founders turn an auto parts retail concept into a structured financial forecast. Instead of building complex spreadsheets from scratch, users can start with a ready-to-use model designed around the economics of an automotive parts shop, including visitor traffic, buyer conversion, repeat customers, product category sales, inventory costs, payroll, operating expenses, cash flow, and profitability. It is built to support practical financial planning, whether the goal is to open a new store, expand an existing operation, prepare a business plan, or evaluate funding needs. This template gives users a clear way to estimate how the business may perform over time based on editable assumptions. Revenue assumptions can be adjusted around daily store visitors, customer conversion rates, order frequency, pricing, and product mix across categories such as brake pads, oil filters, engine oil, accessories, and special orders. Cost assumptions can be customized for inventory, supplier terms, rent, utilities, marketing, staffing, delivery, insurance, and other operating expenses. By connecting these drivers in one model, the template helps users understand how sales volume, gross margin, payroll, and overhead affect profit and cash flow. The model is useful for both startup planning and ongoing decision-making. Users can estimate startup costs, identify required initial funding, review monthly and annual projections, and evaluate whether the business can reach sustainable profitability. It also supports break-even analysis, helping users understand when revenue may be sufficient to cover fixed and variable costs. This is especially important for an auto parts store because inventory investment, supplier payment timing, and working capital needs can create cash pressure before sales fully ramp up. Designed for professional use, the Auto Parts Store Financial Model includes investor-ready outputs, forecast reports, charts, dashboards, scenario analysis, and performance metrics that can be used in lender discussions, investor presentations, internal planning sessions, or feasibility studies. The template is fully editable and compatible with Excel and Google Sheets, making it practical for non-financial users while still detailed enough for advisors and analysts. It helps buyers save time, organize assumptions, test different outcomes, and make more confident decisions before committing capital, hiring staff, purchasing inventory, or signing a lease.
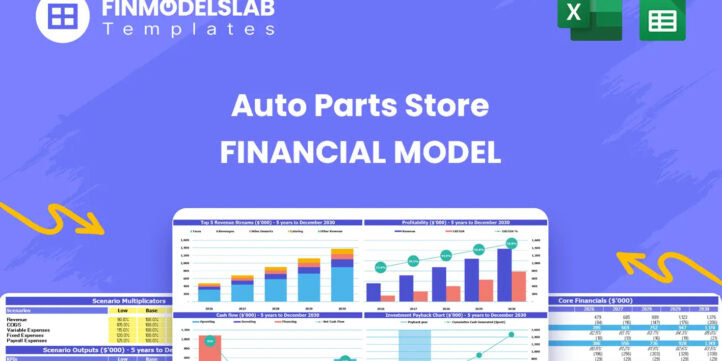


Financial Model Overview
The Auto Parts Store Financial Model is a ready-to-use financial model template built for planning, launching, funding, or expanding an automotive parts retail business. It gives users a structured way to forecast revenue, startup investment, inventory costs, operating expenses, payroll, cash flow, profitability, and funding needs over a multi-year period. For an auto parts store, financial planning is especially important because the business depends on carrying the right inventory, managing supplier costs, converting store traffic into paying customers, and maintaining enough working capital to cover stock purchases before cash is fully recovered through sales. This template helps entrepreneurs, business owners, consultants, analysts, and founders replace guesswork with a clear financial planning framework. Users can customize assumptions for store visitors, conversion rates, product categories, average prices, cost of goods sold, staffing, rent, marketing, and financing. The result is a practical model that can support business plans, investor presentations, bank loan applications, feasibility studies, and internal decision-making.
All-in-One Dashboard
The all-in-one dashboard gives users a central view of the most important inputs and outputs in the Auto Parts Store Financial Model. It is designed to make the model easier to manage by bringing the key planning assumptions and financial results into one organized area. Users can review core drivers such as customer traffic, conversion rates, revenue growth, product mix, gross margin, payroll, operating expenses, funding assumptions, and cash flow performance without needing to search through multiple worksheets. The dashboard helps translate detailed calculations into a practical summary that business owners and stakeholders can understand quickly. It may show projected revenue, expenses, EBITDA, net profit, cash balance, investment needs, and return metrics in a concise format. This is useful for planning because an auto parts store has many moving parts, including inventory, repeat customers, walk-in traffic, special orders, and supplier costs. A central dashboard helps users check whether assumptions are realistic, spot major changes in performance, and make faster decisions about pricing, staffing, purchasing, marketing, and funding.
Low, Base, and High Scenario Analysis
The low, base, and high scenario analysis section helps users test how the auto parts store may perform under different market conditions. Instead of relying on one forecast, the model allows users to compare a conservative case, an expected case, and an optimistic case based on changes in key assumptions. These assumptions may include daily store visitors, buyer conversion rates, average order values, repeat purchase frequency, gross margin, payroll levels, rent, supplier costs, and marketing efficiency. The outputs help show how revenue, profit, cash flow, ending cash balance, funding needs, and investor returns change when conditions improve or weaken. This is especially useful for an auto parts store because customer demand, local competition, inventory availability, supplier pricing, and economic conditions can significantly affect performance. Scenario analysis helps founders prepare contingency plans, identify minimum sales levels needed to remain stable, and understand what happens if growth takes longer than expected. It also gives investors and lenders a clearer view of risk by showing that the plan has been tested across multiple outcomes.
Professional Charts
The professional charts section converts the financial forecast into clear visual reports that are easier to review, explain, and present. Charts may display revenue growth, expense trends, gross profit, EBITDA, net income, cash balance, funding requirements, cost structure, and other key measures over time. These visual outputs help users see patterns that may be harder to identify in raw spreadsheet tables, such as when margins begin improving, when cash dips occur, or how quickly profitability accelerates after the store reaches scale. For an auto parts store, charts can be especially helpful because the model combines multiple revenue streams, product categories, inventory costs, and operating expenses into one forecast. Visual reporting makes it easier to communicate the business story to stakeholders who may not want to review every underlying calculation. Entrepreneurs can use these charts in pitch decks, business plans, lender meetings, or internal planning discussions. Consultants and analysts can also use them to explain recommendations, compare scenarios, and support decisions related to pricing, staffing, expansion, inventory purchasing, or working capital management.
ROE Components and DuPont Analysis
The ROE components and DuPont analysis section helps users understand the drivers behind return on equity rather than looking only at the final return figure. This component breaks financial performance into underlying factors such as profitability, asset efficiency, and leverage, helping users see whether returns are being driven by stronger margins, better use of assets, or changes in financing structure. In an auto parts store, return on equity can be affected by inventory investment, equipment purchases, delivery assets, working capital requirements, profit margins, and debt or investor financing. By analyzing these relationships, users can evaluate whether the business is generating efficient returns on the capital invested. Inputs may include net income, total assets, equity, debt levels, sales, margins, and balance sheet assumptions. Outputs may include return on equity, asset turnover, profit margin, and leverage-related metrics. This section is useful for investor discussions because it explains not only what return may be achieved but why that return occurs. It also helps business owners identify improvement opportunities, such as reducing excess inventory, improving gross margin, or optimizing financing.
Revenue Inputs
The revenue inputs section is where users define the commercial assumptions that drive the auto parts store forecast. This component may include daily store visitors, customer conversion rates, repeat customer activity, average order frequency, product category pricing, sales mix, and annual growth assumptions. For an auto parts retail business, revenue is not simply a single sales number. It depends on how many people visit the store, how many become buyers, what they purchase, and how often they return. The model can accommodate multiple product categories such as brake pads, oil filters, engine oil, accessories, and special orders, allowing users to estimate revenue based on the actual mix of products sold. Users can adjust prices, order values, and category shares to reflect their local market, supplier relationships, customer base, and merchandising strategy. The outputs help generate monthly and annual revenue projections that feed directly into profit and cash flow calculations. This section is useful because it forces the user to think through how the business will actually make money and whether sales assumptions are realistic enough to support payroll, rent, inventory purchases, and debt payments.
Bank-Ready Reports
The bank-ready reports section organizes the financial model outputs into lender-friendly statements and summaries that can support funding applications and stakeholder review. Banks and financing partners usually want to understand projected revenue, gross profit, operating expenses, cash flow, debt service capacity, working capital needs, and the timing of profitability. This component helps present those outputs in a structured and professional way, making the forecast easier to review and more credible. The reports may include profit and loss projections, cash flow statements, balance sheet forecasts, startup funding summaries, debt repayment assumptions, and key financial metrics. For an auto parts store, bank-ready reporting is important because startup costs can include inventory stock, shelving, fixtures, lease deposits, equipment, delivery vehicles, technology, licenses, and initial marketing. Lenders also need to see whether the store can maintain enough cash to operate while building customer traffic. These reports help users explain funding needs, justify loan amounts, document assumptions, and demonstrate that the business has a plan for managing expenses, generating profit, and repaying financing over time.
Revenue Breakdown
The revenue breakdown section provides a detailed view of how different revenue streams contribute to total sales. Instead of treating the auto parts store as one generic source of income, this component separates revenue by product type or category so users can see which lines drive the business. Categories may include brake pads, oil filters, engine oil, accessories, special orders, batteries, tools, maintenance products, or other parts depending on how the user customizes the model. Inputs may include unit prices, sales volume, category mix, customer purchase behavior, and growth rates. Outputs help show the contribution of each product category to total revenue and may also support margin analysis by linking product sales to cost of goods sold. This is useful because not all auto parts generate the same profitability. Some categories may create higher margins, while others may drive traffic or encourage repeat purchases. By reviewing the revenue breakdown, users can make better decisions about inventory purchasing, merchandising, supplier negotiation, promotions, and pricing strategy. It also helps stakeholders understand how the store’s sales plan is built from specific, measurable revenue drivers.
KPI Dashboard
The KPI dashboard section tracks the key performance indicators that matter most for an auto parts store and compares them against planning targets or industry-informed benchmarks. This component may include metrics such as daily visitors, conversion rate, repeat customer rate, average order value, revenue per customer, gross margin, cost of goods sold as a percentage of revenue, payroll as a percentage of sales, EBITDA margin, cash balance, inventory-related indicators, and return metrics. The purpose of the KPI dashboard is to turn the financial model into an ongoing management tool, not just a one-time forecast. Users can quickly see whether the business is performing in line with expectations and which drivers need attention. For example, if revenue is below plan, the dashboard can help determine whether the issue is traffic, conversion, pricing, or product mix. If profit is under pressure, the user can review supplier costs, payroll, overhead, or gross margin. This component is useful for decision-making because it focuses attention on the financial and operational metrics that directly influence profitability, cash flow, and long-term sustainability.
Startup Cost Breakdown
The startup cost breakdown section helps users estimate the initial investment required before the auto parts store begins operating. This component organizes launch expenses into practical categories such as initial inventory stock, shelving and display fixtures, leasehold improvements, security deposits, point-of-sale systems, computers, signage, licenses, insurance, delivery vehicle costs, opening marketing, professional fees, and initial working capital. Inputs can be adjusted to reflect the size of the store, location, supplier terms, inventory depth, renovation needs, and the owner’s preferred launch strategy. The outputs help calculate the total funding required to open the doors and operate through the early ramp-up period. This is useful because an auto parts store often requires a meaningful upfront inventory investment to serve customers from day one. Underestimating startup costs can create cash shortages, delayed openings, weak product availability, or emergency financing needs. By using a structured startup cost section, users can prepare a more realistic launch budget, compare funding options, decide how much owner equity or debt may be needed, and present a clearer capital requirement to lenders, investors, or partners.
Break-Even Analysis
The break-even analysis section helps users identify when the auto parts store may generate enough revenue to cover its fixed and variable costs. This component evaluates the relationship between sales, gross margin, cost of goods sold, payroll, rent, utilities, marketing, insurance, administrative expenses, and other operating costs. Inputs may include monthly revenue assumptions, average gross margin, fixed overhead, staffing costs, and variable expenses tied to sales volume. Outputs may include the break-even month, required revenue level, required sales volume, and the gap between forecast performance and the break-even threshold. For an auto parts store, break-even analysis is a practical planning tool because the business may operate at a loss during the early months while customer traffic grows, repeat purchases build, and inventory investment stabilizes. Knowing the break-even point helps owners set sales targets, manage spending, evaluate pricing decisions, and determine whether additional working capital is needed. It is also useful for funding discussions because lenders and investors often want to know how long it may take for the business to become self-sustaining and what assumptions must hold true for profitability to be achieved.
File types:
Excel – Single-User: .xlsx
Excel – Multi-User: .xlsx
Similar ProductsOther customers were also interested in...



 David
David
Manufacturing Startup/Existing Business Financial ...
3 statement 5 year rolling financial projection Excel model for a startup /existing manufacturing bu... Read more

 AUT
AUT
Electric Car Company Financial Model
This Financial model is about valuing an Electric Car Company. This is done by bifurcating the compa... Read more
 HenrySheykin
Boutique Hotel Financial Model Excel Template
The Boutique Hotel Financial Model Financial Model Template helps entrepreneurs, hotel owners, consu... Read more
Hotel Financial Model Excel Template
The Hotel Financial Model helps users build a structured financial forecast for a hotel business usi... Read more
Restaurant Financial Model Excel Template
" The Restaurant Financial Model helps users turn a restaurant concept into a structured, editable f... Read more

Fintech Financial Model Excel Template
The Fintech Startup Financial Model helps founders, analysts, consultants, and business planners tur... Read more
Medical Practice Financial Model Excel Template
The Medical Practice Financial Model helps users turn a clinic concept, expansion plan, or healthcar... Read more
Grocery Store Financial Model Excel Template
The Grocery Store Financial Model helps entrepreneurs, founders, consultants, analysts, and retail b... Read more
Coffee Shop Financial Model Excel Template
The Coffee Shop Financial Model helps entrepreneurs, founders, business owners, consultants, and ana... Read more

Online Bank Financial Model Excel Template
The Online Bank Financial Model Financial Model Template helps founders, fintech entrepreneurs, cons... Read more
You must log in to submit a review.