
0 ITEMS

Investment Holding Company Financial Model Excel | 10-Year Portfolio NAV, Cash Flow & Shareholder Returns
Evaluate a 10-year investment holding company with 15 portfolio positions, NAV and shareholder returns, acquisitions and exits, intercompany loans, two external debt facilities, three linked holding-level statements, four scenarios, eight native Excel charts and a 29-page PDF guide.


Investment Holding Company | 10-Year Financial Model
Premium Standalone Holding Valuation, Portfolio Cash Flow & Shareholder Return Planning in Excel
Connect portfolio acquisitions, holding-company cash flows and shareholder outcomes within one structured and editable ten-year Excel financial model.
This independent template links fifteen illustrative investment positions with company-level fair-value estimates, planned disposals, dividend income, intercompany loans, external debt, three standalone holding financial statements and an executive dashboard.
Built for owners of investment holding companies, family-office analysts, corporate finance teams, investment advisers and financial-modeling professionals.
The included demonstration begins in 2029 and ends in 2038; the reporting start year is editable.
All portfolio businesses, financial inputs and example returns are fictional. This model is a transparent planning tool, not an audited valuation or a guarantee of future performance.
📊 EXECUTIVE DASHBOARD | PORTFOLIO INTELLIGENCE
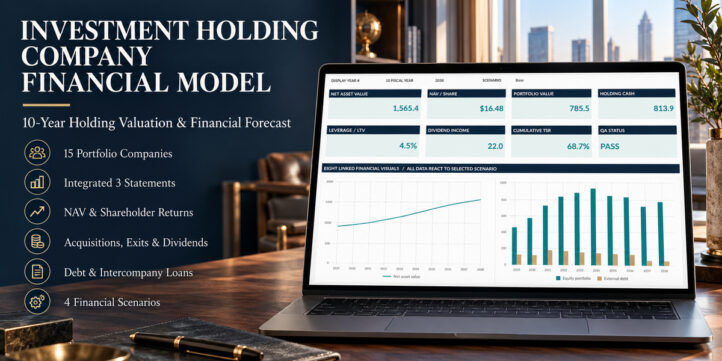
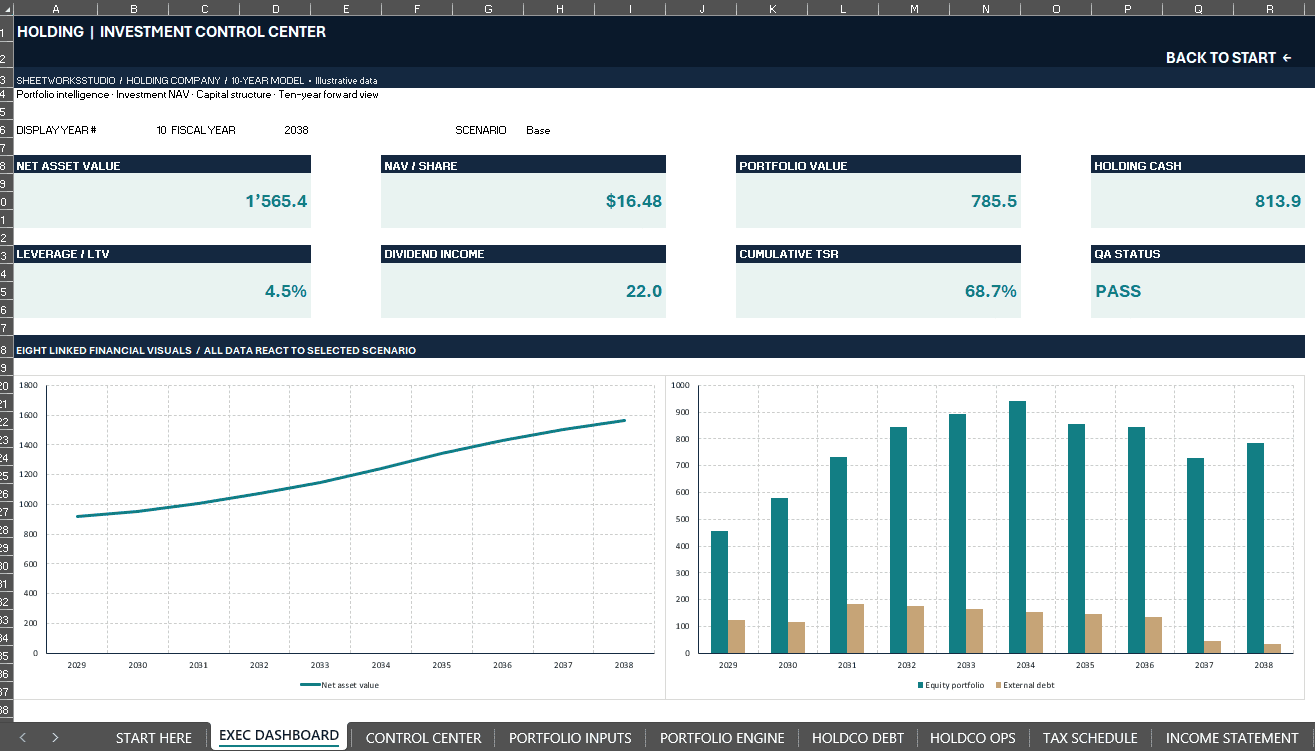
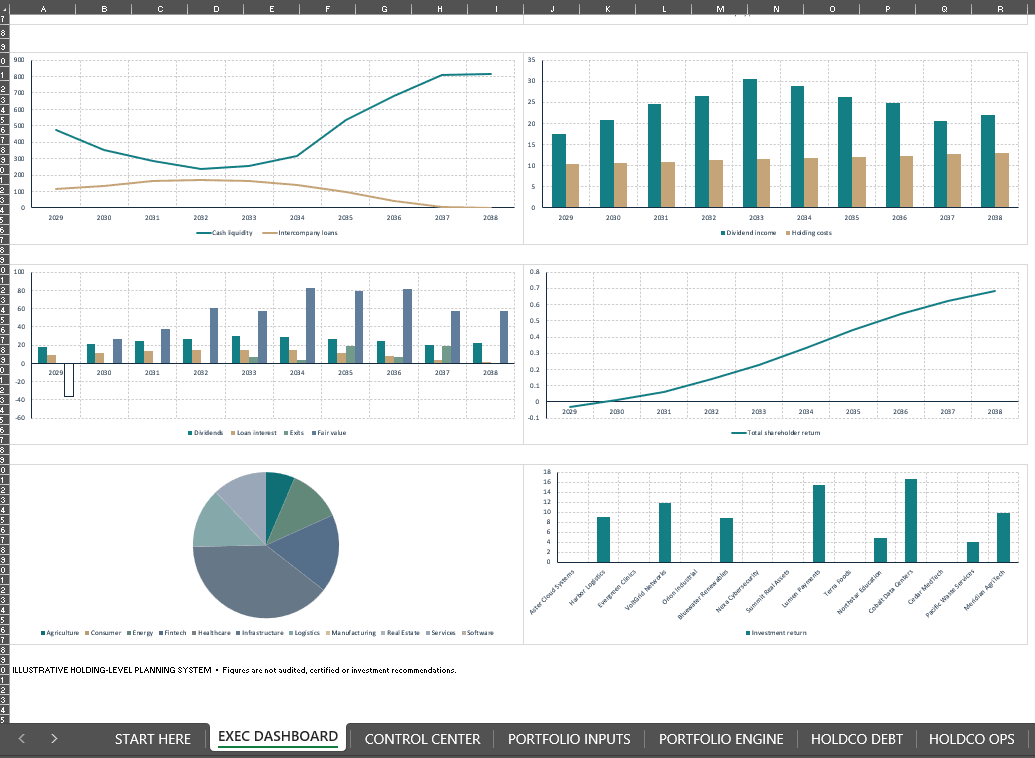
Eight native, linked Excel charts present modeled net asset value, equity investments and external debt, cash and shareholder loans, investment dividends versus holding costs, the portfolio income bridge, shareholder returns, sector allocation and investment-level contribution.
Eight headline indicators include Net Asset Value, NAV per Share, Portfolio Equity Value, Holding Cash, Leverage / LTV, Dividend Income, Cumulative Total Shareholder Return (TSR) and the model QA status.
Choose a display-year number between one and ten to inspect the corresponding period without rewriting the underlying calculations.
◈ PORTFOLIO VALUATION & 15 EDITABLE INVESTMENTS
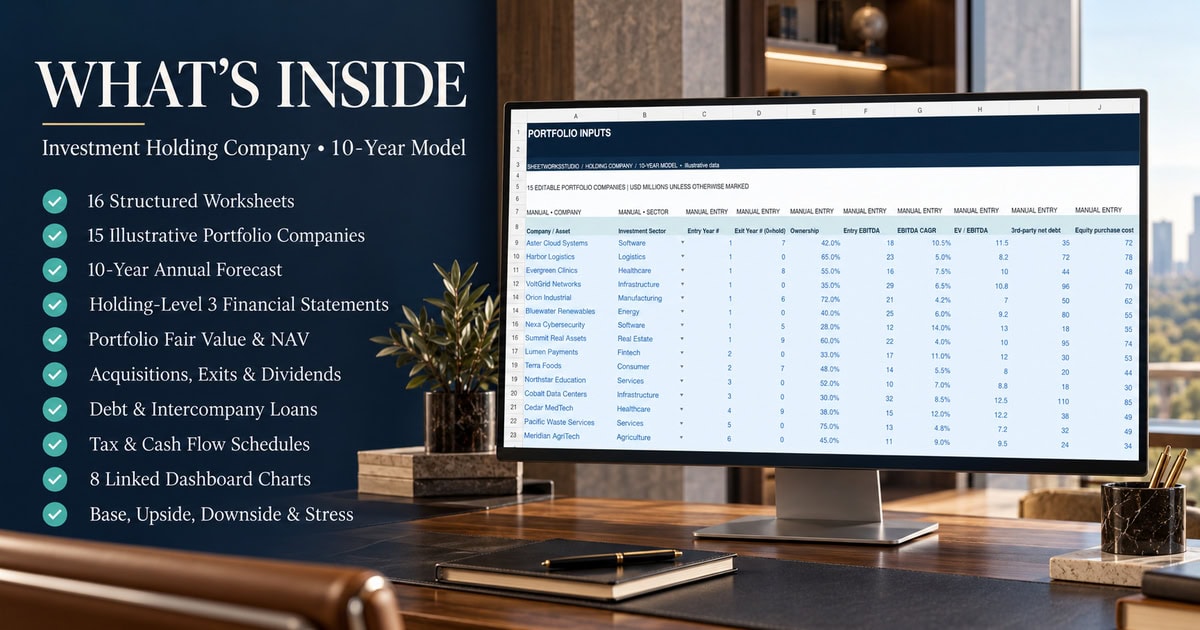
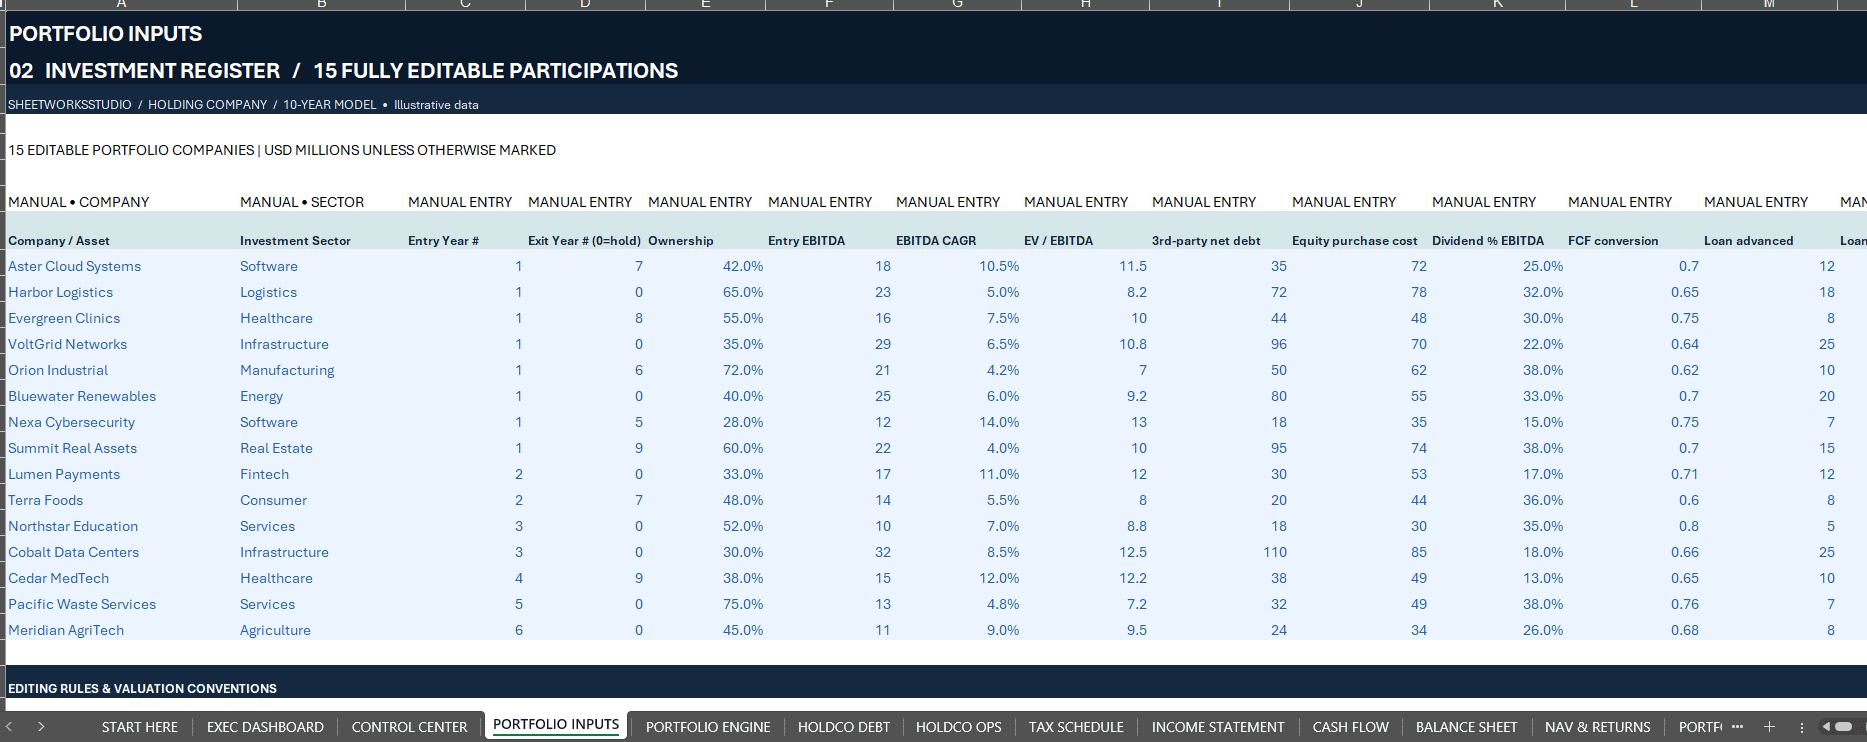
Replace the fifteen fully fictional company records in PORTFOLIO INPUTS.
Editable inputs include investment sector, entry and exit years, ownership percentage, initial EBITDA, EBITDA growth, EV/EBITDA multiple, investee third-party net debt, acquisition purchase cost, payout and FCF assumptions, shareholder-loan principal, coupon, loan term and exit expenses.
PORTFOLIO ENGINE tracks portfolio companies across the ten periods, including fair-value movements, dividends, loan advances, coupon income, principal receipts, cash spent on acquisitions and net disposal proceeds.
Scenario-linked exit delays may move an intended sale beyond the forecast horizon; not every planned exit is realized automatically.
Investment values follow a simplified EBITDA-multiple approach with equity and intercompany-loan adjustments. The model does not include a detailed company-by-company DCF model or audited market valuation.
◈ NAV, LIQUIDITY & SHAREHOLDER RETURNS
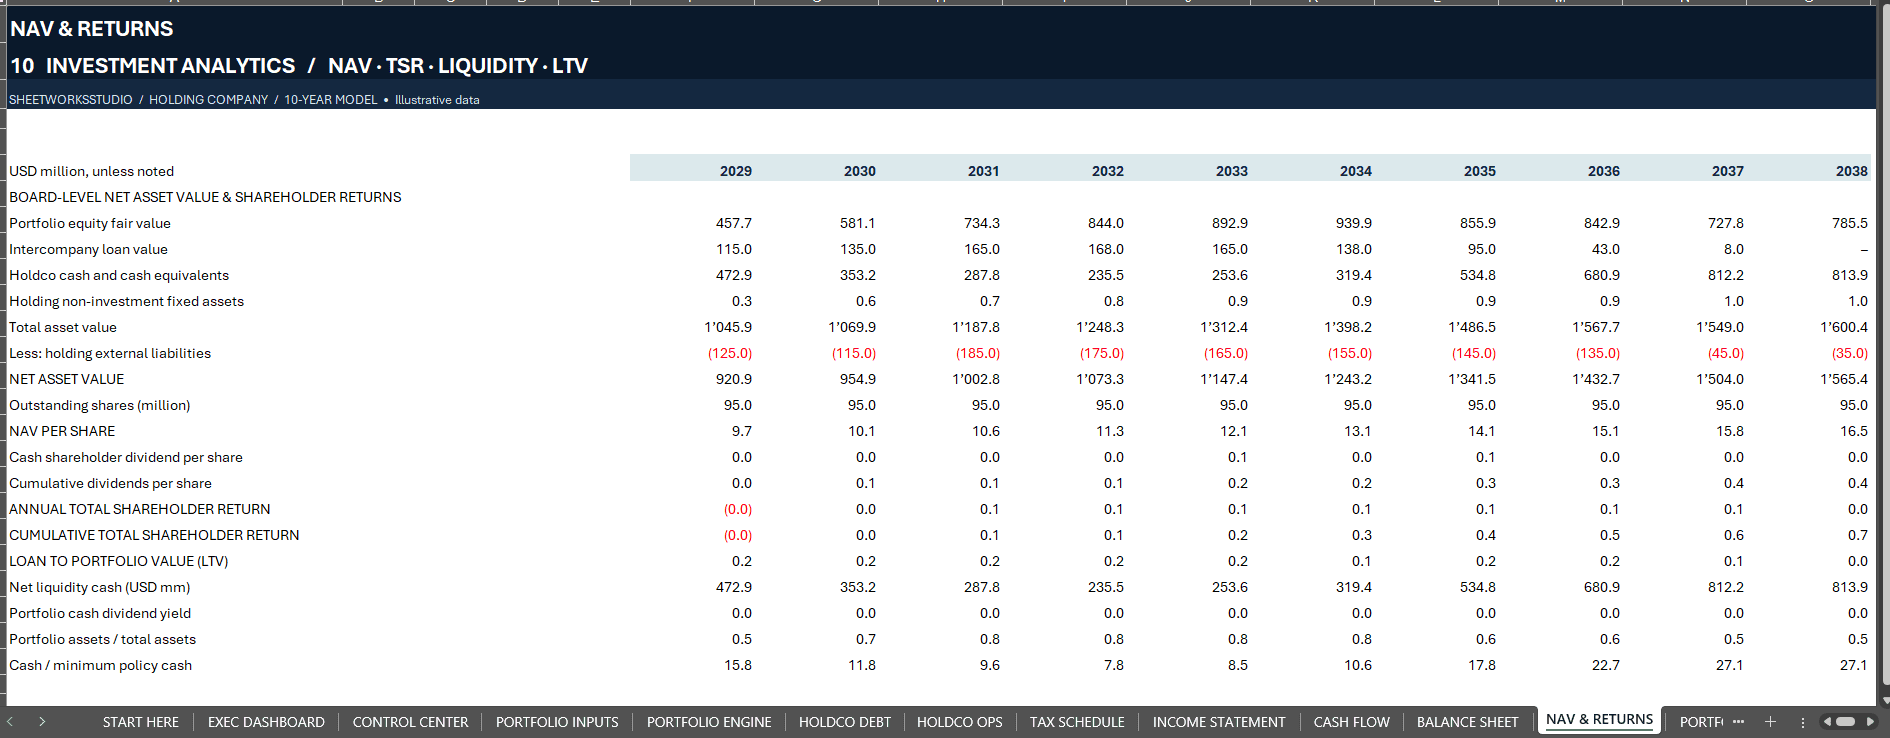
Review an explicit bridge from equity investments, intercompany loan receivables, holding cash and corporate PP&E to external holding debt and estimated net asset value.
NAV per share, cumulative shareholder dividends, dividend yield, LTV and modeled total shareholder return help connect portfolio decisions with investor-level outcomes.
Holding cash is separately tracked: a higher estimated portfolio value does not imply immediate liquidity or funding capacity.
NAV-based TSR is a planning estimate, not a market-traded share-price return.
🏦 HOLDCO DEBT, INTERCOMPANY FINANCING & OVERHEAD
Two modeled external credit facilities support the holding’s financing analysis: a term borrowing schedule with planned annual repayment and a revolving/acquisition facility with selected draw and repayment periods.
Trace interest, debt balances, borrowing proceeds and repayments.
Intercompany lending is modeled separately from investment equity, with advances, cash coupon income and principal recovery at the modeled term or disposal trigger.
Holding operating costs include personnel, general administration, professional/board and governance expenses, together with corporate capital expenditure and depreciation.
The loan schedules are simplified annual financing conventions; there is no comprehensive covenant package, credit impairment engine or automatic refinancing of deficits.
📑 THREE INTEGRATED HOLDING-LEVEL FINANCIAL STATEMENTS
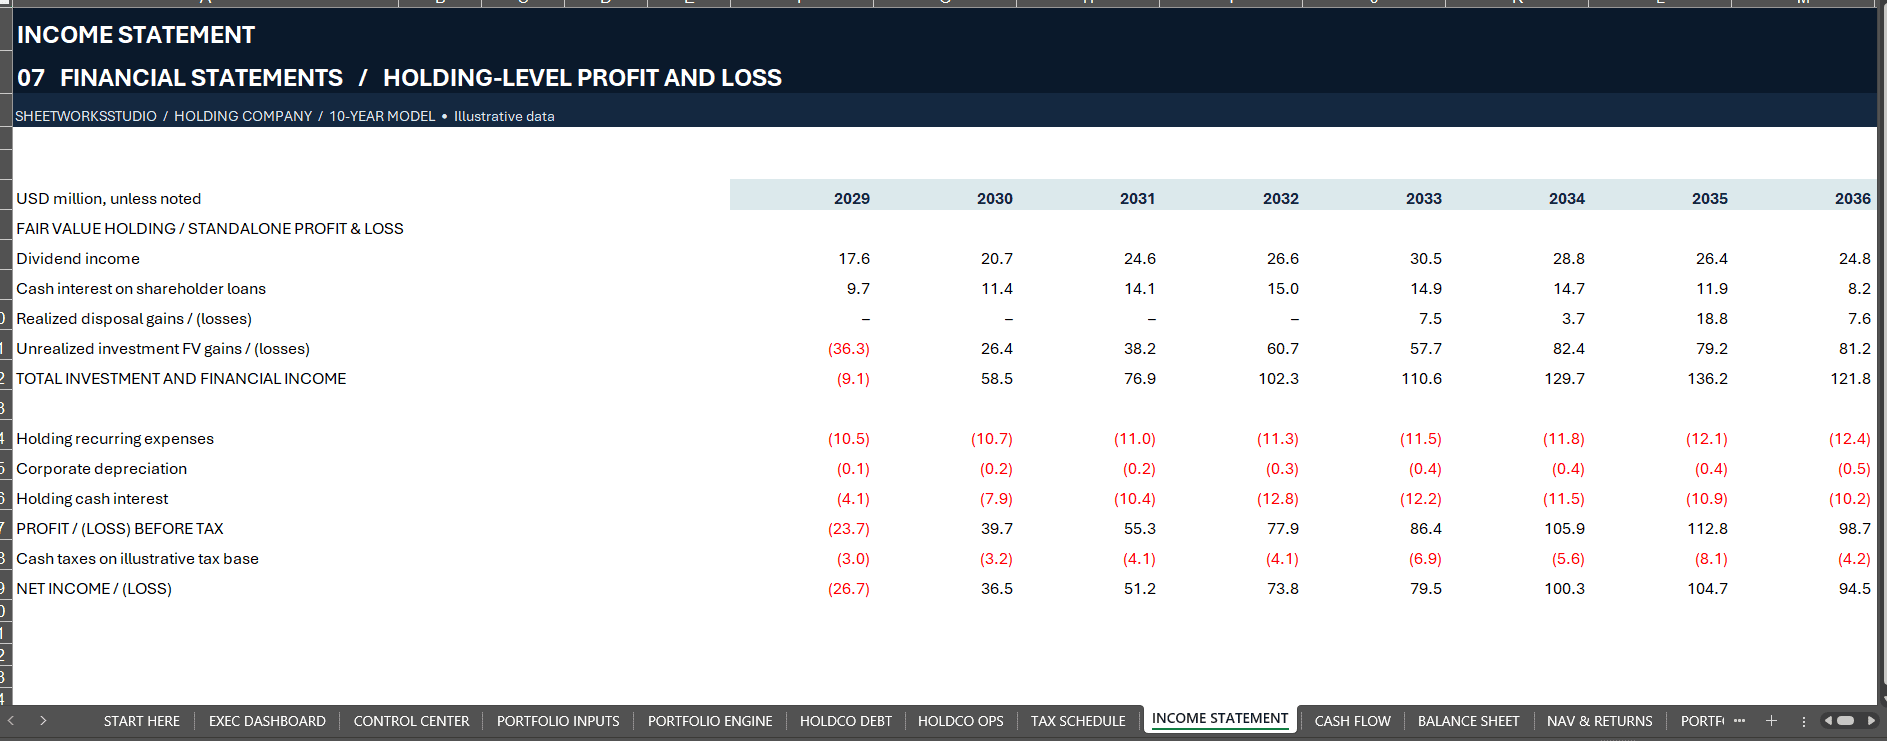
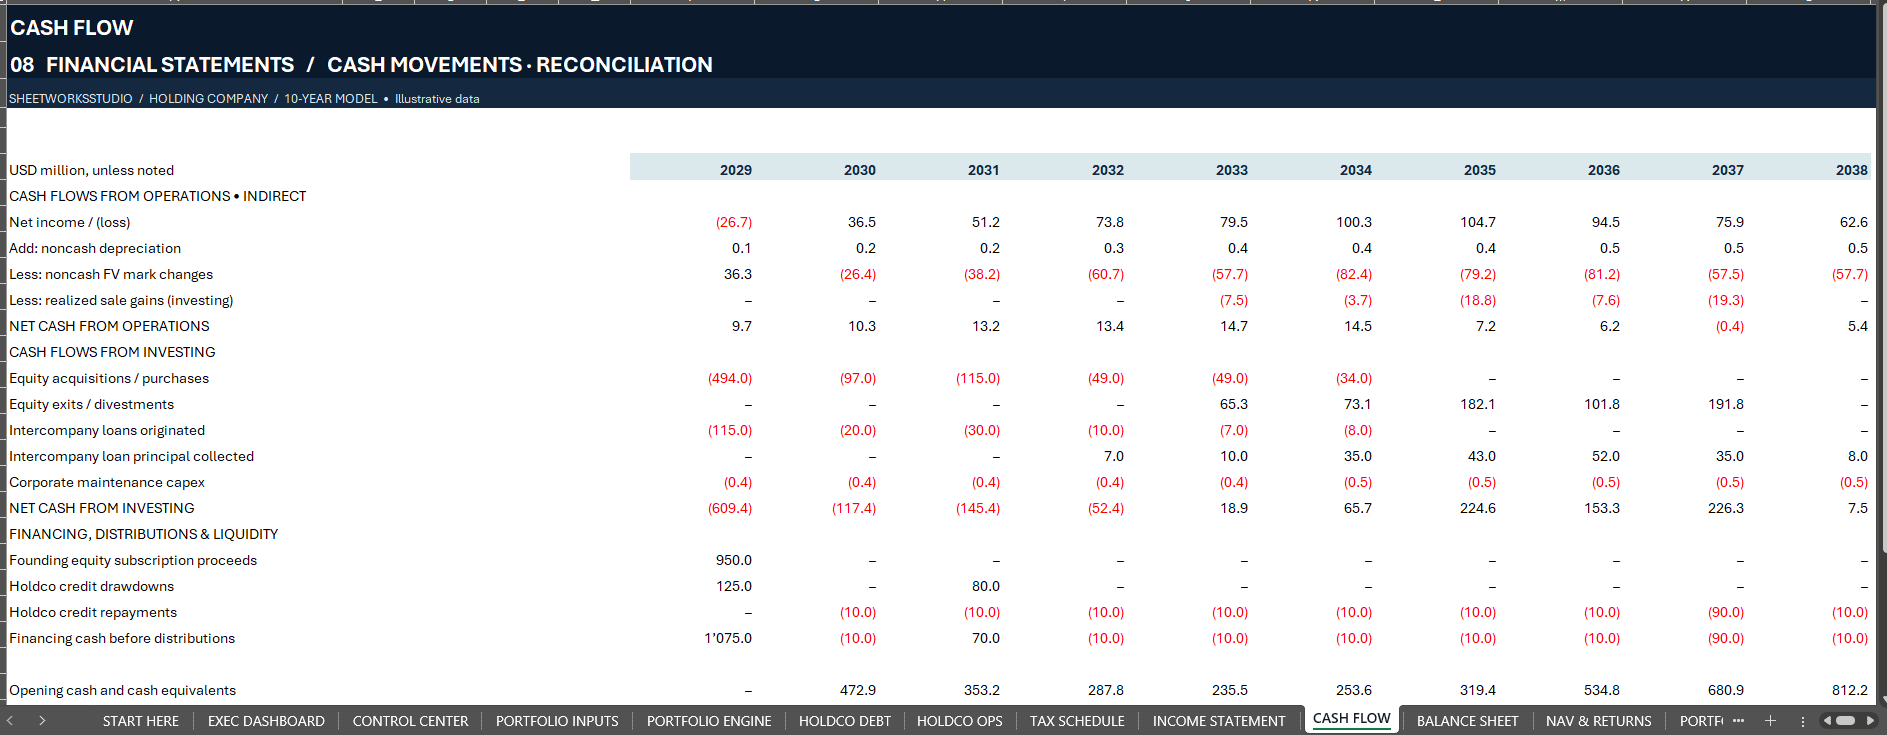
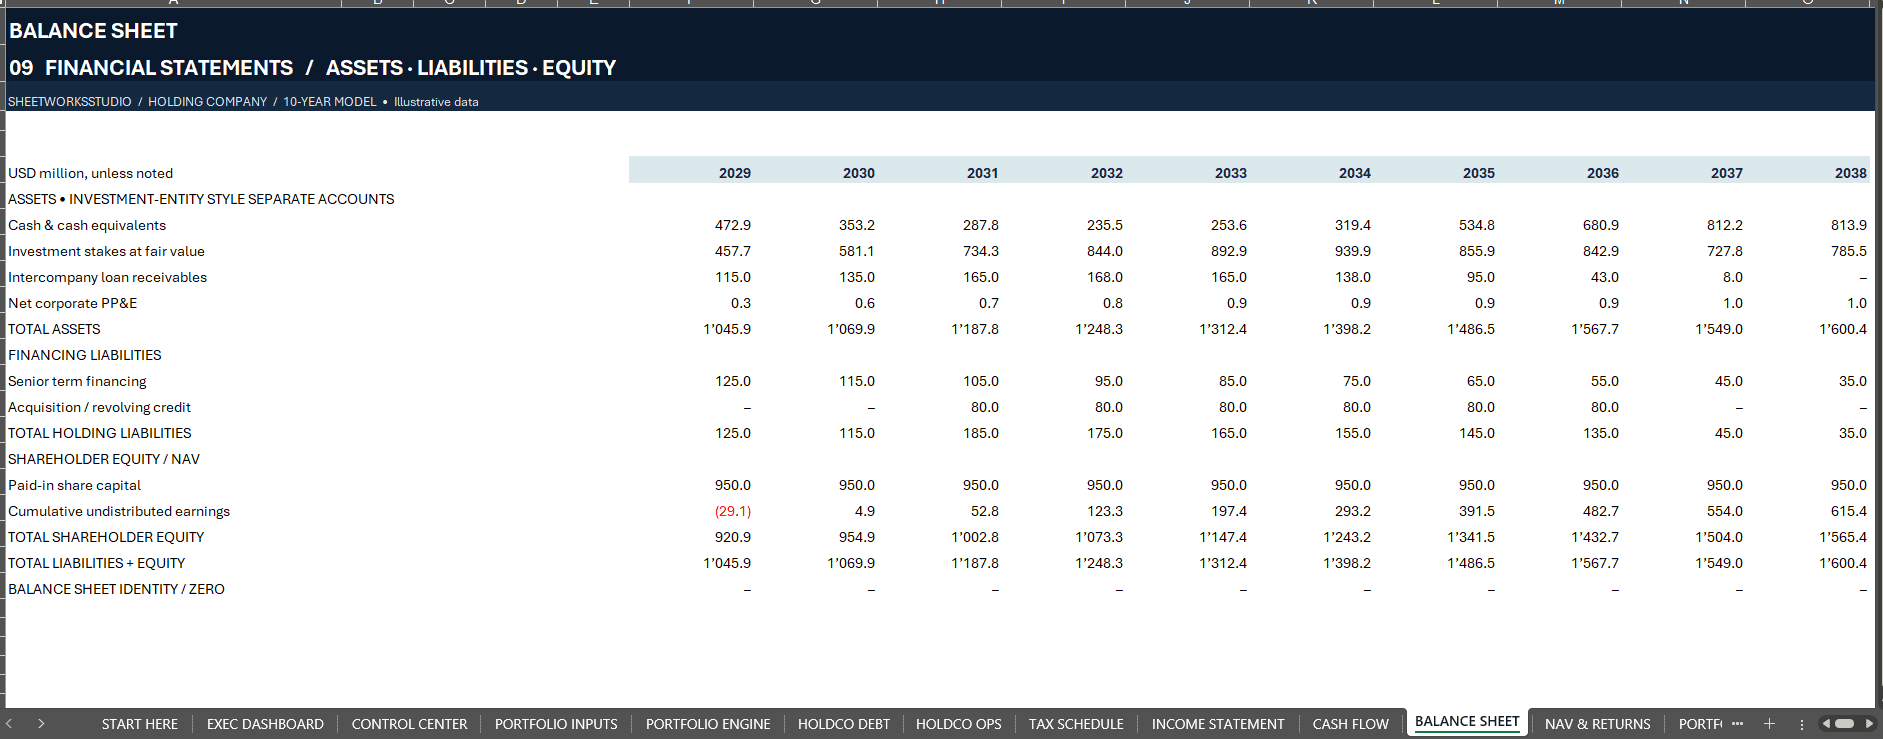
Follow connected Income Statement, Cash Flow Statement and Balance Sheet schedules for the standalone holding company.
Review cash dividends, shareholder-loan interest, realized disposal gains/losses, unrealized fair-value movements, holding overhead, depreciation, financing expense and simplified taxes.
An indirect-method cash flow statement connects earnings to actual investing and financing movements, acquisitions, exits, intercompany loan activity and shareholder distributions.
The balance sheet tracks assets, external borrowing and shareholder equity. A simplified tax schedule includes a loss-carryforward convention.
The underlying portfolio companies are NOT consolidated line by line into holdco revenue or operating expenses. Tax and investment-accounting treatments must be adapted to each jurisdiction and reporting purpose.
🔀 FOUR LINKED SCENARIOS
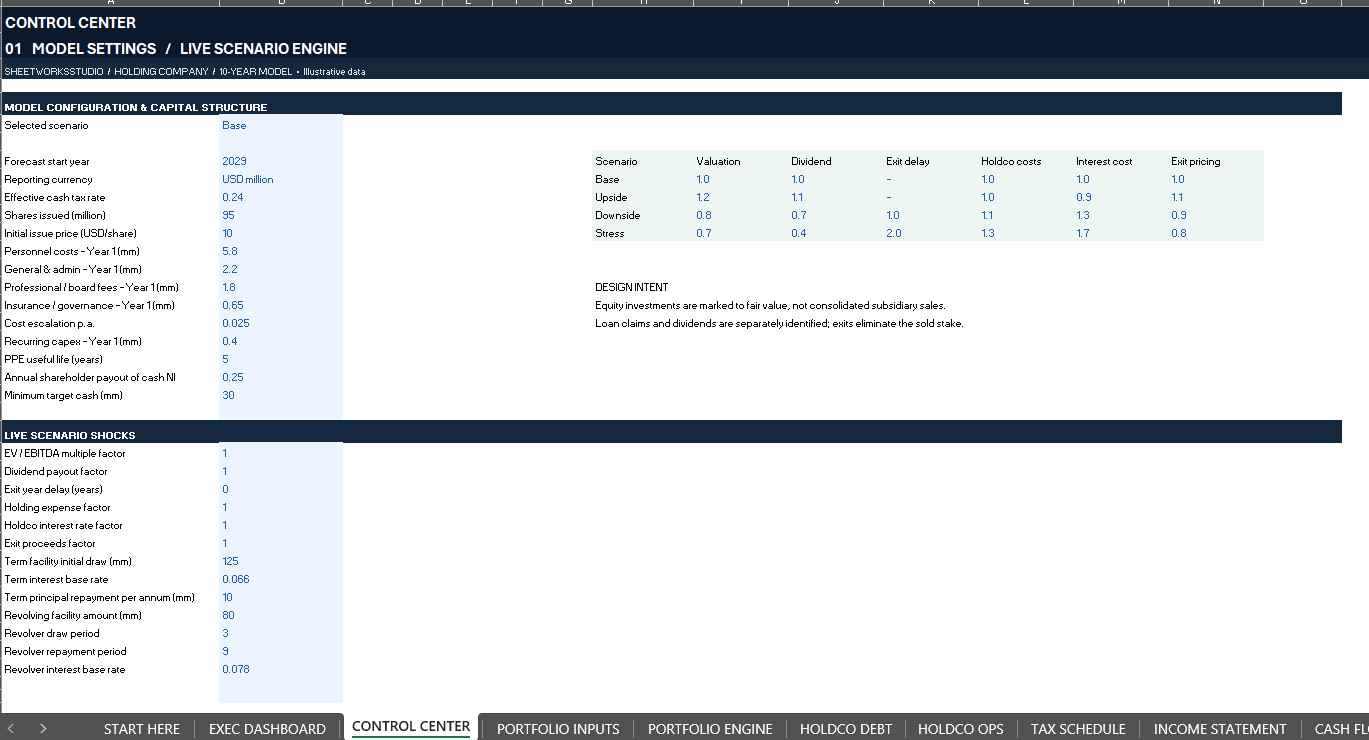
Switch between Base, Upside, Downside and Stress.
Editable case factors affect investment valuation multiples, available portfolio dividends, disposal timing, holding-company expenses, borrowing costs and disposal pricing.
The selected scenario updates the portfolio engine, three financial statements, annual NAV and dashboard indicators.
The four scenarios are alternative illustrative assumption sets. The workbook recalculates one selected scenario at a time; it is not a parallel four-case consolidation or a probability-weighted forecast.
✅ MODEL CHECKS & TRANSPARENT WARNINGS
MODEL CHECKS includes annual tests for balance sheet equality, cash flow reconciliation, debt and portfolio movement, intercompany loan movements, NAV/shareholder equity consistency and other model relationships.
It flags negative cash balances, minimum-cash shortfalls and leverage concerns independently of hard arithmetic errors.
PASS indicates that specified internal checks are satisfied. REVIEW highlights a warning requiring investigation; ERROR indicates a failed financial identity.
Neither a PASS nor a positive NAV independently validates transactions, assumptions, legal compliance or solvency.
📦 WHAT YOU RECEIVE
1 editable Microsoft Excel financial model (.xlsx) with 16 worksheets:
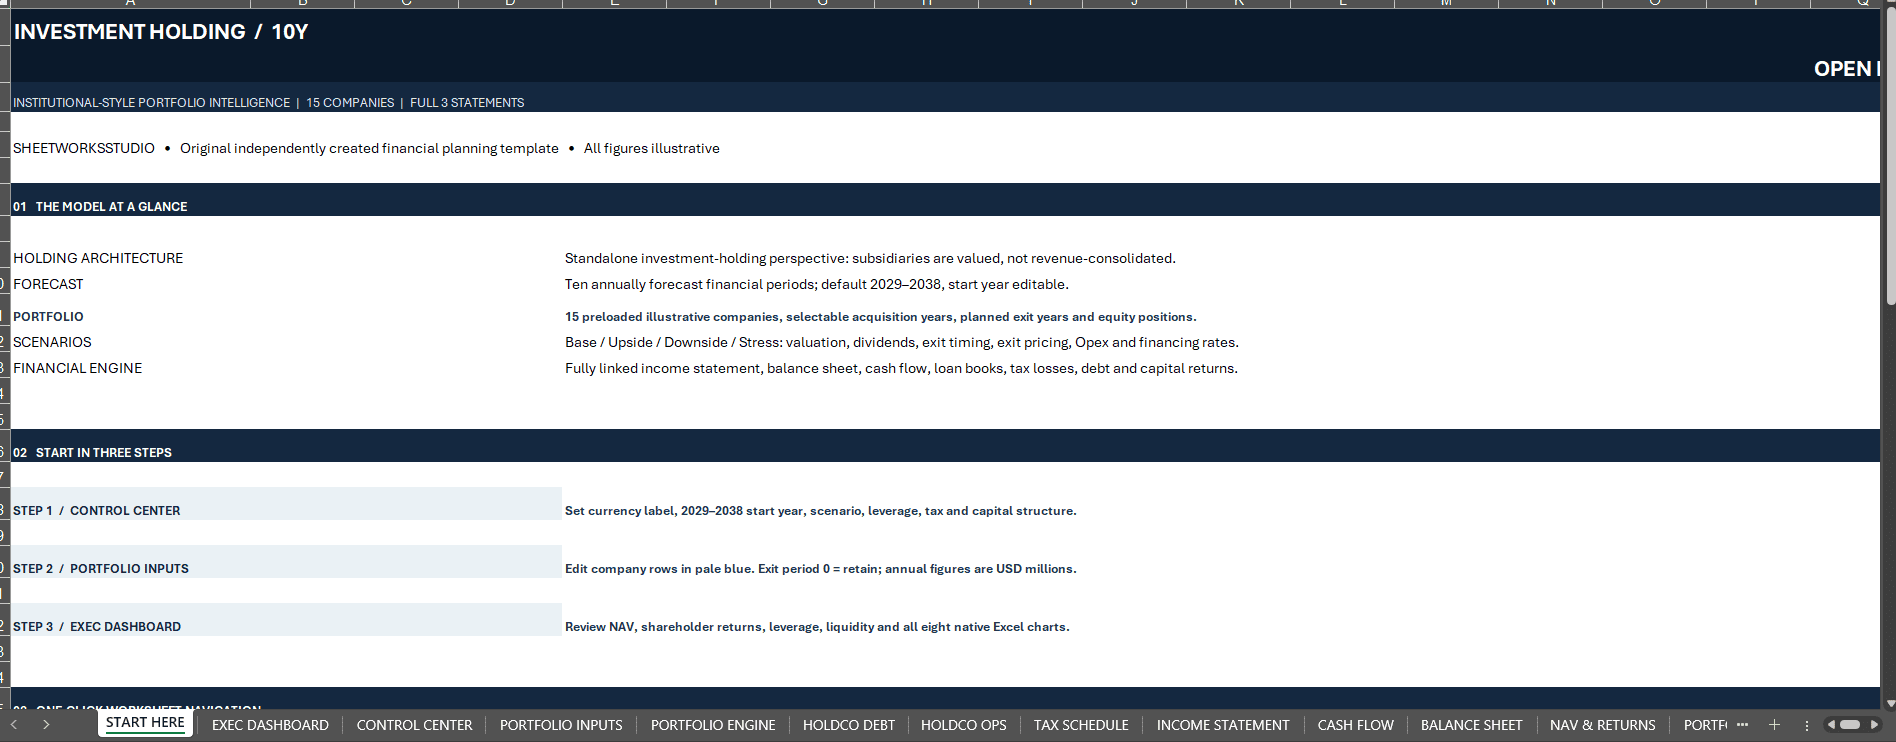
START HERE; EXEC DASHBOARD; CONTROL CENTER; PORTFOLIO INPUTS; PORTFOLIO ENGINE; HOLDCO DEBT; HOLDCO OPS; TAX SCHEDULE; INCOME STATEMENT; CASH FLOW; BALANCE SHEET; NAV & RETURNS; PORTFOLIO RETURNS; MODEL CHECKS; USER GUIDE; SOURCES.
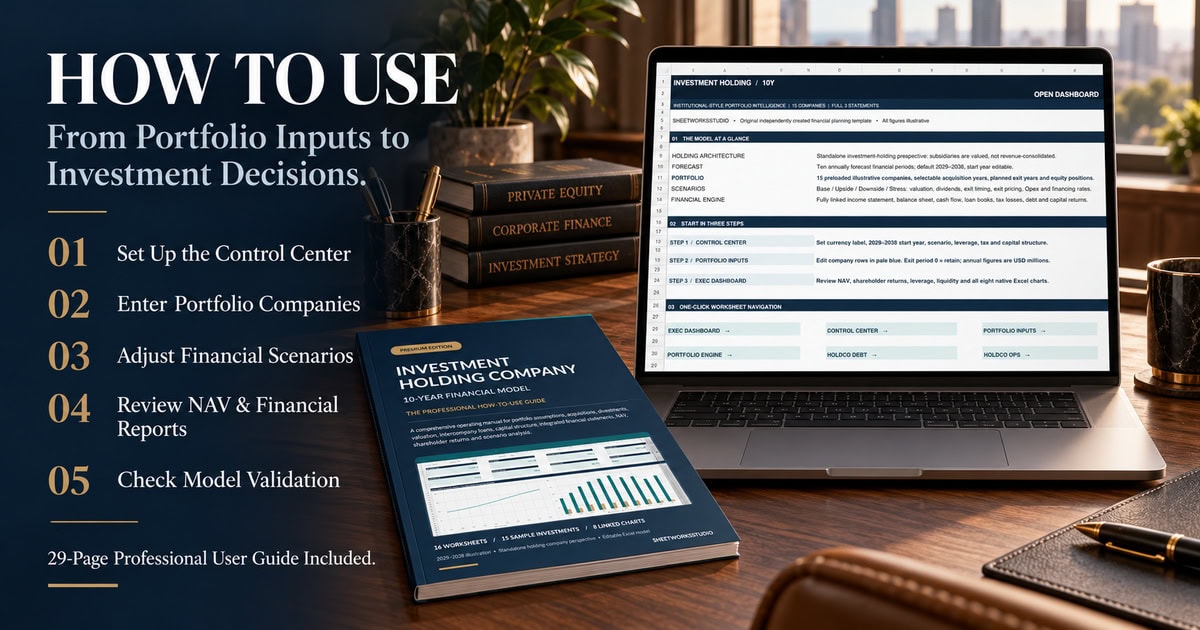
1 professionally designed, 29-page English PDF How-to-Use guide explaining setup, the fifteen investment fields, scenario configuration, operating and financing schedules, shareholder returns, dashboard charts, financial checks, methodology, glossary and troubleshooting.
Model features: ten annual periods, fifteen investment positions, four editable scenarios, eight native Excel dashboard charts, linked holding-company statements and transparent input/formula sections.
🧭 GETTING STARTED
Save a project copy, read START HERE, then update scenario and global assumptions in CONTROL CENTER.
Replace the sample portfolio information in PORTFOLIO INPUTS and validate investment and financing dates.
Review the dashboard, holding cash flow, balance sheet, NAV & RETURNS and MODEL CHECKS after each material change.
⚙ SOFTWARE & COMPATIBILITY
Delivered as macro-free .xlsx and PDF. No VBA add-ins or live external workbook/data connections are required.
Microsoft Excel Desktop is the intended reference environment. A physical desktop Excel open/recalculation/save test and Google Sheets import have not been independently verified for the supplied package; check formulas, scenario switching, charts and formatting after opening or conversion.
The reporting-currency field is a label and does not perform FX translation. Most modeled economic amounts are in millions of the chosen currency, while NAV per share is a per-share figure.
🛡 INDEPENDENT FINANCIAL TEMPLATE DISCLAIMER
This is an independent, unofficial financial-planning template by SheetworksStudio.
It is not a certified, audited, regulator-approved, bank-approved or provider-endorsed investment product.
Example investments and outputs are fictional. The simplified standalone holding valuation, capital structure and tax schedules do not substitute for independently researched valuations, lender review, consolidated statutory accounts or qualified legal, accounting, tax and investment advice.
Digital product only. No physical delivery and no guaranteed investment results.
Bring portfolio valuation, capital allocation, funding and modeled shareholder returns into one transparent, editable ten-year planning framework.
Similar ProductsOther customers were also interested in...



 eFinancialModels
Electric Vehicle (EV) Charging Station Financial M...
With this comprehensive 5- or 10-year monthly tool, investors can assess the viability of setting up... Read more

Financial Model for Mobile App | Mobile App Busine...
The Mobile App Financial Plan Template in Excel allows you to develop financial projections when lau... Read more

 HenrySheykin
Food Truck Financial Model Excel Template
The Food Truck Financial Model helps entrepreneurs, founders, business owners, consultants, and anal... Read more

Green Hydrogen Production from Wind Energy Financi...
The Green Hydrogen from Wind Financial Model aims to comprehensively forecast a horizon of 40 years ... Read more

Simple Mutual Non-Disclosure Agreement Template
Protect your business secrets with ease using our Simple Mutual Non-Disclosure Agreement Template. S... Read more

Solar Energy Financial Model
The Solar Energy Financial Model Spreadsheet Template in Excel assists you in preparing a sophistica... Read more

 Peter Graf
The Customer-Centric Financial Model for Restauran...
Starting a restaurant without a financial plan is like driving a car blindfolded. You wouldn´t do i... Read more
You must log in to submit a review.