
0 ITEMS

ABA Therapy Center Multi-Site Financial Model | 60-Month Forecast, Payer Mix, Staffing, Break-Even & Cash Flow
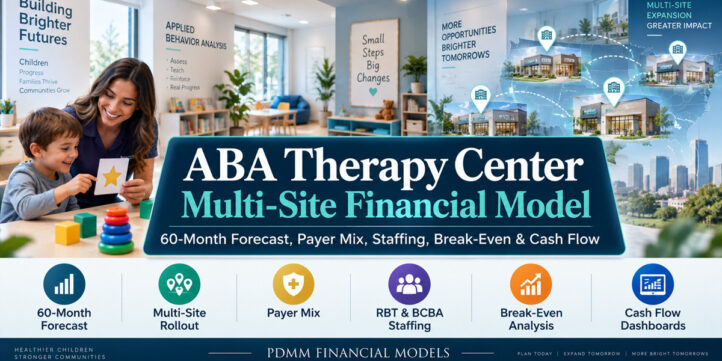
Build a 60-month operating and financial plan for an ABA therapy center platform that may grow across multiple sites. This Excel model connects referrals, authorizations, active census, payer reimbursement, RBT and BCBA capacity, credentialing, scheduling, service mix, revenue, collections, labor cost, site overhead, expansion spending, break-even economics, consolidated profitability, and cash flow in one integrated planning workbook. The model is designed for ABA therapy center owners, operators, finance teams, founders, advisors, lenders, investors, and acquisition teams that need to understand not only how much revenue a center can generate, but also whether clinical staffing, credentialing timing, payer economics, collections, utilization, cancellations, and rollout timing can support that growth.
🧩 ABA Therapy Center Multi-Site Financial Model
Build a 60-month operating and financial plan for an ABA therapy center platform that may grow across multiple sites. This Excel model connects referrals, authorizations, active census, payer reimbursement, RBT and BCBA capacity, credentialing, scheduling, service mix, revenue, collections, labor cost, site overhead, expansion spending, break-even economics, consolidated profitability, and cash flow in one integrated planning workbook.
The model is designed for ABA therapy center owners, operators, finance teams, founders, advisors, lenders, investors, and acquisition teams that need to understand not only how much revenue a center can generate, but also whether clinical staffing, credentialing timing, payer economics, collections, utilization, cancellations, and rollout timing can support that growth.
Seller-supplied and already tested; no Studio workbook audit was performed.
🎯 The buyer problem this model addresses
ABA businesses are operationally complex because demand does not convert directly into revenue. Referral volume must convert into evaluations and authorizations; clients must become active; authorized hours must be scheduled; staffing must exist and be credentialed; cancellations and no-shows reduce delivered hours; payer rates and denials affect realized economics; and collections timing determines when billed revenue becomes cash. A center can appear attractive at the top line while still experiencing staffing bottlenecks, weak cash conversion, high recruiting cost, or delayed site-level break-even.
This workbook brings those linked decisions into one monthly model so users can test how operating assumptions flow through capacity, revenue, EBITDA, and cash.
🛠️ Model workflow
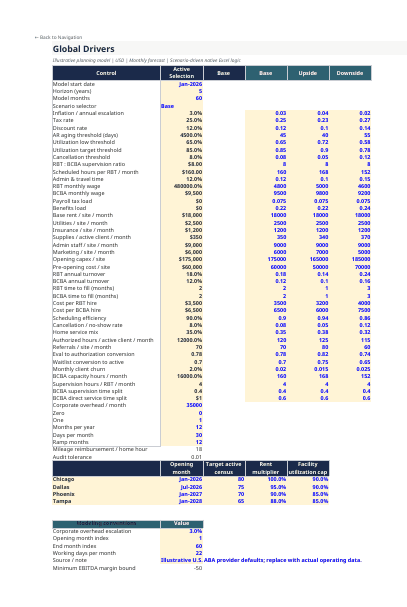
1. Start with Global Drivers to set the model start date, five-year horizon, active scenario, escalation, tax and discount rates, staffing economics, utilization thresholds, turnover, recruiting assumptions, scheduling efficiency, cancellation rates, service mix, authorized hours, referrals, conversion, churn, corporate overhead, and site opening inputs.
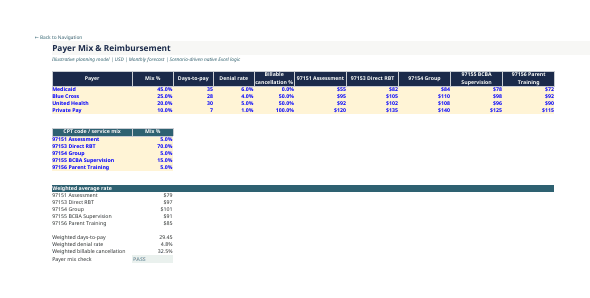
2. Build payer economics in Payer Mix & Reimbursement, including payer mix, days-to-pay, denial rates, billable cancellation assumptions, CPT reimbursement, service weighting, and blended metrics.
3. Translate referral demand into active census in Referral & Census through referral volume, evaluations, authorizations, new clients, churn, waitlist movement, and site capacity.
4. Model clinical delivery capacity through BCBA Capacity, RBT Capacity, and Credentialing Ramp.
5. Convert authorized demand into delivered hours in Scheduling Funnel, then split delivery economics in Service Mix.
6. Build site revenue in Revenue Build and convert billed revenue to collections and receivables in Collections & AR.
7. Calculate labor, recruiting, and site operating costs through Payroll & Labor, Turnover & Recruiting, and Site Opex.
8. Review site contribution, expansion investment, break-even, consolidated profitability, and cash flow.
9. Use the dashboards, site comparison, scenario analysis, and sensitivity tables for management review and decision support.
✏️ Editable assumptions and planning inputs
The workbook includes editable planning drivers for the active scenario and site rollout. Inputs include model timing, Base/Upside/Downside assumptions, inflation, tax rate, discount rate, AR threshold, utilization thresholds, cancellation threshold, RBT-to-BCBA supervision ratio, scheduled hours per RBT, admin and travel time, RBT and BCBA wages, payroll tax and benefits loads, rent, utilities, insurance, supplies, admin payroll, marketing, opening capex, pre-opening cost, turnover, time-to-fill, recruiting cost, scheduling efficiency, home-service mix, authorized hours per client, referrals, authorization conversion, waitlist conversion, churn, BCBA capacity, supervision time, corporate overhead, mileage reimbursement, site opening month, target census, rent multiplier, and facility utilization cap.
Payer-specific assumptions include mix percentages, days-to-pay, denial rates, billable cancellation percentages, and reimbursement rates for illustrative CPT categories including 97151, 97153, 97154, 97155, and 97156.
📚 What the 27 worksheets cover
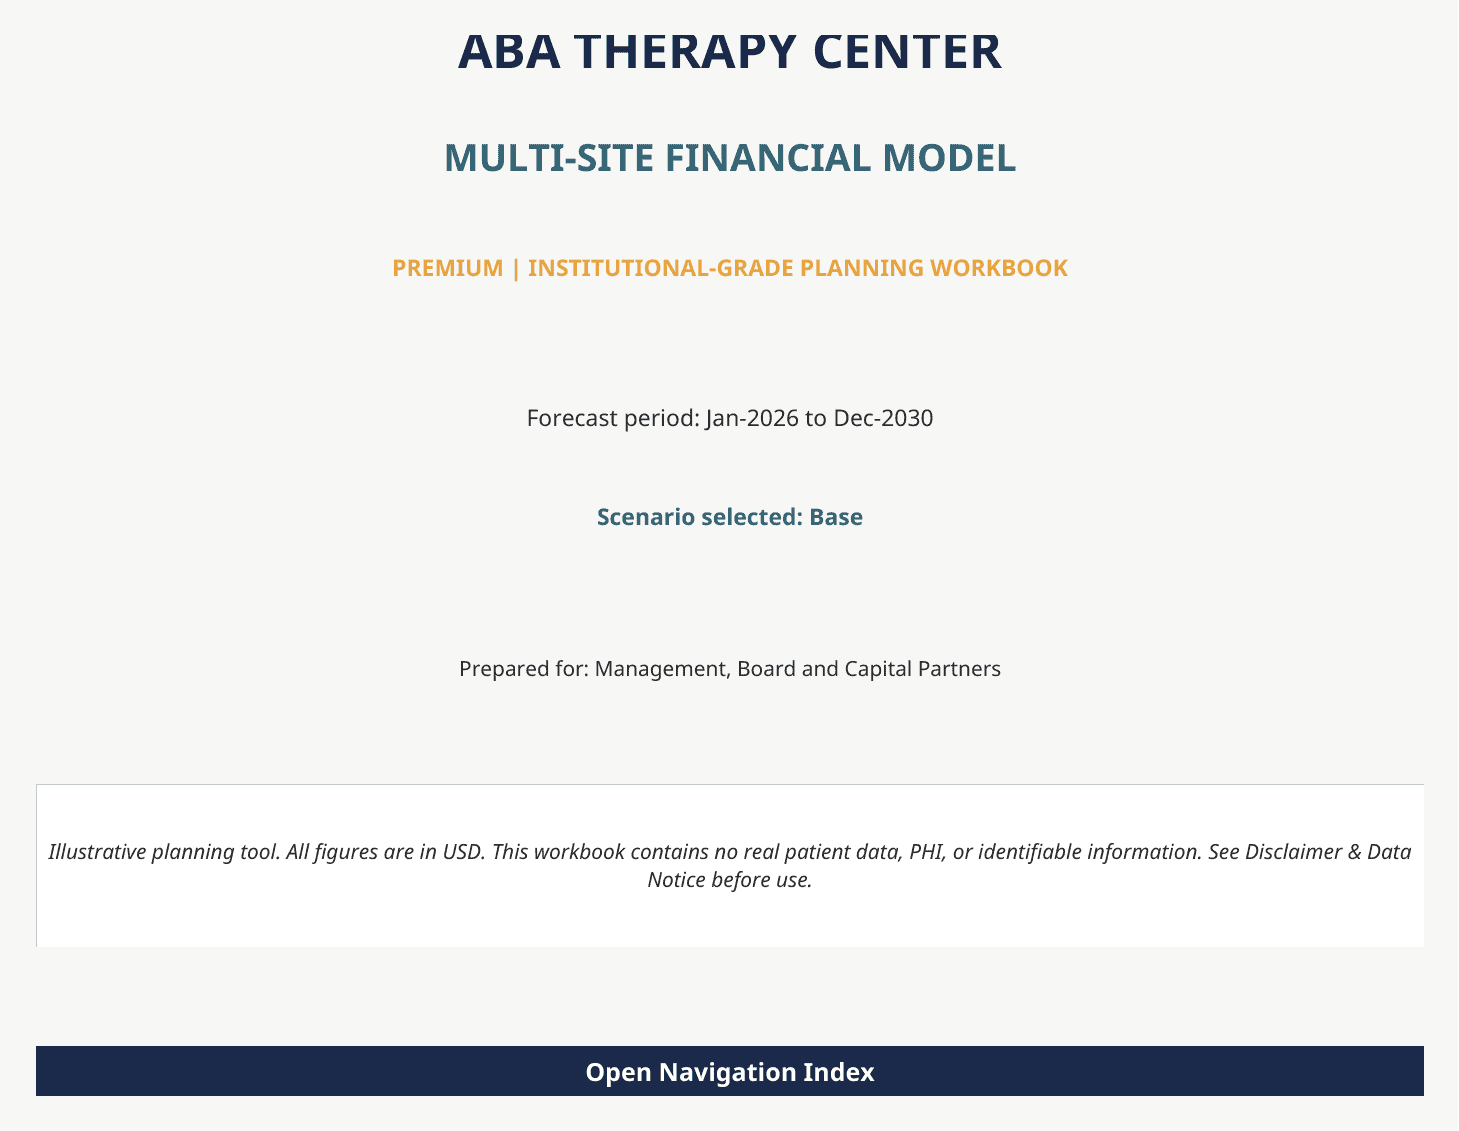
- Cover, Navigation Index, and Disclaimer & Data Notice provide scope, workbook navigation, data-use notices, and the model’s built-in usage guidance.
- Global Drivers centralizes global operating, labor, facility, growth, and site-rollout assumptions with Base, Upside, and Downside cases.
- Payer Mix & Reimb calculates payer-weighted reimbursement, days-to-pay, denial rate, billable cancellation assumptions, and CPT service-rate economics.
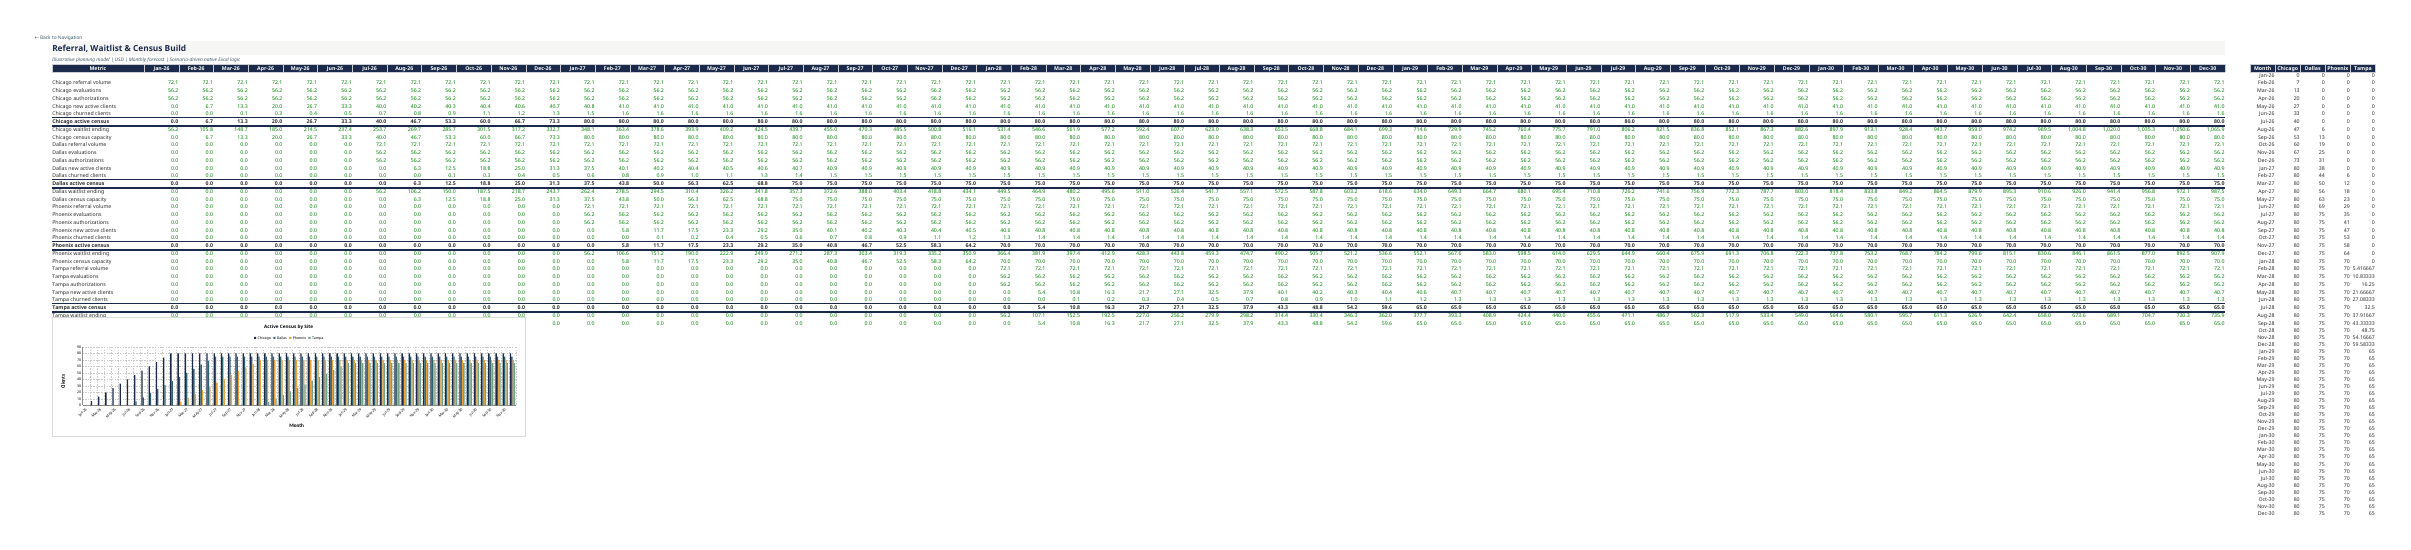
- Referral & Census models site-level referrals, evaluations, authorizations, new active clients, churn, ending waitlist, active census, and census capacity.
- BCBA Capacity models required versus actual BCBA staffing, supervision demand, supervision capacity, direct-service capacity, and shortfall flags.
- RBT Capacity models required RBT FTE, departures, hiring starts, credentialed hires, gross and productive FTE, billable capacity, and utilization.
- Credentialing Ramp translates hiring activity into billable staffing availability and ramped productivity.
- Scheduling Funnel connects authorized hours to scheduled, canceled, capacity-constrained, and billable delivery hours.
- Service Mix separates center-based and home-service delivery and incorporates home-delivery economics.
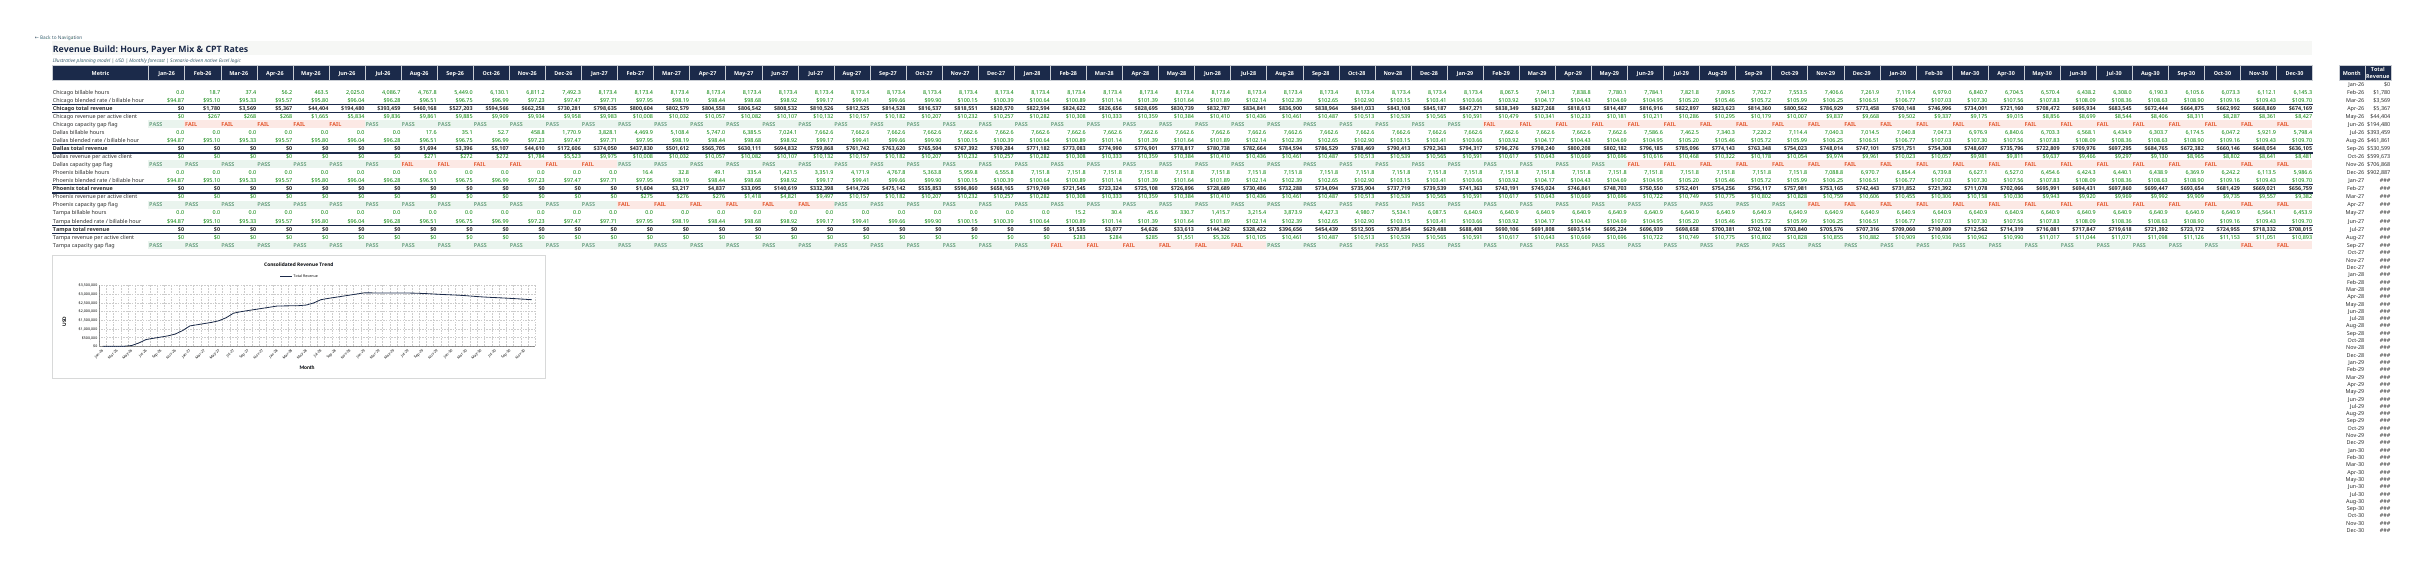
- Revenue Build calculates CPT-weighted blended rates and site-level monthly revenue.
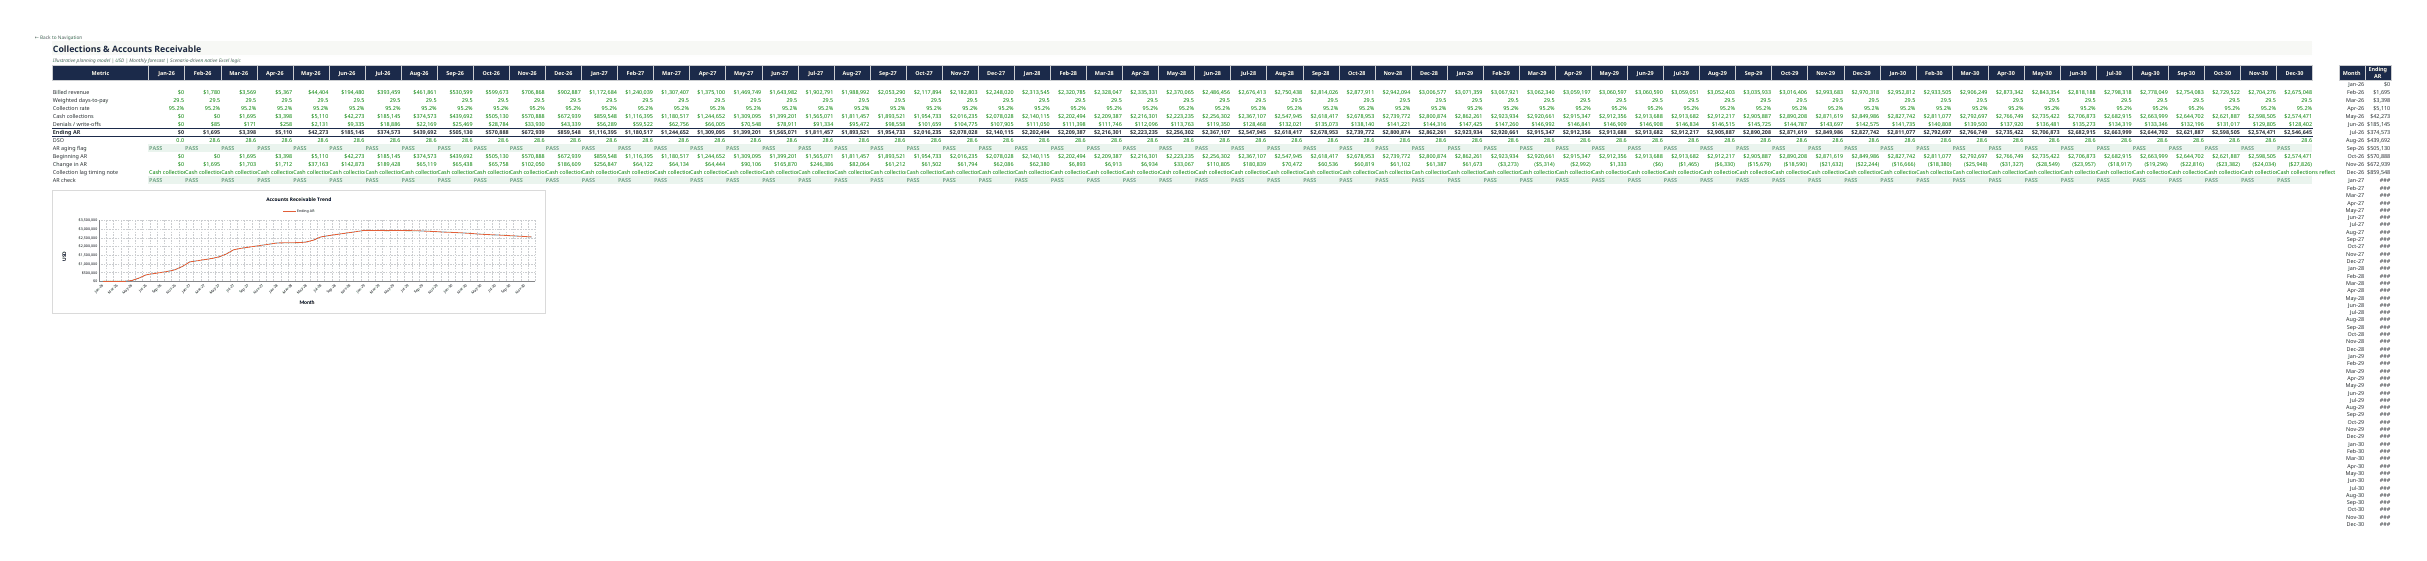
- Collections & AR models collections, denial/write-off drag, accounts receivable movement, and DSO-style cash-conversion indicators.
- Payroll & Labor calculates loaded RBT and BCBA labor cost by site.
- Turnover & Recruiting estimates departures, hiring spend, capacity drag, turnover indicators, and hiring cost per productive FTE.
- Site Opex models rent, utilities, insurance, supplies, administration, marketing, mileage, and total site operating expense.
- Site P&L shows revenue, direct labor, site operating expense, and site contribution / EBITDA by location.
- Expansion & Rollout models date-driven openings, ramp percentages, target census, opening capex, and pre-opening cost.
- CM & BreakEven evaluates contribution margin per active child and site-level break-even census.
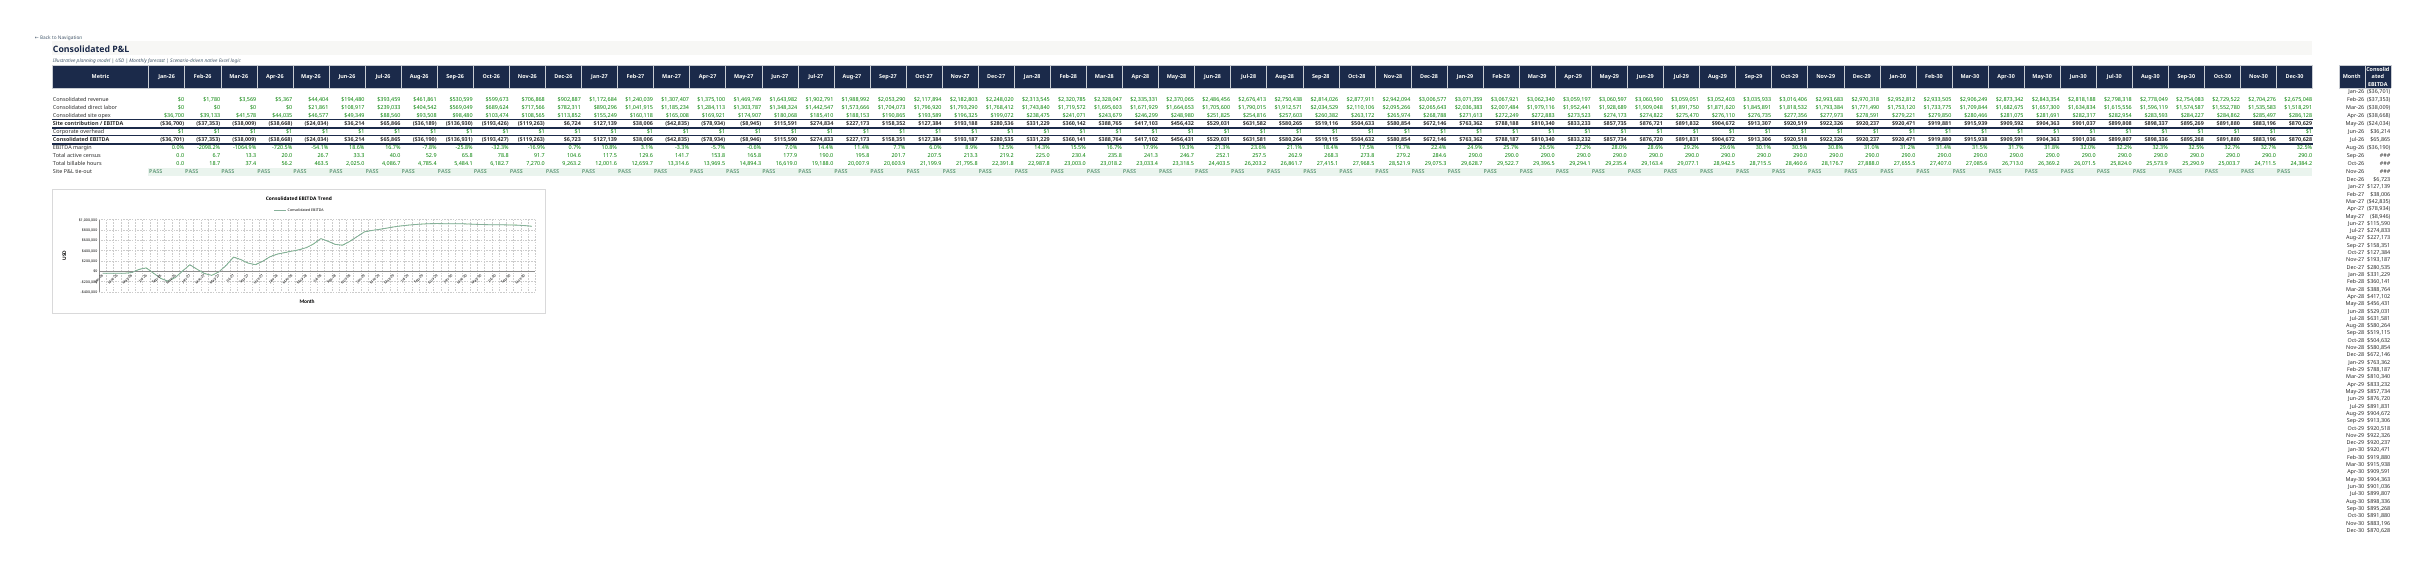
- Consolidated P&L rolls site results into consolidated revenue, direct labor, operating expense, EBITDA, margin, census, and billable hours.
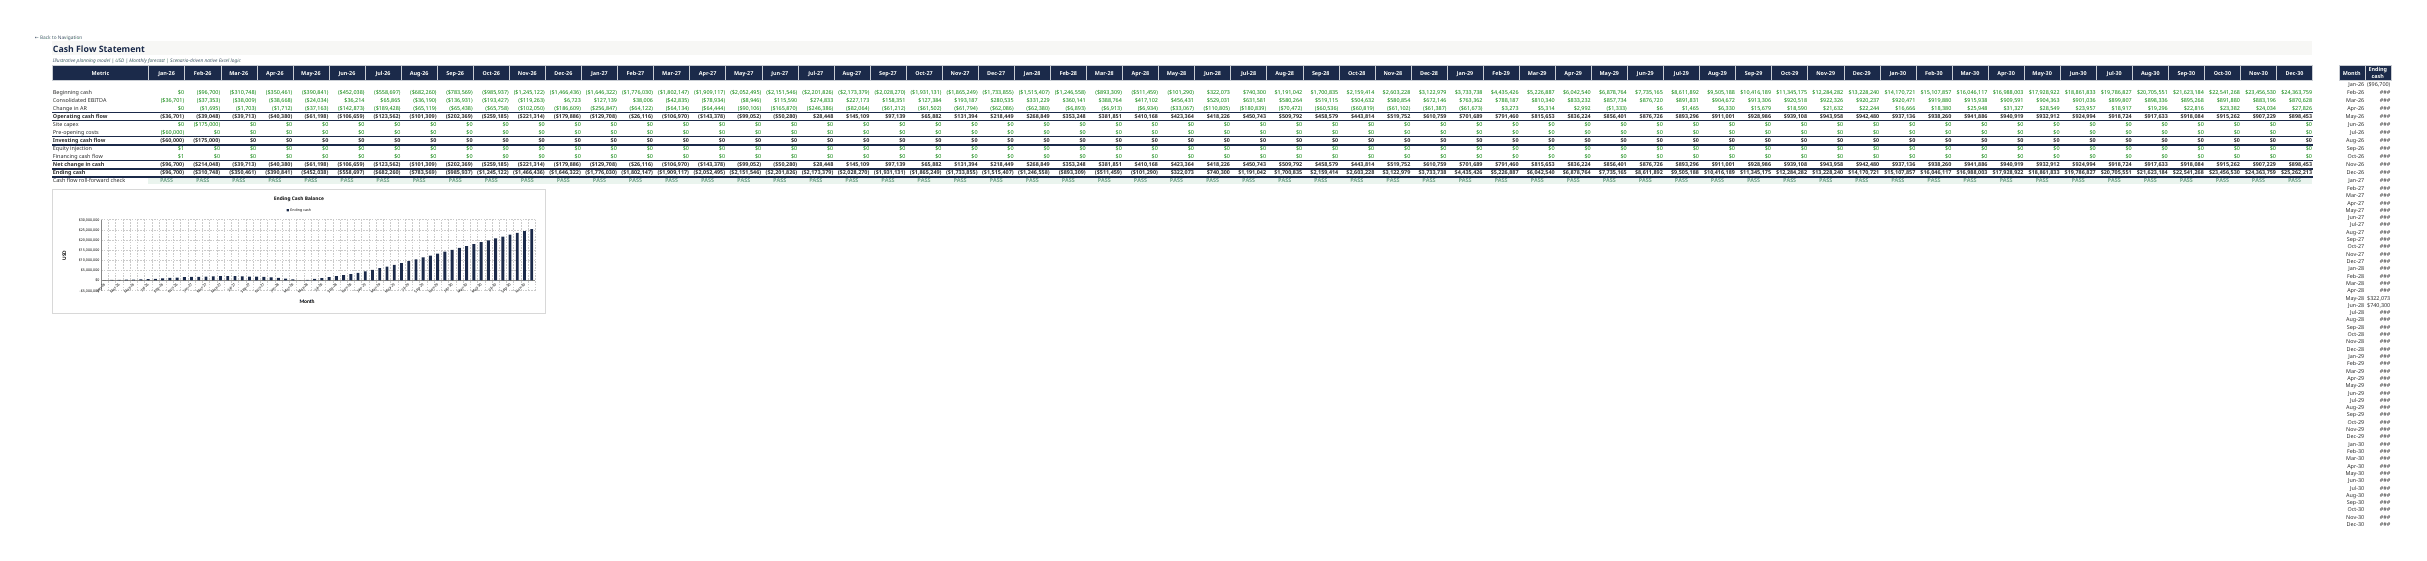
- Cash Flow bridges EBITDA, AR movement, capex, pre-opening costs, financing, and ending cash.
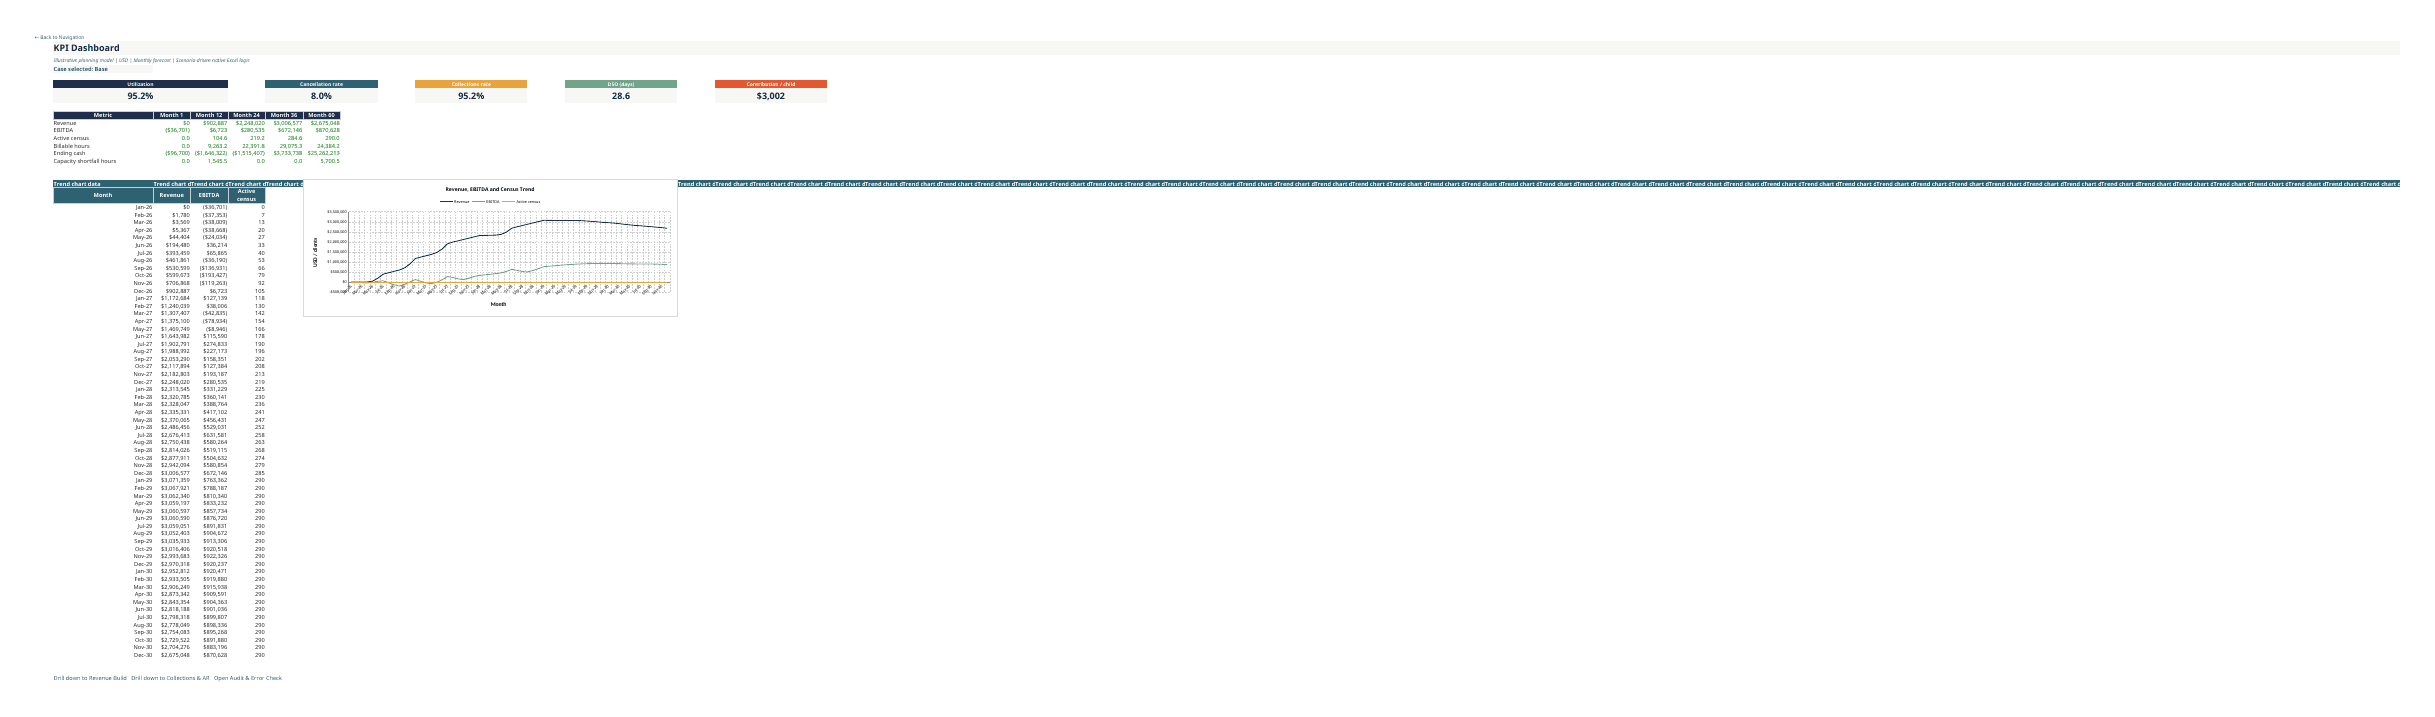
- KPI Dashboard presents operating and financial KPIs across selected months, including revenue, EBITDA, active census, billable hours, cash, utilization, cancellation, and capacity indicators.
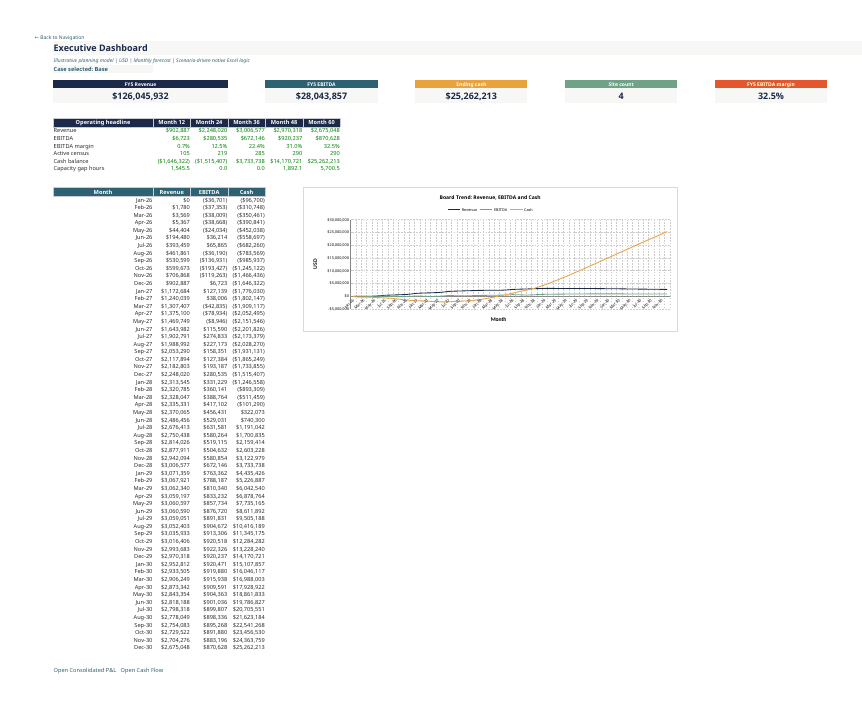
- Executive Dashboard provides a management and board-level summary with FY5 headline outputs and 60-month trend views.
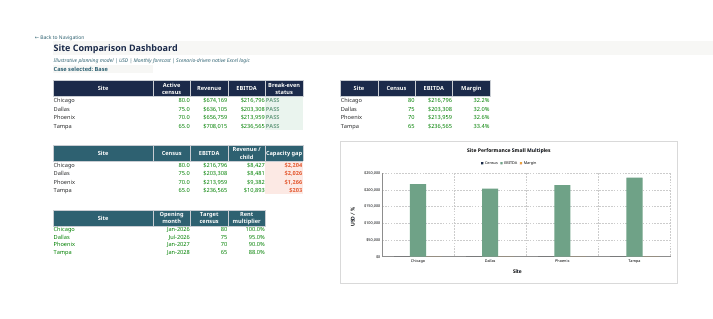
- Site Comparison compares locations on census, revenue, EBITDA, break-even status, revenue per child, capacity gap, opening month, and rollout assumptions.
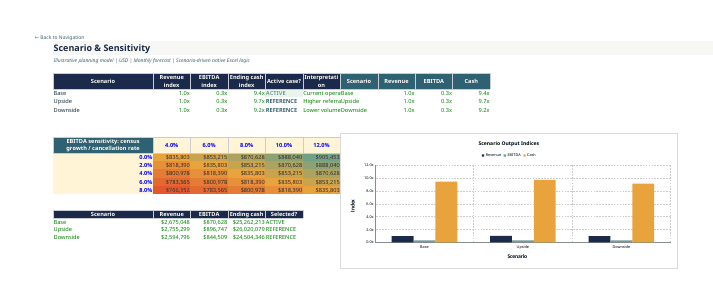
- Scenario & Sensitivity compares Base, Upside, and Downside case indices and includes EBITDA sensitivity to census growth and cancellation-rate changes.
- Audit & Error Check is the workbook’s own formula-driven health-check page for internal model monitoring.
- Notes & Methodology explains core modeling conventions, payer blending, capacity logic, collections methodology, break-even mechanics, sample CPT categories, and data-handling notes.
📊 Scenarios, sensitivities, KPIs, and management views
The active scenario selector supports Base, Upside, and Downside cases across major operating assumptions. The scenario page provides comparative revenue, EBITDA, ending-cash, and active-case views. Sensitivity analysis focuses on how census growth and cancellation-rate changes affect EBITDA.
Key operational and financial indicators include active census, referral conversion, waitlist progression, RBT and BCBA staffing, credentialing ramp, productive capacity, utilization, authorized and billable hours, cancellation rate, payer-weighted reimbursement, denial drag, collections, AR, DSO-style measures, recruiting cost, site contribution, break-even census, consolidated EBITDA margin, cash balance, and capacity gaps.
✅ Practical use cases
- Build a five-year monthly business plan and operating forecast for an ABA therapy center platform.
- Forecast active census, referrals, waitlist conversion, authorizations, and churn by site.
- Test payer mix, reimbursement, denial, and days-to-pay assumptions before budgeting revenue.
- Plan RBT and BCBA staffing capacity, supervision coverage, credentialing delays, and utilization.
- Evaluate scheduling efficiency, cancellations, no-shows, and billable-hour conversion.
- Analyze site profitability, contribution margin, EBITDA, and break-even census.
- Forecast collections, accounts receivable, and cash-flow timing as the platform scales.
- Compare Base, Upside, and Downside scenarios for operating and financial planning.
- Run sensitivity analysis around census growth and cancellation rates to identify EBITDA pressure points.
- Assess multi-site rollout timing, opening capex, pre-opening cost, and ramp economics.
- Compare locations using site-level KPIs, revenue per child, EBITDA, break-even status, and capacity gaps.
- Support budgeting, lender discussions, investor review, acquisition screening, and management reporting with a connected operating model.
👥 Intended users
This model is suited to ABA therapy center founders and owners, multi-site operators, CFOs and finance teams, practice administrators, healthcare consultants, transaction advisors, lenders, independent sponsors, private equity teams, and investors evaluating operating performance or expansion plans.
📦 Delivered files
- One client-ready `.xlsx` workbook with the exact seller-supplied completed model.
- One 27-page full-sheet PDF preview with one worksheet per page.
The workbook uses native Excel formulas and charts and is supplied in `.xlsx` format. All modeled figures are in USD, and the model’s pre-populated assumptions are illustrative planning inputs intended to be replaced with the buyer’s own operating data where appropriate.
Similar ProductsOther customers were also interested in...



 eFinancialModels
Electric Vehicle (EV) Charging Station Financial M...
With this comprehensive 5- or 10-year monthly tool, investors can assess the viability of setting up... Read more

Financial Model for Mobile App | Mobile App Busine...
The Mobile App Financial Plan Template in Excel allows you to develop financial projections when lau... Read more

 HenrySheykin
Food Truck Financial Model Excel Template
The Food Truck Financial Model helps entrepreneurs, founders, business owners, consultants, and anal... Read more

Green Hydrogen Production from Wind Energy Financi...
The Green Hydrogen from Wind Financial Model aims to comprehensively forecast a horizon of 40 years ... Read more

Simple Mutual Non-Disclosure Agreement Template
Protect your business secrets with ease using our Simple Mutual Non-Disclosure Agreement Template. S... Read more

Solar Energy Financial Model
The Solar Energy Financial Model Spreadsheet Template in Excel assists you in preparing a sophistica... Read more

 Peter Graf
The Customer-Centric Financial Model for Restauran...
Starting a restaurant without a financial plan is like driving a car blindfolded. You wouldn´t do i... Read more
You must log in to submit a review.