
0 ITEMS

Food Truck & Coffee Truck Financial Model | 5-Year Forecast, 3-Statement, Break-Even, Scenario, Sensitivity & DCF
🚚☕ Build a five-year operating and financial plan for a phased mobile food-and-coffee fleet in one integrated Excel workbook. This model is designed for founders, operators, advisors, lenders, investors and finance teams that need more than a simple revenue-and-expense template. It connects truck launch timing, day-part demand, transaction volume, ticket size, seasonality, staffing, materials, operating costs, capital expenditure, working capital and debt funding into a 60-month forecast with annual summaries, three financial statements, break-even analysis, unit economics, scenarios, sensitivities and DCF valuation. Seller-supplied and already tested; no Studio workbook audit was performed.

Food Truck & Coffee Truck Financial Model
🚚☕ Build a five-year operating and financial plan for a phased mobile food-and-coffee fleet in one integrated Excel workbook. This model is designed for founders, operators, advisors, lenders, investors and finance teams that need more than a simple revenue-and-expense template. It connects truck launch timing, day-part demand, transaction volume, ticket size, seasonality, staffing, materials, operating costs, capital expenditure, working capital and debt funding into a 60-month forecast with annual summaries, three financial statements, break-even analysis, unit economics, scenarios, sensitivities and DCF valuation.
Seller-supplied and already tested; no Studio workbook audit was performed.
🎯 The buyer problem this model solves
A mobile food business can look profitable on a per-sale basis while still consuming cash because trucks are commissioned at different dates, equipment is funded differently, staffing scales unevenly, seasonal demand changes month by month, and working-capital or debt-service needs do not move in the same pattern as revenue. A combined food-truck and coffee-truck concept adds another layer because the two formats have different operating days, day-parts, average tickets, ancillary revenue streams and direct-cost profiles.
This workbook brings those decisions into one linked model. The sample build supports a phased five-unit fleet with separate food and coffee truck economics, while the Assumptions & Drivers sheet lets the user change which units are included, each unit’s type and launch month, and the operating and financing assumptions that drive the forecast.
🧭 Model workflow
1. Start on Assumptions & Drivers, the workbook’s central input sheet.
2. Set the active Best / Base / Worst scenario.
3. Configure fleet inclusion, truck type and commissioning month.
4. Adjust operating days, demand indices, day-part transactions per hour, service hours, average tickets, events/catering, retail sales, seasonality and annual growth.
5. Update food/beverage costs, packaging, waste, staffing, wage rates, payroll burden, benefits, operating expenses, startup costs and capital expenditure.
6. Set working-capital terms, founder equity, term debt, equipment finance, revolver, tax and valuation assumptions.
7. Review the Executive Dashboard, then drill into the operating schedules, statements, break-even, unit economics, scenario, sensitivity, ratios and DCF sheets.
✏️ Editable inputs and operating drivers
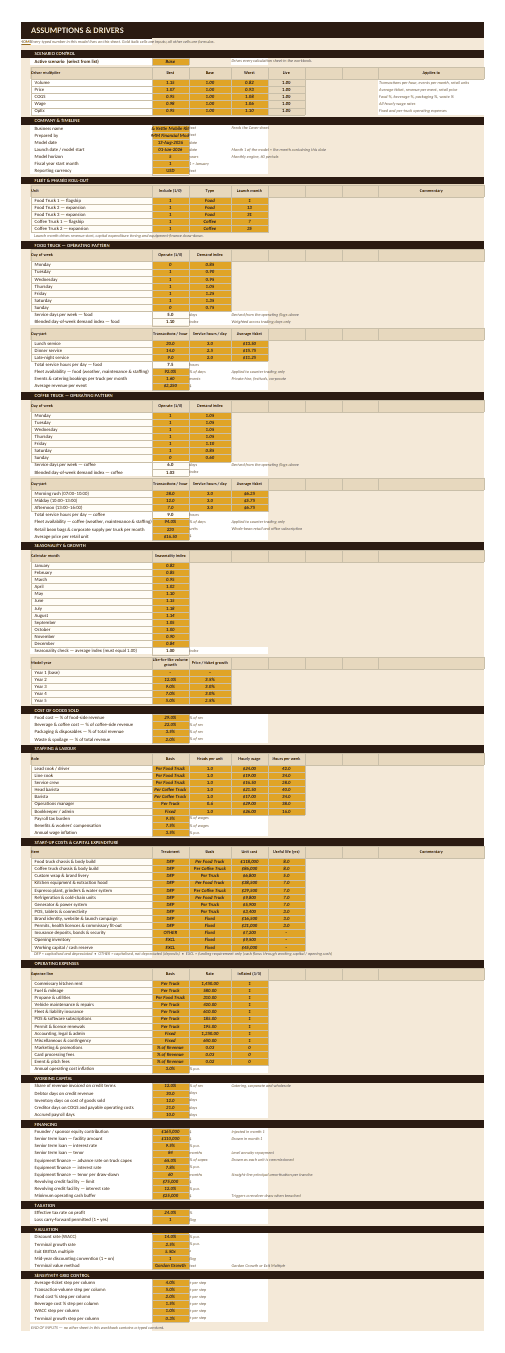
The input architecture includes scenario multipliers for volume, price, COGS, wages and operating expenses; business timeline and reporting currency; fleet rollout; food-truck and coffee-truck weekly operating patterns; day-part transaction rates, hours and average tickets; fleet availability; event/catering revenue; retail coffee and corporate supply; monthly seasonality; like-for-like volume growth and price growth; direct material cost rates; staffing roles, heads per unit, wages and hours; payroll burden and benefits; capex items and useful lives; fixed, per-truck and revenue-linked operating expenses; debtor, inventory, creditor and accrued-payroll days; equity and debt terms; tax assumptions; WACC, terminal growth, exit multiple and sensitivity steps.
📊 What is inside the 25-sheet workbook
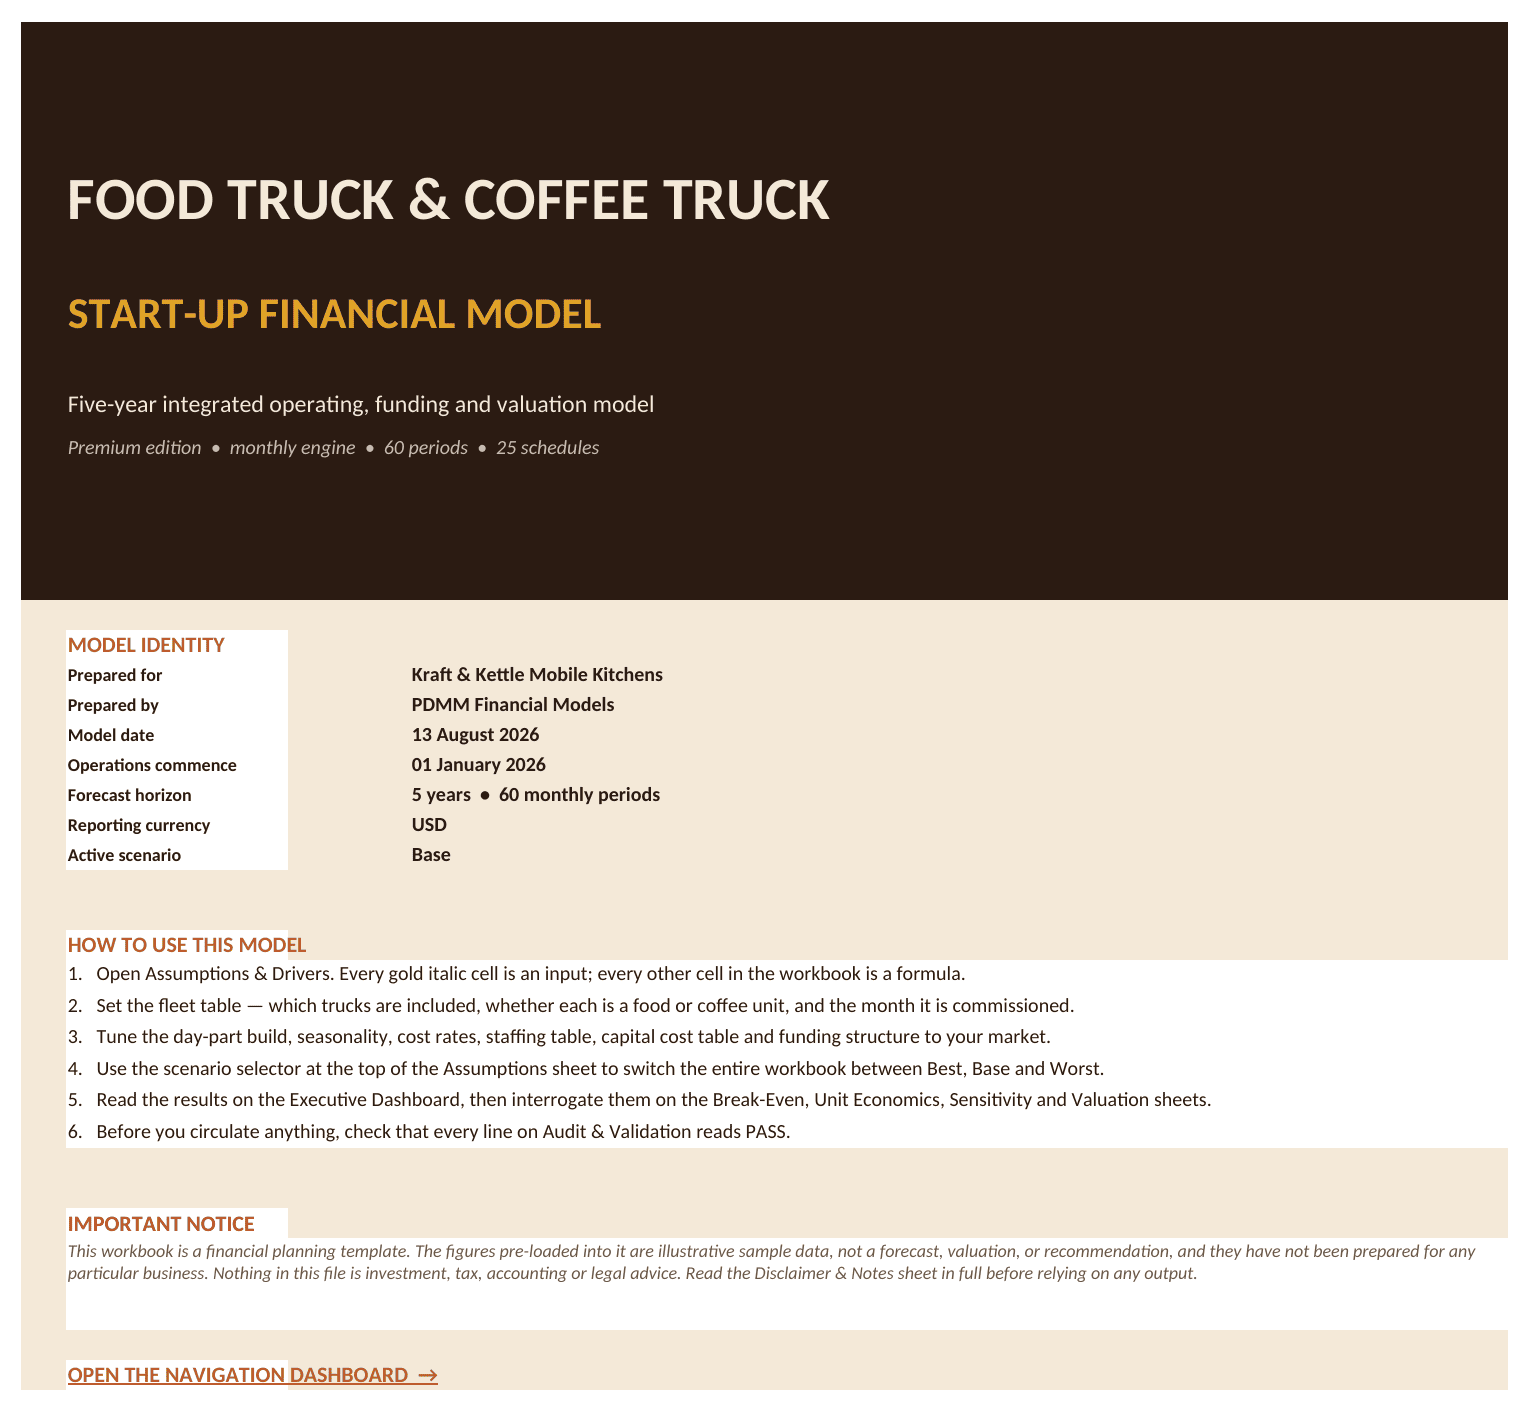
- Cover and Navigation Dashboard provide model identity, use instructions and links across all schedules.
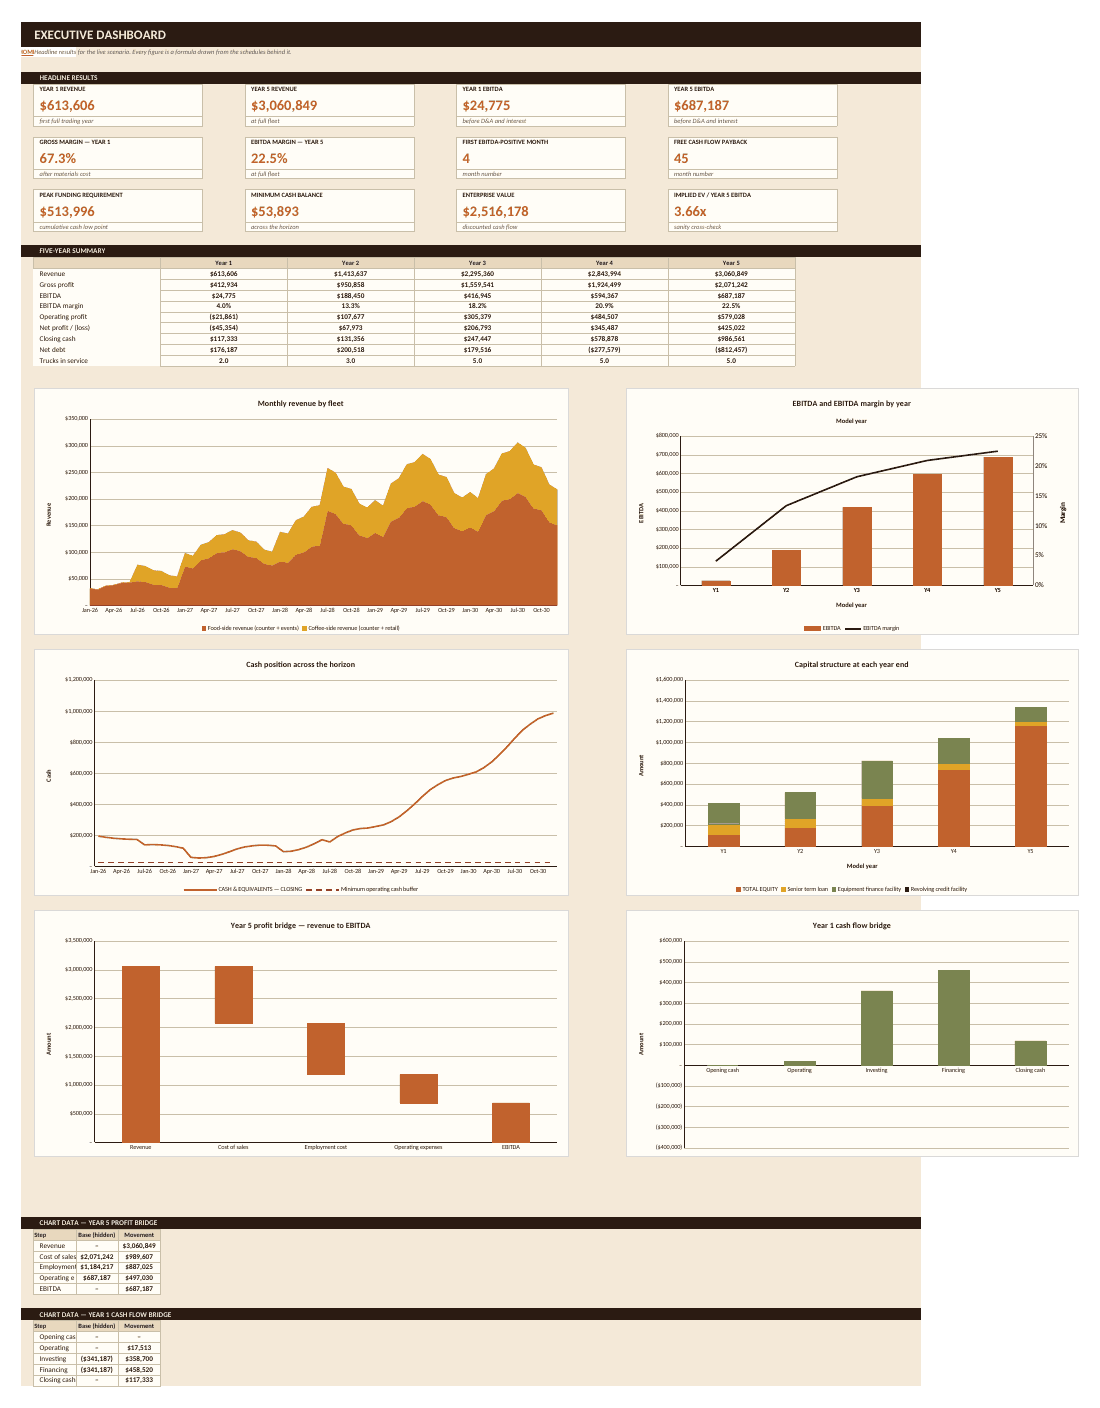
- Executive Dashboard summarizes Year 1 and Year 5 revenue and EBITDA, gross margin, EBITDA margin, first EBITDA-positive month, free-cash-flow payback, peak funding requirement, minimum cash balance, enterprise value and implied EV/Year 5 EBITDA, supported by revenue, margin, cash, capital-structure and bridge charts.
- Assumptions & Drivers centralizes the model’s editable inputs and the live scenario selector.
- Revenue – Food Truck and Revenue – Coffee Truck build revenue separately from operating pattern, day-parts and each format’s ancillary streams.
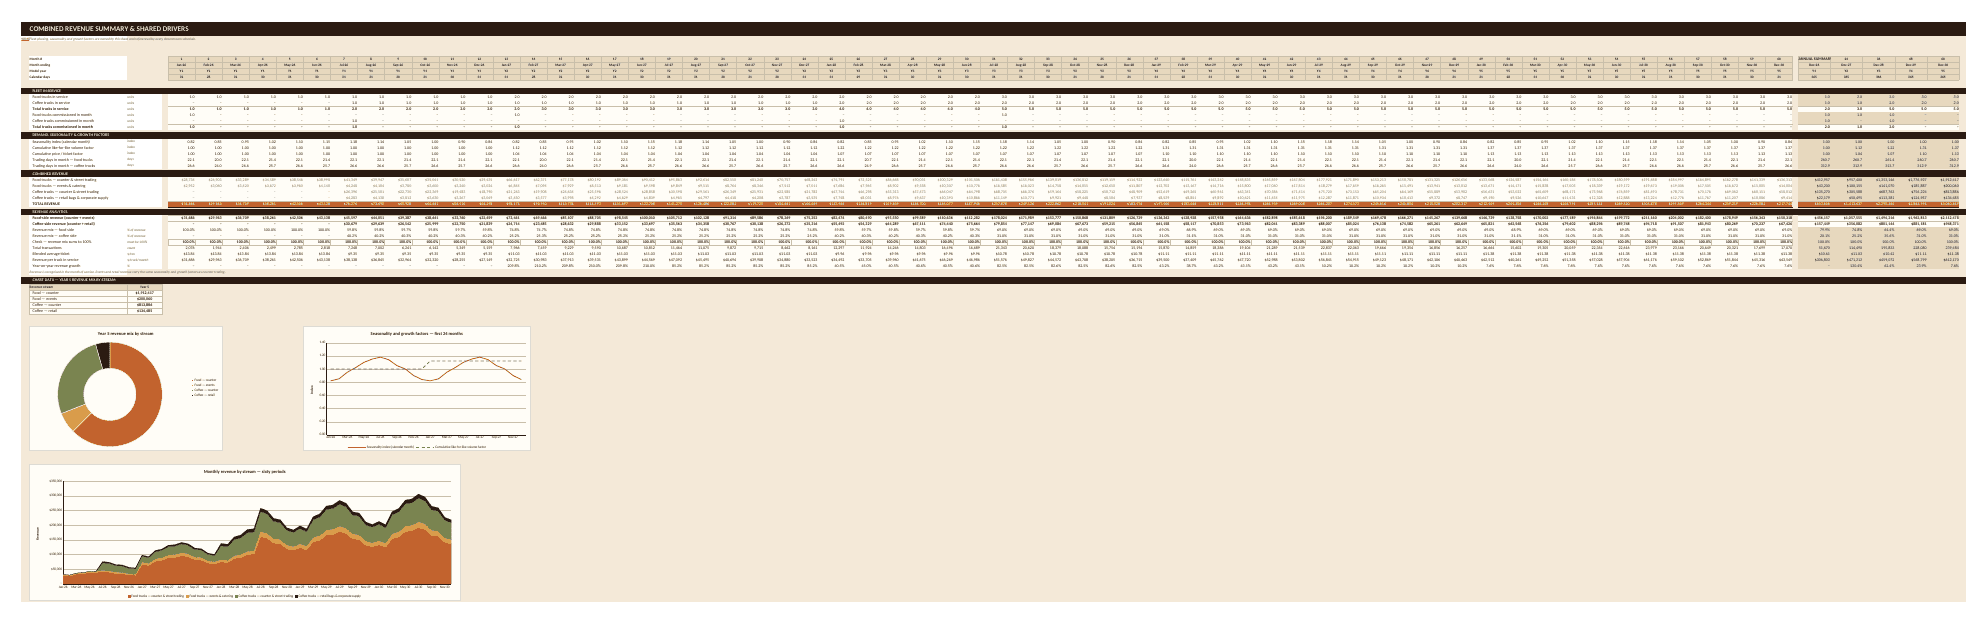
- Revenue Summary combines fleet phasing, seasonality, growth and the two revenue engines into the 60-month total.
- COGS calculates food, beverage/coffee, packaging and wastage costs.
- Staffing & Labor models role-based headcount, wages, payroll burden, benefits and labor productivity.
- Operating Expenses separates fleet-driven, fixed and revenue-linked operating costs.
- Startup Costs & CapEx times launch spending to unit commissioning, while Depreciation rolls forward depreciable assets and straight-line depreciation.
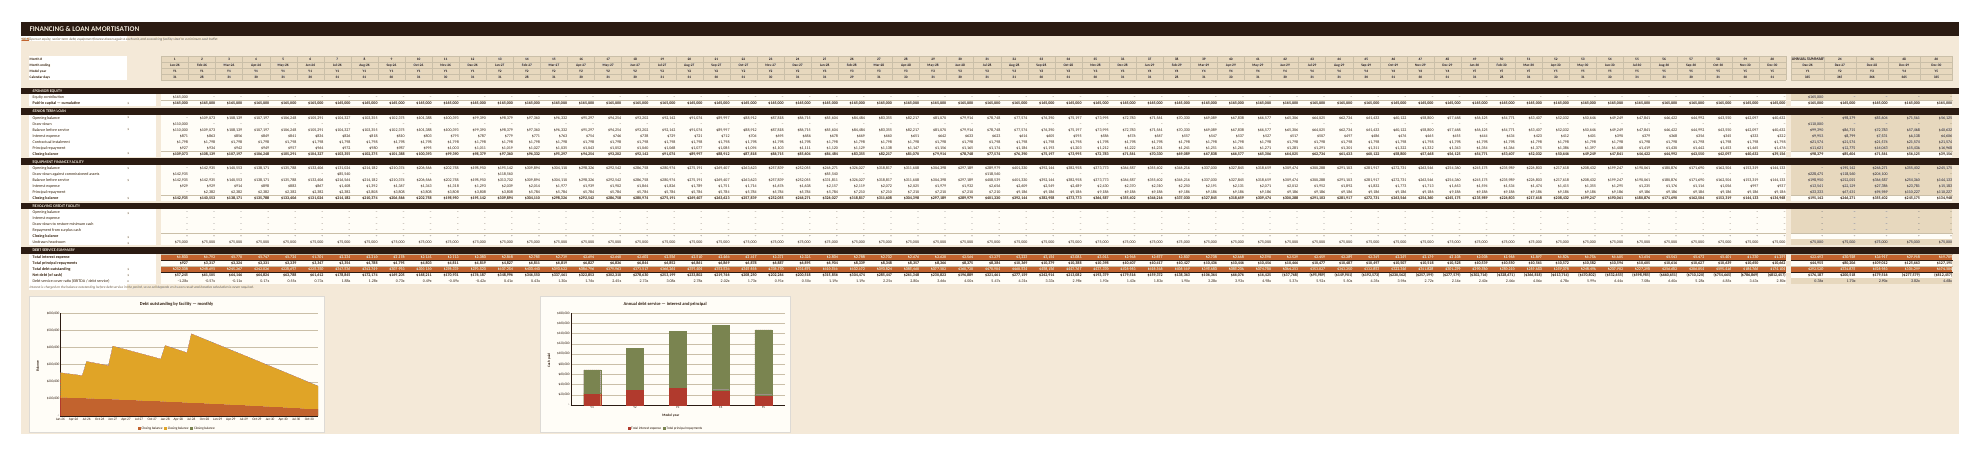
- Financing & Loan models founder equity, senior term debt, equipment-finance drawdowns, principal and interest, plus a revolving facility linked to the cash buffer.
- Working Capital models receivables, inventory, payables, accrued payroll and cash-conversion effects.
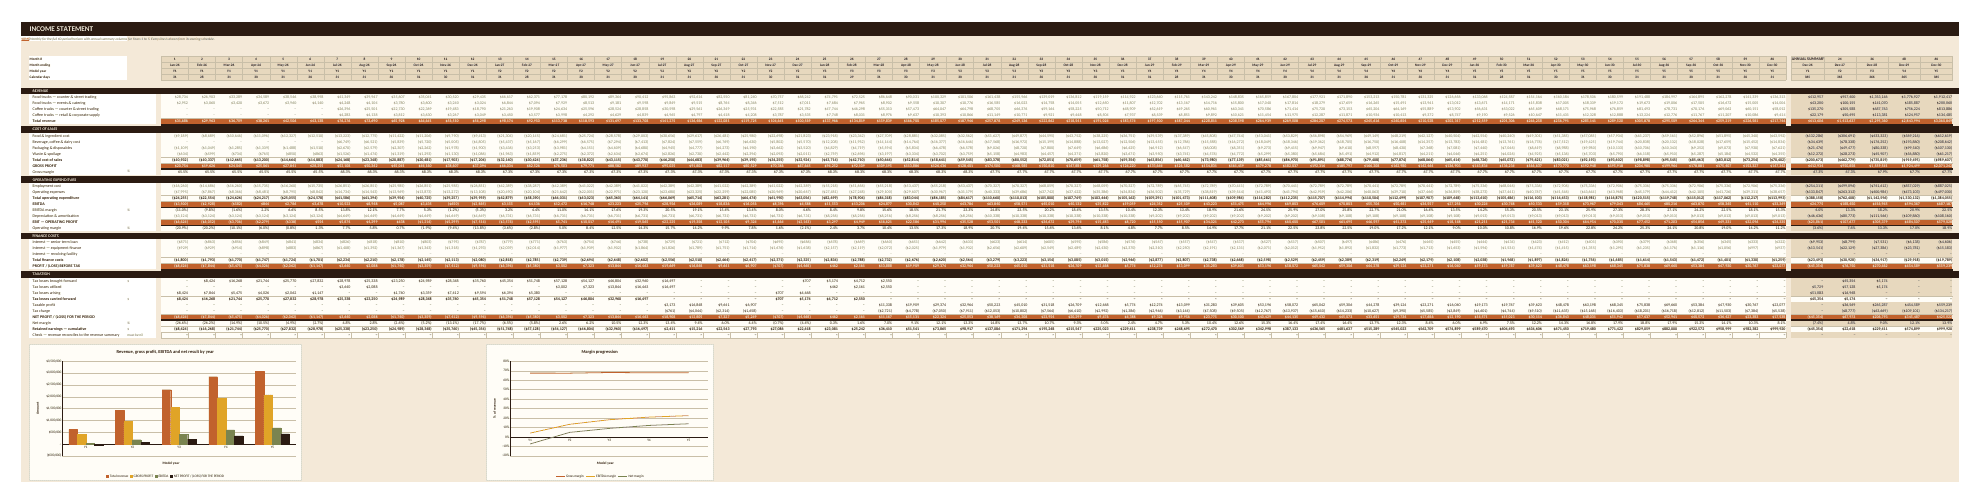
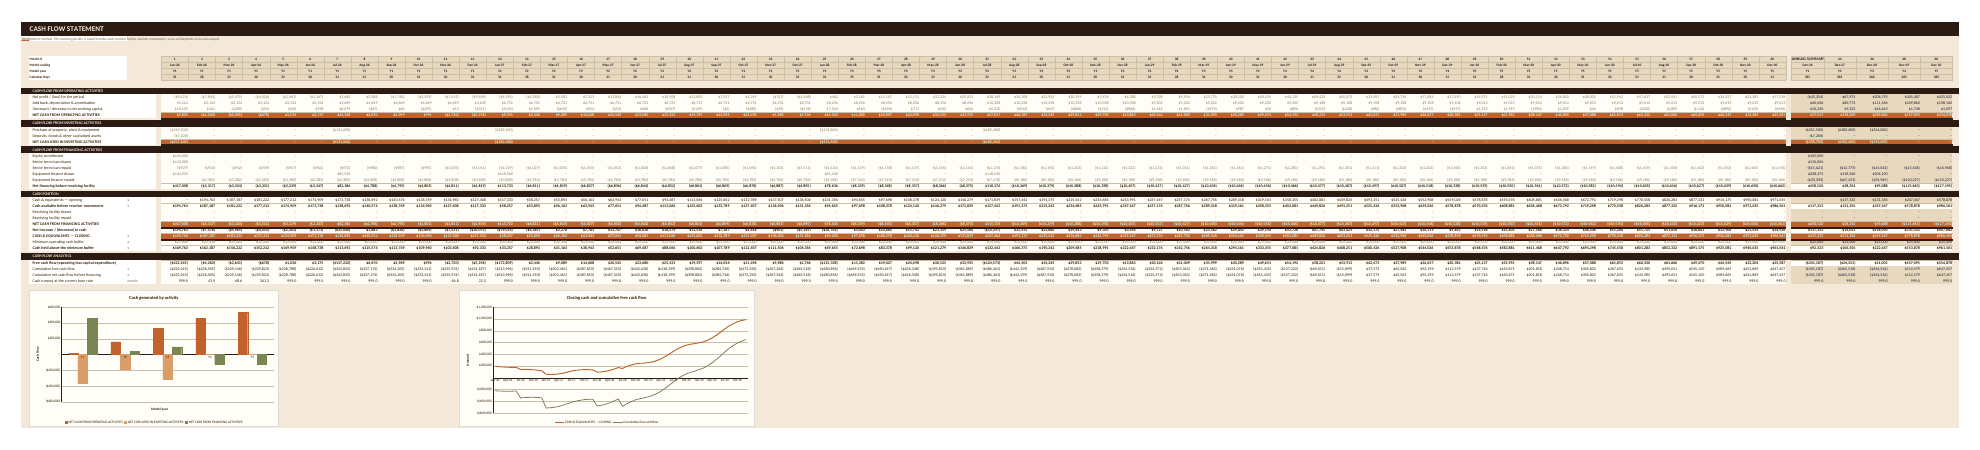
- Income Statement, Cash Flow Statement and Balance Sheet provide monthly calculations and annual summaries across the five-year horizon.
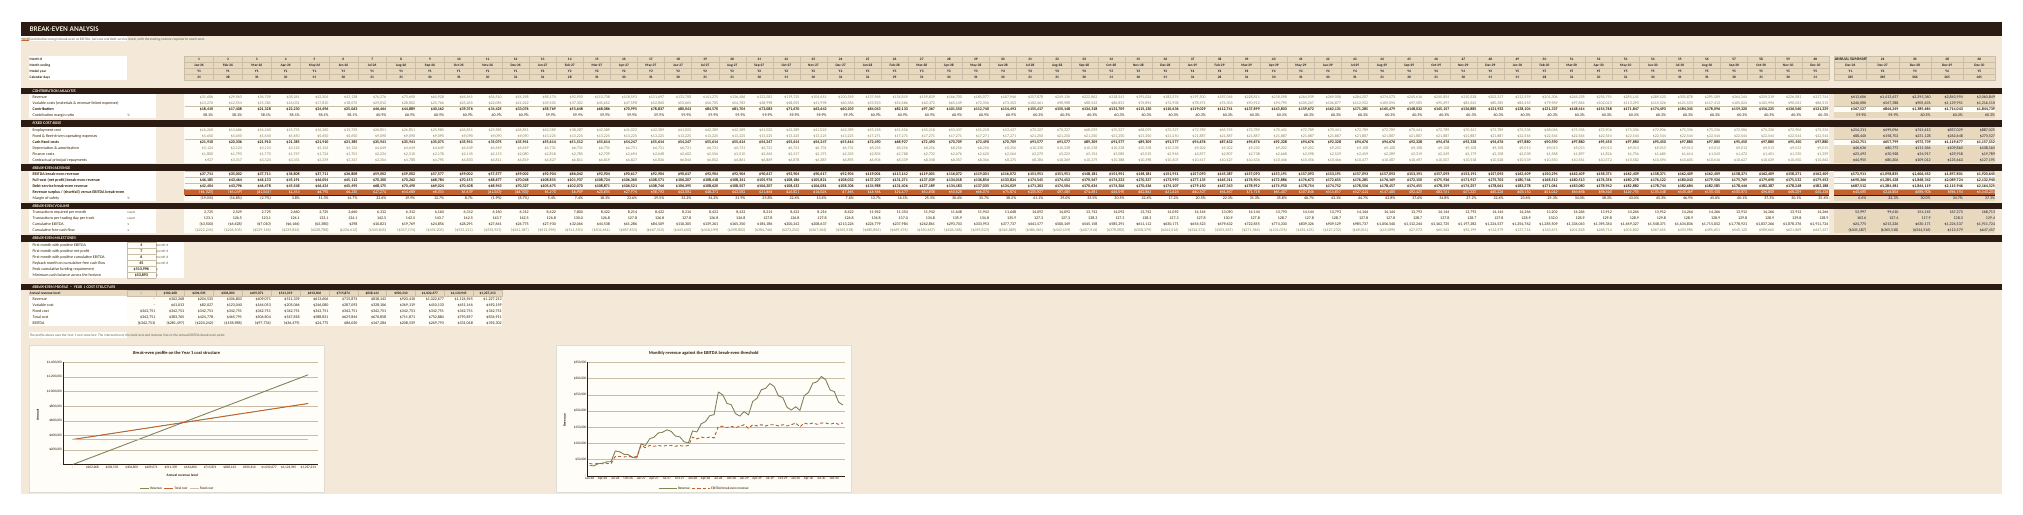
- Break-Even Analysis calculates EBITDA, full-cost and debt-service break-even revenue, margin of safety, required transaction volumes, positive-profit milestones, funding need and payback timing.
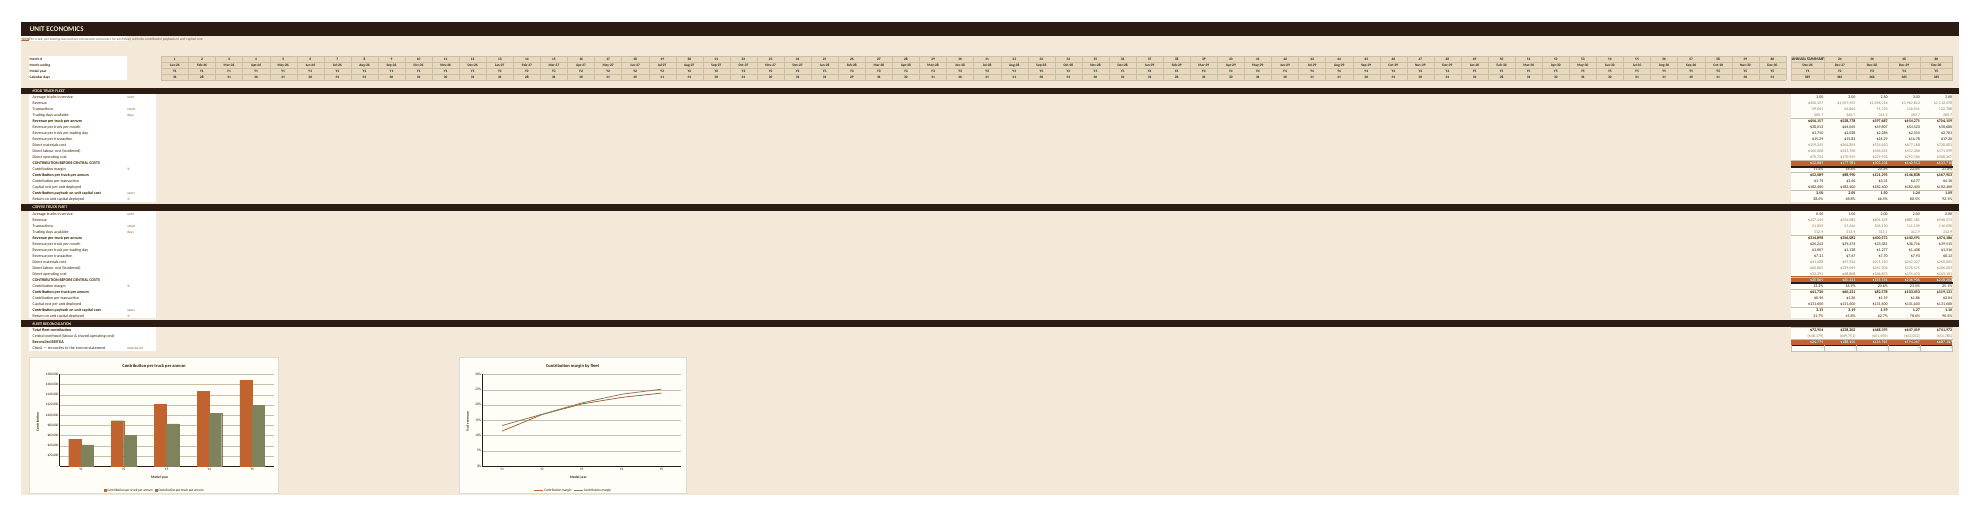
- Unit Economics separates food-truck and coffee-truck results by truck, trading day and transaction, including direct materials, direct labor, direct operating cost, contribution, capital cost, payback and return on unit capital.
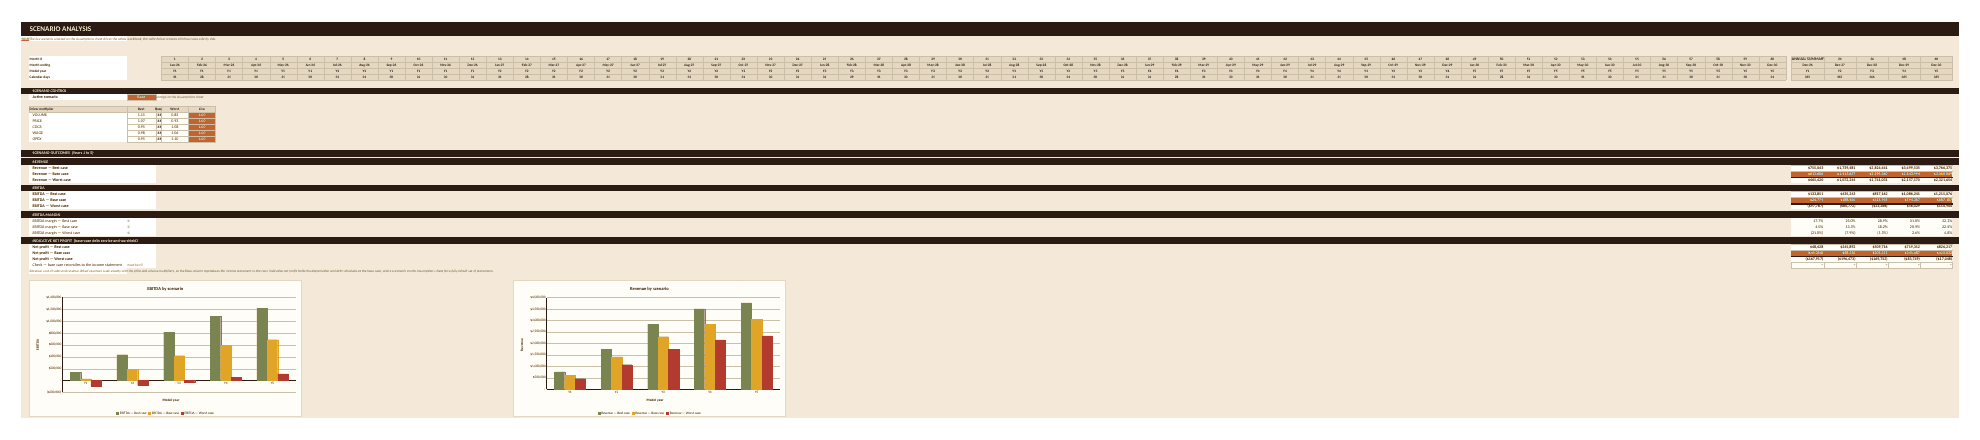
- Scenario Analysis presents Best, Base and Worst cases side by side and shows revenue, EBITDA, EBITDA margin and indicative net profit across Years 1-5.
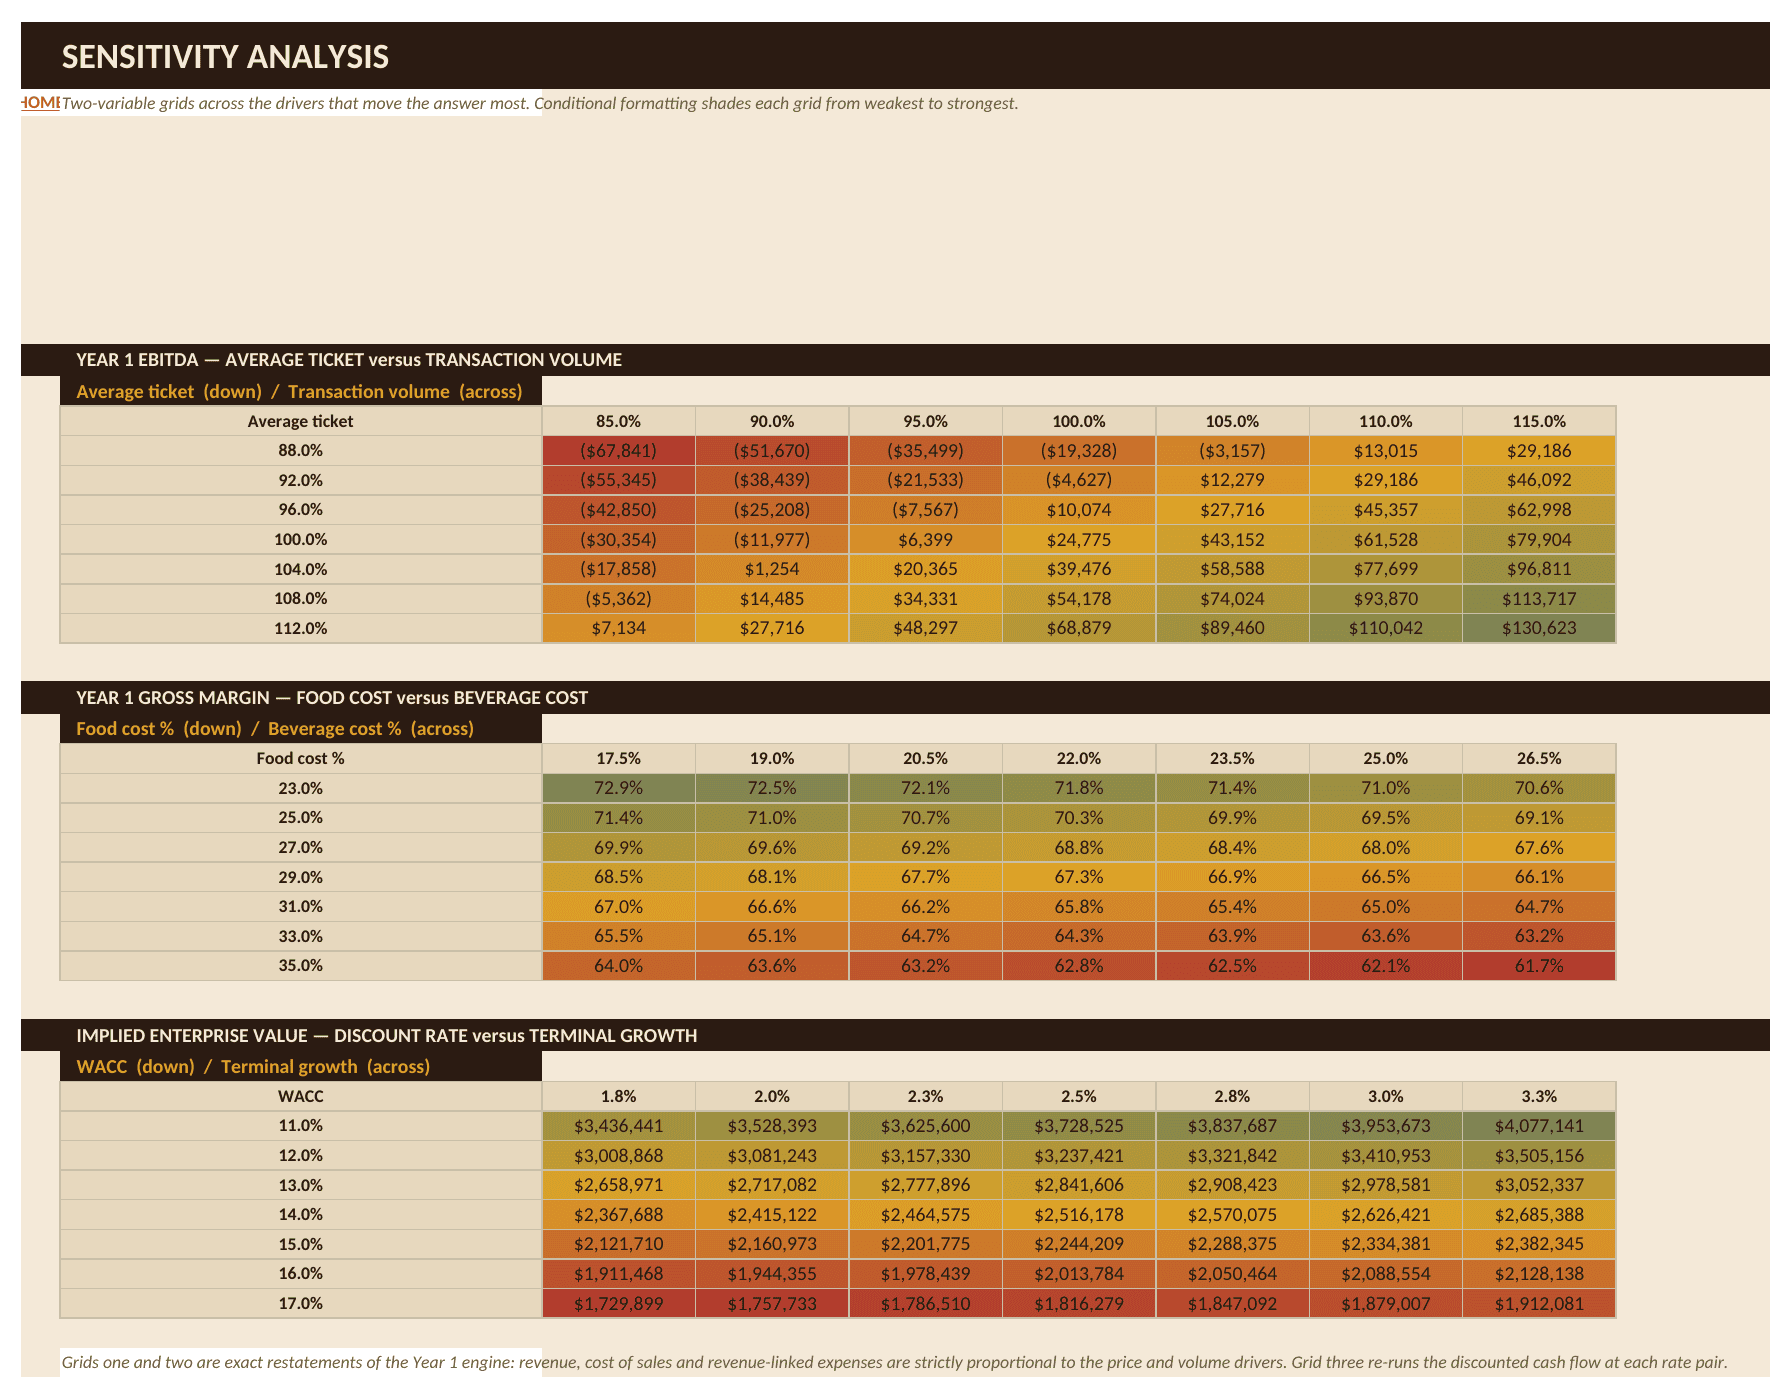
- Sensitivity Analysis includes two-variable grids for average ticket vs. transaction volume, food cost vs. beverage cost, and WACC vs. terminal growth.
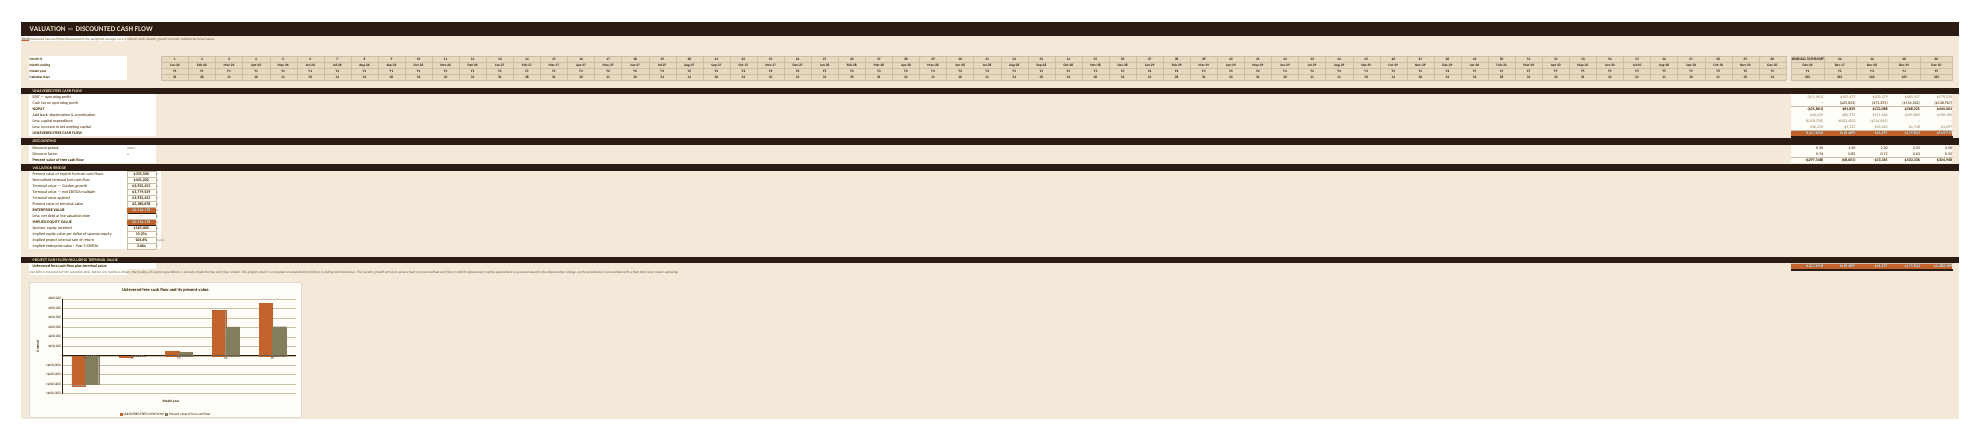
- Valuation (DCF) calculates unlevered free cash flow, discount factors, Gordon-growth and exit-multiple terminal values, enterprise value, equity bridge, implied project return and EV/EBITDA cross-checks.
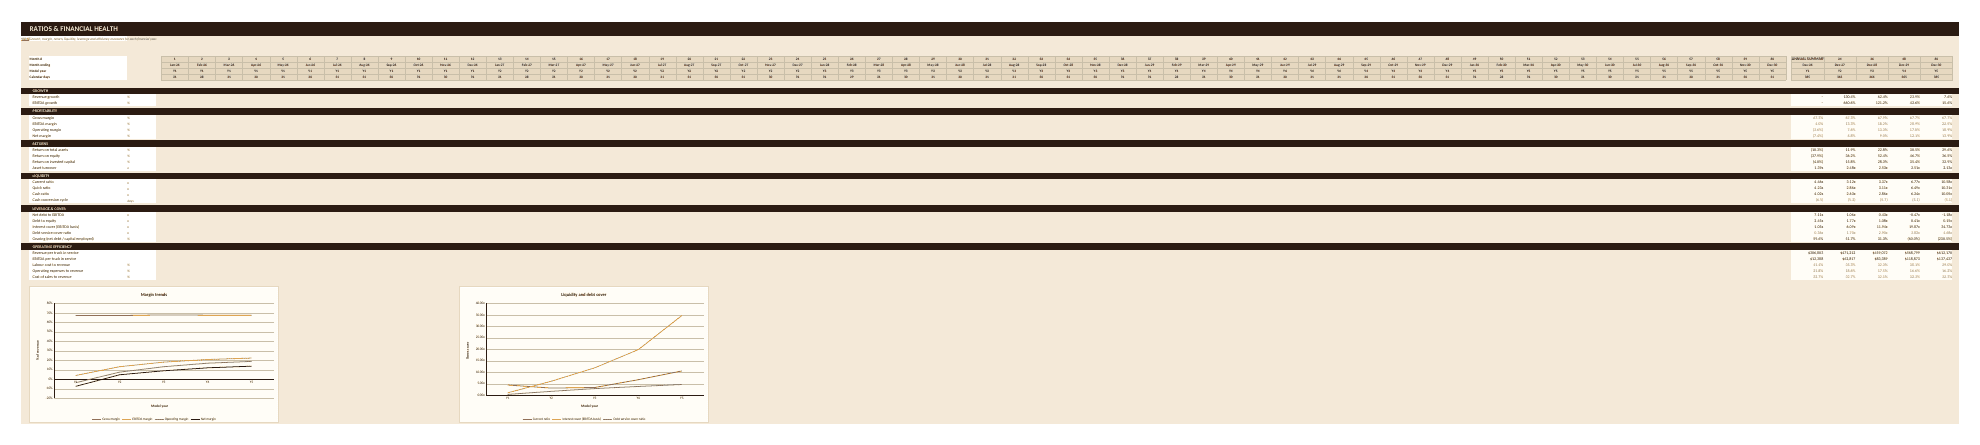
- Ratios & Health tracks growth, profitability, returns, liquidity, cash conversion, leverage, coverage and operating efficiency.
- Audit & Validation is the workbook’s built-in formula-check sheet for statement ties, internal reconciliations and schedule sanity tests; Disclaimer & Notes contains the workbook’s own usage notes and modelling conventions.
🔄 Scenarios and sensitivity
The active scenario selector flows through the calculation sheets using five live driver families: Volume, Price, COGS, Wage and OpEx. This makes it possible to rebuild the operating and financial statements under Best, Base or Worst assumptions rather than comparing isolated topline changes. The dedicated scenario sheet also places the three cases side by side for faster comparison.
The sensitivity sheet goes one step further with two-variable grids focused on the drivers most likely to change the commercial answer: ticket size and transaction volume for EBITDA, food and beverage cost rates for gross margin, and discount rate and terminal growth for enterprise value.
💡 Practical use cases
- Business planning: structure a five-year launch and expansion plan for a food-truck, coffee-truck or mixed mobile fleet.
- Forecasting: build monthly revenue, cost, staffing, capex, working-capital and funding forecasts across 60 periods.
- Profitability analysis: understand gross profit, EBITDA, operating profit, net profit and margin progression as the fleet scales.
- Cash-flow planning: identify cash low points, minimum cash headroom, cumulative funding needs and free-cash-flow payback.
- Pricing decisions: test average-ticket assumptions alongside transaction volume and observe the impact on EBITDA.
- Scenario planning: compare Best, Base and Worst operating cases using linked volume, price, COGS, wage and OpEx multipliers.
- Sensitivity testing: evaluate EBITDA, gross margin and DCF value across two-variable driver grids.
- Operational planning: assess launch timing, service days, day-parts, fleet availability, events, retail sales, labor deployment and per-truck economics.
- Financing analysis: model sponsor equity, senior debt, equipment finance, revolver usage, interest and principal repayment.
- Break-even analysis: estimate the revenue and transaction levels required for EBITDA, full-cost and debt-service break-even.
- Unit economics: compare food and coffee formats on revenue per truck, revenue per transaction, contribution, capital payback and return on deployed capital.
- Valuation: estimate enterprise and equity value using unlevered DCF with Gordon-growth or exit-multiple terminal approaches.
✅ Key outputs and KPIs
The workbook produces monthly and annual revenue, gross profit, EBITDA, EBITDA margin, operating profit, net profit, cash balance, net debt and trucks in service, together with break-even thresholds, margin of safety, transaction requirements, funding milestones, debt balances, unit economics, working-capital metrics, liquidity and leverage ratios, coverage measures, DCF enterprise value and equity value.
Similar ProductsOther customers were also interested in...



 eFinancialModels
Electric Vehicle (EV) Charging Station Financial M...
With this comprehensive 5- or 10-year monthly tool, investors can assess the viability of setting up... Read more

Financial Model for Mobile App | Mobile App Busine...
The Mobile App Financial Plan Template in Excel allows you to develop financial projections when lau... Read more

 HenrySheykin
Food Truck Financial Model Excel Template
The Food Truck Financial Model helps entrepreneurs, founders, business owners, consultants, and anal... Read more

Green Hydrogen Production from Wind Energy Financi...
The Green Hydrogen from Wind Financial Model aims to comprehensively forecast a horizon of 40 years ... Read more

Simple Mutual Non-Disclosure Agreement Template
Protect your business secrets with ease using our Simple Mutual Non-Disclosure Agreement Template. S... Read more

Solar Energy Financial Model
The Solar Energy Financial Model Spreadsheet Template in Excel assists you in preparing a sophistica... Read more

 Peter Graf
The Customer-Centric Financial Model for Restauran...
Starting a restaurant without a financial plan is like driving a car blindfolded. You wouldn´t do i... Read more
You must log in to submit a review.