
0 ITEMS

How to Calculate SaaS Monthly Recurring Revenue

SaaS Monthly Recurring Revenue is the predictable subscription revenue a business earns each month, and you calculate it by multiplying the number of active customers by their average monthly revenue per user (ARPU), with annual contracts normalized to a monthly figure and one-time fees stripped out. The full picture comes from the MRR waterfall, which adds New MRR and Expansion MRR to your starting balance and subtracts Churned MRR and Downgrade MRR. This guide covers the core formula, worked examples for single-tier and multi-tier pricing, how MRR differs from ARR and when to use each, and the five mistakes that most often distort the number. Get it right and every forecast, hiring plan, and investor update built on top of it rests on a number you can trust.
Key Takeaways
- MRR equals the number of active customers multiplied by the average monthly revenue per customer, and it excludes all one-time fees.
- The full MRR waterfall has five components: Start MRR, New MRR, Expansion MRR, Churned MRR, and Downgrade MRR — missing any one of them distorts your number.
- Annual contracts must be converted to a monthly equivalent before you include them in MRR.
- Early-stage SaaS companies are generally expected to grow MRR at around 10-20% month over month, while average B2B SaaS churn runs at 3.5% per month, so Churned MRR is never a rounding error.
- ARR equals MRR multiplied by 12 and is the right metric for board reporting and valuation; MRR is the right metric for operational decisions.
- Five calculation mistakes consistently distort MRR: counting one-time fees, excluding expansion revenue, ignoring churn, mishandling discounts, and skipping proration.
What Is SaaS Monthly Recurring Revenue?
Monthly Recurring Revenue (MRR) is the total predictable revenue a SaaS business generates each month from active subscriptions, normalized so that annual or multi-month contracts are converted to their monthly equivalent. It also excludes one-time fees and variable charges, because those amounts do not repeat reliably each month.
In plain English: MRR answers the question “how much subscription revenue can we count on this month?” It is the single most-watched metric in SaaS finance because it is both predictable and actionable, and it sits at the center of any SaaS financial model template.
The Core MRR Formula
Calculating SaaS Monthly Recurring Revenue starts with one equation, then expands into a five-part waterfall for precision.
Basic formula:
MRR = Number of Active Customers × Average Revenue Per User (ARPU)
Average Revenue Per User (ARPU) is the mean monthly payment across all active subscribers. You calculate it by dividing total monthly subscription revenue by the number of paying customers.
You must subtract one-time fees from total revenue before computing ARPU, otherwise your MRR will be overstated from day one.
Worked Example: Two Scenarios
Here is the math for two common SaaS pricing structures.
Scenario A: Single-tier pricing
A project management SaaS has 100 active customers, each paying $50 per month.
- MRR = 100 × $50 = $5,000
The same logic appears in Maxio’s ARR reference, where a SaaS charging $100 per month with 50 active customers produces an MRR of $5,000.
Scenario B: Two-tier pricing
A live-streaming SaaS has 1,000 subscribers. Half (500) pay $100 per month on the Pro plan; the other half (500) pay $50 per month on the Basic plan.
- Pro MRR = 500 × $100 = $50,000
- Basic MRR = 500 × $50 = $25,000
- Total MRR = $75,000
- ARPU = $75,000 ÷ 1,000 = $75 per customer
This two-tier structure also shows why ARPU matters: if you only tracked customer count, you would miss the $25 gap between plan types that drives pricing and upsell strategy.
The Full MRR Waterfall: Five Components
The basic formula tells you where you are. The waterfall formula tells you why you got there. Each component is a distinct revenue movement during the month.
New MRR
Revenue from customers who subscribed for the first time this month.
New MRR = Number of New Customers × ARPU of New Customers
Expansion MRR
Additional revenue from existing customers who upgraded their plan or purchased add-ons. This is the most capital-efficient growth lever in SaaS because you are selling to people who already trust you.
Expansion MRR = Number of Upgrades × Average Revenue per Upgrade
Churned MRR
Revenue lost from customers who canceled their subscriptions. Average B2B SaaS total churn runs at 3.5% per month, so this line item is never trivial.
Churned MRR = Number of Churned Customers × Their Average Monthly Revenue
Downgrade MRR
Revenue lost from customers who moved to a cheaper plan without canceling entirely.
Downgrade MRR = Number of Downgrades × Revenue Reduction per Downgrade
End MRR (the result)
End MRR = Start MRR + New MRR + Expansion MRR – Churned MRR – Downgrade MRR
The chart below breaks a single month into those components, starting from $10,000 of Start MRR and finishing at $12,100 of End MRR, so you can see how each movement adds to or subtracts from the total.
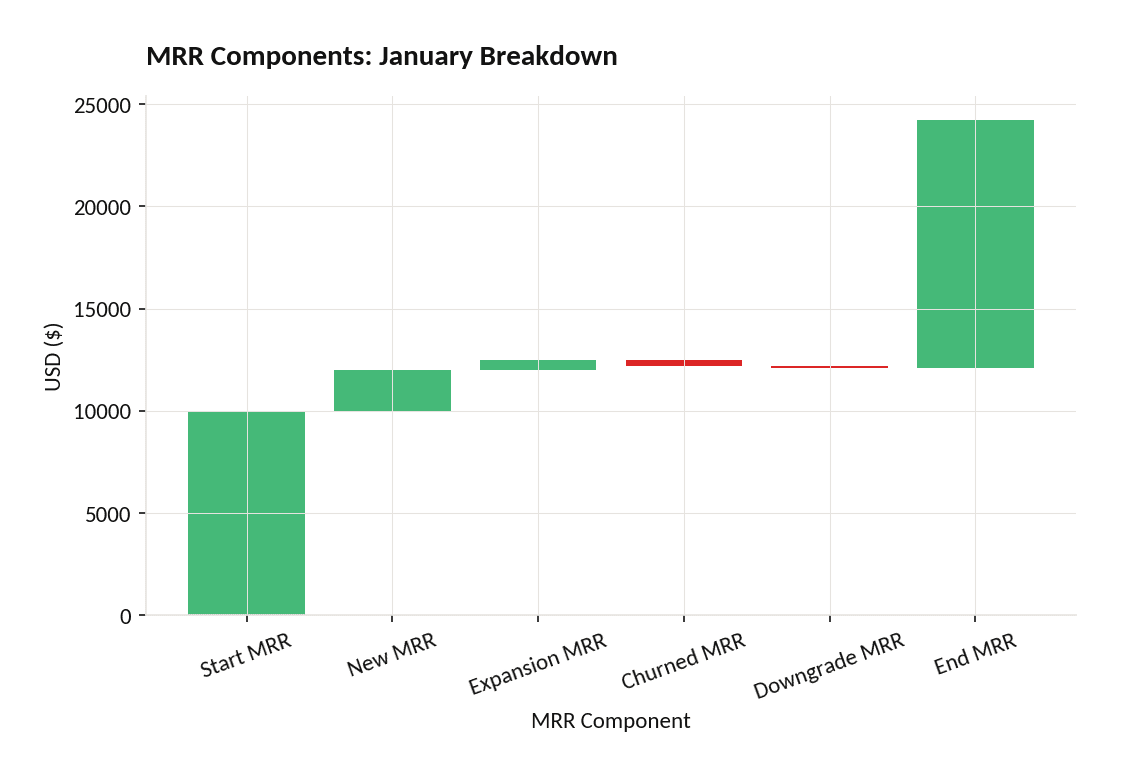
A waterfall chart makes it easy to see which MRR components drive growth and which erode it each month.
MRR vs. ARR: Which Metric to Use When
MRR and Annual Recurring Revenue (ARR) measure the same underlying subscription base, but they serve different audiences and decisions. Use MRR for operational decisions; use ARR for investor reporting and valuation.
| Dimension | MRR | ARR |
|---|---|---|
| Definition | Predictable monthly subscription revenue | MRR × 12 |
| Best for | Month-to-month operations, churn tracking | Board reporting, fundraising, valuation |
| Sensitivity | High: captures monthly swings immediately | Low: smooths out short-term volatility |
| Billing frequency | Normalize annual plans to monthly | Already annualized |
| Growth benchmark | 10-20% MoM for early-stage SaaS | 100%+ YoY for high-growth Series A+ |
| Investor use | Less common in pitch decks | Standard in SaaS valuations |
BillingPlatform’s MRR vs. ARR comparison notes that MRR measures predictable recurring income on a monthly basis and explicitly excludes one-time fees, while ARR annualizes that figure for a longer-term view. Microsoft Excel’s SUMIF function, which works across the 1,048,576-row worksheet limit set out in Excel’s specifications and limits, is a practical tool many early-stage teams use to segment MRR by plan tier before migrating to dedicated SaaS analytics platforms. For the annual view of the same subscription base, see our guide to how to calculate annual recurring revenue (ARR).
5 Common MRR Calculation Mistakes (and How to Fix Them)
Even experienced SaaS finance teams make these errors. Each one pushes your MRR in a specific, predictable direction.
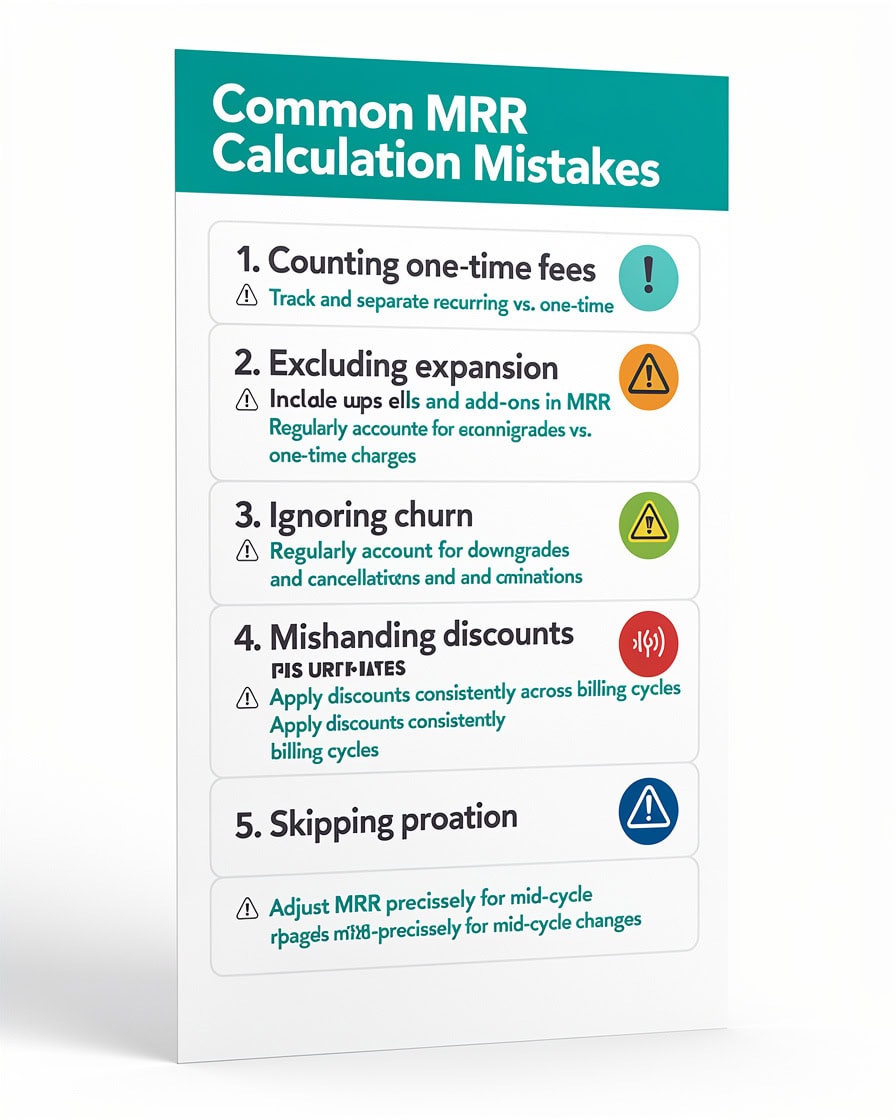
Each of these five mistakes distorts MRR in a different direction — some inflate it, others understate it.
Mistake 1: Counting one-time payments as MRR
Setup fees, professional services, and consulting invoices are not recurring. Including them inflates MRR and makes your revenue look more stable than it is. Fix: strip all non-recurring line items before calculating ARPU.
Mistake 2: Excluding expansion revenue
Omitting upgrades and add-ons understates true MRR growth and masks your best upsell signals. Fix: track Expansion MRR as a separate line in your waterfall every month.
Mistake 3: Ignoring churn and downgrades
Skipping Churned MRR and Downgrade MRR produces an optimistic number that does not reflect reality. Fix: subtract both every month, even when the numbers are uncomfortable.
Mistake 4: Mishandling discounts and promotions
If a customer pays $60 instead of $100 because of a promotional code, their contribution to MRR is $60, not $100. Fix: always use the net amount actually billed, not the list price.
Mistake 5: Skipping proration for partial months
A customer who signs up on the 15th of a 30-day month contributes half a month of revenue. Counting the full month creates a spike that reverses the next month. Fix: prorate all mid-month starts and cancellations to the day. Teams building proration logic in Excel can take advantage of Excel’s DAYS function, which returns the number of days between two dates, making day-accurate proration straightforward without manual calendar counting.
SaaS Subscription Model: Why MRR Matters
The SaaS subscription model delivers four structural advantages that make MRR the central metric to track.
First, predictable revenue: because customers pay monthly or annually, you can forecast cash needs weeks in advance rather than chasing one-time deals. Second, lower retention cost: retaining an existing subscriber costs far less than acquiring a new one, which is why Expansion MRR is so valuable. Third, stable cash flow: recurring payments smooth out the revenue peaks and valleys common in project-based businesses. Fourth, upsell leverage: a customer already using your platform is the easiest person to sell an upgrade to, making Expansion MRR the highest-margin growth channel available.
Early-stage SaaS companies are generally expected to grow MRR at around 10-20% month over month. Hitting that benchmark consistently requires tracking all five waterfall components, not just new customer additions. Finance teams modeling these growth scenarios in Excel can build formulas up to the 64 nested levels of functions Excel allows, which is more than sufficient to encode complex tiered pricing and churn rules into a single MRR calculation cell. Teams that want a ready-made starting point can begin with our SaaS startup financial projections template.
Tools and Templates for MRR Tracking
You can calculate MRR in a spreadsheet, a dedicated SaaS analytics platform, or a purpose-built financial model. Each option suits a different stage.
| Tool type | Best for | Limitation |
|---|---|---|
| Excel / Google Sheets | Pre-revenue to ~$50K MRR | Manual data entry, error-prone at scale |
| SaaS analytics tools (Chartmogul, Baremetrics) | $50K-$1M MRR | Subscription cost, limited scenario modeling |
| Financial model (EFM template) | Any stage, investor-ready | Requires setup time upfront |
| ERP / accounting software | $1M+ MRR | High cost, complex implementation |
A dedicated SaaS financial model adds the most value when you need to run scenarios: what happens to End MRR if churn rises from 2% to 4%? What if you add a new pricing tier at $200 per month? Spreadsheet-based models answer those questions in minutes, which is exactly what our SaaS financial model template is built for.
Frequently Asked Questions
What is the simplest way to calculate SaaS MRR?
The simplest MRR calculation multiplies your total number of active paying customers by the average monthly revenue each one generates. For example, if you have 200 customers each paying $75 per month, your MRR is $15,000. Stripe documents the same customers multiplied by average monthly revenue per customer formula, which works well for single-tier pricing. For multi-tier or usage-based models, you need to calculate the weighted average ARPU across all plans before multiplying by total customer count. Always exclude one-time setup fees and professional services from the calculation.
How do you handle annual subscriptions in MRR?
Annual subscriptions must be converted to a monthly equivalent before you include them in MRR. Divide the annual contract value by 12 and count that monthly amount, not the full annual payment. For example, a customer paying $1,200 per year contributes $100 per month to MRR. Turnstile’s MRR guide confirms that MRR is normalized to monthly amounts regardless of billing frequency. This normalization prevents a distorted spike in the month the annual payment lands and gives you a consistent month-over-month comparison.
What is a good MRR growth rate for a SaaS startup?
For early-stage SaaS companies, a monthly MRR growth rate of 10-20% is the benchmark Stripe cites. At 15% monthly growth, a company starting at $10,000 MRR reaches roughly $48,000 MRR within 12 months. At 20% monthly growth, that same starting point reaches $89,000 MRR. Growth rates above 20% per month are exceptional and typically require significant paid acquisition spend. Rates below 10% per month at the early stage often signal a product-market fit or pricing problem worth investigating before scaling sales.
What is the difference between Churned MRR and Downgrade MRR?
Churned MRR is revenue lost from customers who cancel their subscriptions entirely, meaning they stop paying you. Downgrade MRR is revenue lost from customers who stay but switch to a cheaper plan. Both reduce your End MRR, but they signal different problems. High Churned MRR suggests a retention or product-value issue. High Downgrade MRR often signals a pricing structure problem or customers who are satisfied but over-paying for features they do not use. Average B2B SaaS total churn runs at 3.5% per month, so tracking both separately is essential for diagnosing the right fix.
How does Expansion MRR affect Net Revenue Retention?
Expansion MRR is the primary driver of Net Revenue Retention (NRR) above 100%. NRR measures how much revenue you retain from your existing customer base after accounting for churn, downgrades, and expansions. If your Expansion MRR exceeds your Churned MRR plus Downgrade MRR, your NRR is above 100%, meaning your existing customers grow your revenue even without any new customer acquisition. For example, if you start a month with $100,000 in MRR from existing customers, lose $3,000 to churn, lose $1,000 to downgrades, but gain $6,000 in expansions, your NRR is 102%. Investors treat NRR above 110% as a strong signal of product stickiness and pricing power.
Should I include free trial users in my MRR calculation?
No. Free trial users do not pay you, so they contribute $0 to MRR. You include a customer in MRR only when they convert to a paid subscription and their first payment clears. Some teams track a separate “pipeline MRR” metric that estimates the revenue value of active trials, but this is a forecast input, not a component of actual MRR. PayPro Global’s MRR reference specifies that MRR is calculated from active accounts only, which means paying accounts. Including trials inflates your MRR and makes conversion rate analysis harder because you lose the clean signal of when a trial actually became revenue.
How often should I recalculate MRR?
Most SaaS finance teams recalculate MRR at the end of each month as part of their monthly close process, but high-growth teams often track it weekly or even daily using automated billing integrations. Monthly recalculation is the minimum for accurate trend analysis. Weekly tracking helps you catch churn spikes or expansion slowdowns early enough to act. Daily MRR dashboards are most useful when you are running pricing experiments or promotional campaigns and need to see the revenue impact in near real-time. Whatever cadence you choose, the formula stays the same: Start MRR + New MRR + Expansion MRR – Churned MRR – Downgrade MRR = End MRR.
Build Accurate MRR Forecasts from Day One
SaaS Monthly Recurring Revenue is the clearest signal of subscription business health. The basic formula is straightforward: active customers multiplied by ARPU. The full waterfall, which adds New MRR and Expansion MRR and subtracts Churned MRR and Downgrade MRR, gives you the diagnostic power to understand why your number moved, not just where it landed.
The five calculation mistakes covered above (one-time fees, missing expansion, ignoring churn, mishandling discounts, and skipping proration) each push MRR in a specific direction. Fixing them costs nothing except attention to detail, and the payoff is a number you can actually trust for forecasting and investor reporting.
I recommend starting with the EFM SaaS Financial Model, which builds the full MRR waterfall automatically, runs churn and expansion scenarios side by side, and produces investor-ready output without requiring you to build the logic from scratch.
























































