0 ITEMS

SaaS Startup Financial Projections: Free Template + Guide

Building SaaS financial projections from scratch is one of the most common blockers for early-stage founders, and the right template removes that barrier in under an hour.
Key Takeaways
- eFinancialModels offers a free SaaS startup financial projections template covering MRR, ARR, CAC, LTV, churn, burn rate, and runway in one Excel file.
- Investors at seed stage expect at least 3 years of projections; Series A investors typically want 5 years of detailed monthly and annual forecasts.
- A healthy LTV:CAC ratio for SaaS is at least 3:1, meaning every dollar spent acquiring a customer should return $3 in lifetime value.
- Monthly churn above 2% at early stage is a red flag; best-in-class SaaS companies target below 0.5% monthly churn at scale.
- The SaaS Rule of 40 states that a company’s growth rate plus profit margin should equal or exceed 40%, a benchmark investors use to evaluate efficiency.
- CAC payback period under 12 months is the standard for venture-backed B2B SaaS; above 18 months raises investor concern.
- Pre-revenue founders can still build credible projections using bottom-up assumptions, industry benchmarks, and comparable company data.
Free SaaS Financial Projections Template: Download Now
eFinancialModels provides a free SaaS startup financial projections template you can download immediately, no email signup required. Access the full library of free financial model templates and filter by SaaS to find the right starting point for your stage.
The template works in Excel and covers every core SaaS metric an investor or board member will ask about. If you’re pre-revenue, you’ll fill in assumptions rather than actuals, and the template is designed for exactly that scenario.
For a broader set of SaaS-specific models including scenario planning and cohort analysis, browse the SaaS financial model category on eFinancialModels.
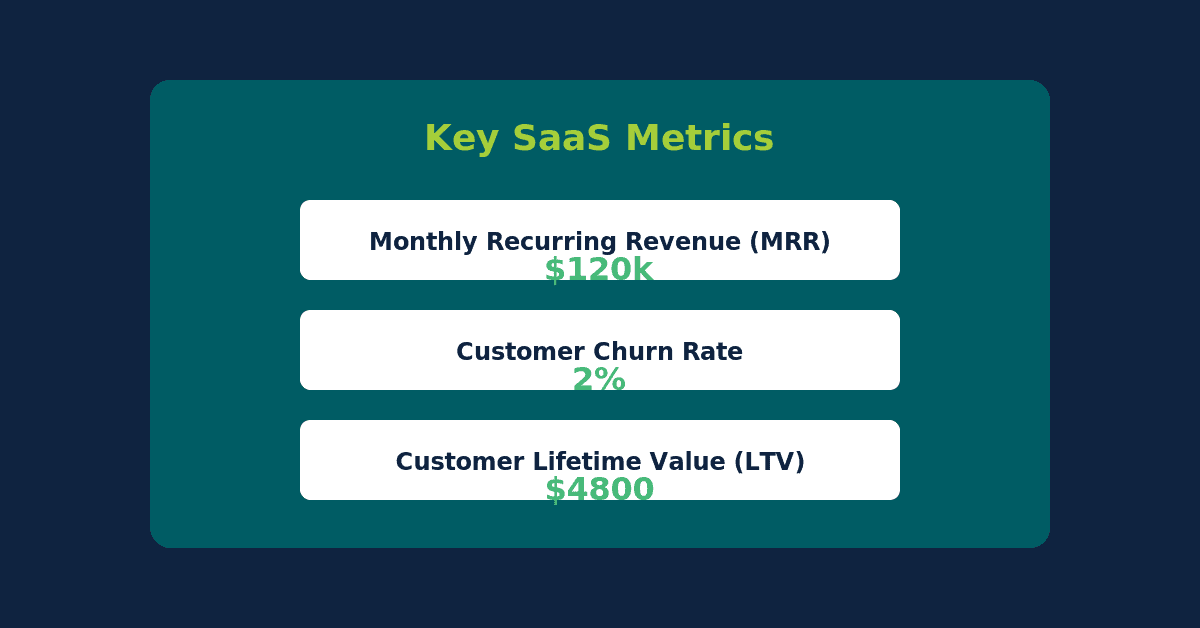
The eight modules in the eFinancialModels SaaS template map directly to the metrics investors review during due diligence.
What’s Included in This SaaS Projection Template
The eFinancialModels SaaS projection template includes eight core modules that cover every metric a seed or Series A investor will scrutinize.
- MRR and ARR projections (Monthly Recurring Revenue and Annual Recurring Revenue): These are the heartbeat metrics of any SaaS business. MRR = number of paying customers × average revenue per user (ARPU). ARR = MRR × 12.
- Customer Acquisition Cost (CAC): Total sales and marketing spend divided by the number of new customers acquired in the same period. If you spend $10,000 in a month and acquire 20 customers, your CAC is $500.
- Lifetime Value (LTV): The total revenue you expect from one customer before they churn. LTV = ARPU ÷ monthly churn rate. At $99/month ARPU and 2% monthly churn, LTV = $4,950.
- Churn modeling: Tracks the percentage of customers or revenue lost each month. The template separates logo churn (customers lost) from revenue churn (dollars lost), because expansion revenue can make net revenue churn negative.
- Cohort analysis: Groups customers by the month they signed up and tracks their retention over time. This reveals whether your product is improving or degrading for newer cohorts.
- Burn rate and runway: Monthly burn rate = total cash out minus total cash in. Runway = cash balance ÷ net monthly burn. If you have $600,000 in the bank and burn $50,000 per month, your runway is 12 months.
- Unit economics summary: A single dashboard showing LTV:CAC ratio, CAC payback period, and gross margin, the three numbers investors check first.
- Three-statement model: Income statement, balance sheet, and cash flow statement linked together. This is what accountants and investors mean by a three statement model.
Color-coded input cells (yellow) and formula cells (white) make it easy for non-finance founders to know exactly where to enter their assumptions.
How to Use This Template: Step-by-Step Guide
Populating the template takes five steps, and you can complete a first draft in under two hours even with no finance background.
Step 1: Enter Your Pricing and Plan Structure
Start with your pricing tiers. Enter each plan name, monthly price, and annual price (if you offer annual billing). If you have a single plan at $99/month, enter that. If you have three tiers at $49, $99, and $299, enter all three. The template calculates a blended ARPU automatically based on the customer mix you project.
Step 2: Set Your Customer Acquisition Assumptions
Enter how many new customers you expect to acquire each month. For pre-revenue founders, use a bottom-up approach: estimate your sales or marketing channel, its conversion rate, and your budget. For example, if you plan to spend $5,000/month on paid ads, your landing page converts at 3%, and your trial-to-paid rate is 20%, you’d project roughly 30 new customers per month (5,000 ÷ $50 cost-per-click × 3% × 20% = 30, assuming a $50 CPC).
Step 3: Input Your Churn Rate
If you have no historical data, use a conservative benchmark. Early-stage SaaS companies typically see monthly churn between 3% and 7% before product-market fit, according to OpenView Partners’ SaaS benchmarks. After product-market fit, best-in-class companies drive this below 1%. Enter your assumption in the churn input cell; the template propagates it across all cohorts.
Step 4: Build Your Cost Structure
Enter your monthly costs by category: cost of goods sold (COGS, which for SaaS typically means hosting, support, and third-party software), sales and marketing, research and development (R&D), and general and administrative (G&A). SaaS companies at scale typically allocate roughly 20-25% of revenue to COGS, 40-50% to sales and marketing, 15-20% to R&D, and 10-15% to G&A, based on benchmarks published by KeyBanc Capital Markets in their annual SaaS survey.
Step 5: Review Your Runway and Adjust
Once all inputs are in, check the runway tab. If your runway is under 12 months, revisit your hiring plan or marketing spend. Most investors want to see at least 18 months of runway post-funding. Adjust assumptions until the model reflects a plan you can actually execute.

Following these five steps in order prevents the most common modeling errors and produces a projection deck ready for investor review.
Worked Example: Projecting Month 1 to Month 12
Here’s the math for a simple B2B SaaS product priced at $99/month.
Inputs:
- Starting customers: 0
- New customers per month: 50 (growing 10% month-over-month)
- Monthly churn rate: 3%
- ARPU: $99
- Monthly burn (costs): $40,000
- Starting cash: $500,000
Month 1 calculation:
- New customers: 50
- Churned customers: 0 × 3% = 0
- Ending customers: 50
- MRR: 50 × $99 = $4,950
- Net burn: $40,000 – $4,950 = $35,050
- Ending cash: $500,000 – $35,050 = $464,950
Month 6 calculation:
- Cumulative new customers (months 1-6, growing 10%/month): 50 + 55 + 60.5 + 66.6 + 73.2 + 80.5 = 386 gross adds
- Churned customers (cumulative): approximately 28 (applying 3% to growing base)
- Ending customers: approximately 358
- MRR: 358 × $99 = $35,442
- Net burn: $40,000 – $35,442 = $4,558
- Ending cash: approximately $337,000
Month 12 projection:
- Ending customers: approximately 780
- MRR: 780 × $99 = $77,220
- ARR: $77,220 × 12 = $926,640
- Monthly burn turns cash-flow positive around month 11 at this growth rate.
This example shows why churn compounds against you early: even at 3% monthly churn, you lose roughly 7% of your customer base in the first 6 months. The template automates all of these calculations.
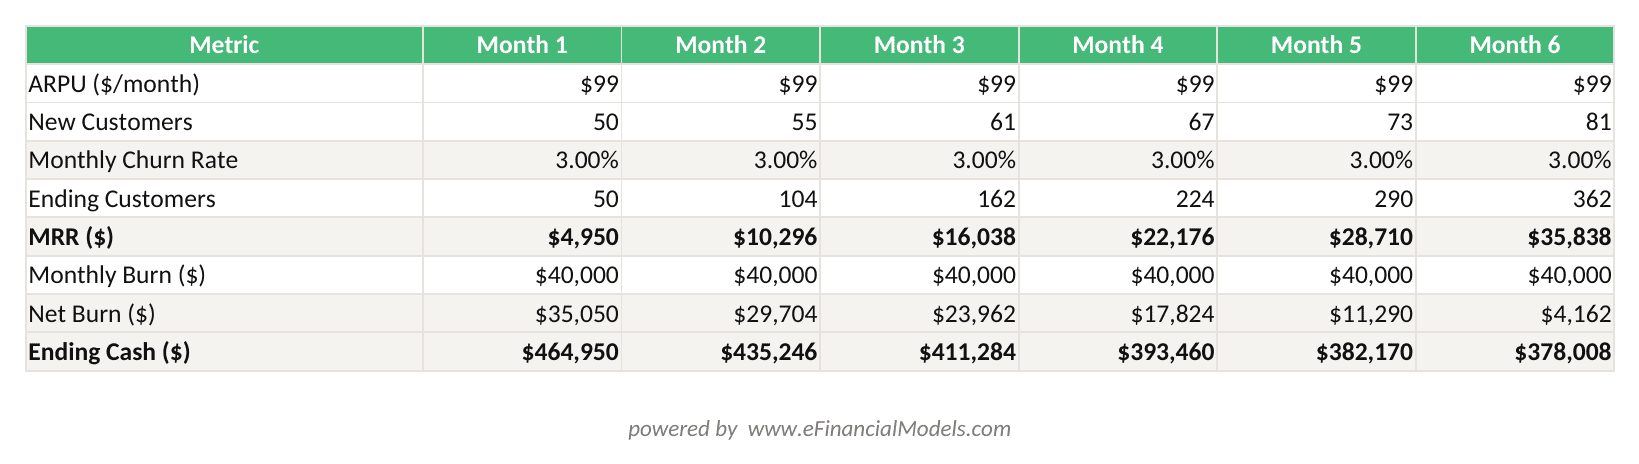
This 6-month SaaS projection uses $99 ARPU, 50 new customers in month 1 growing 10% per month, 3% monthly churn, and $40,000 monthly burn to show MRR and runway progression.

Cohort retention curves reveal whether newer customers retain better than older ones, a key signal of product improvement over time.
Modeling Different SaaS Pricing Structures
The template adapts to four common SaaS pricing models with minor input changes.
| Model | Key Input | Churn Driver | Metric to Watch |
|---|---|---|---|
| Flat subscription | Fixed ARPU | Logo churn | Net MRR growth |
| Tiered plans | Blended ARPU | Plan downgrades | Expansion MRR |
| Usage-based | Variable ARPU | Usage decline | Revenue retention |
| Freemium | Paid conversion % | Free-to-paid drop | CAC payback |
Tiered subscriptions: Enter each tier’s price and projected customer mix (e.g., 60% on Starter at $49, 30% on Pro at $99, 10% on Enterprise at $299). The template calculates blended ARPU as a weighted average: (0.6 × $49) + (0.3 × $99) + (0.1 × $299) = $29.40 + $29.70 + $29.90 = $89 blended ARPU.
Usage-based pricing: Replace fixed ARPU with an average usage assumption and a price-per-unit. Model a low, mid, and high usage scenario. This is the most volatile model to project, so always show a bear case.
Freemium: Add a free-user funnel above the paying customer section. Enter your free-to-paid conversion rate (industry average is 2-5% according to OpenView Partners) and your free user growth rate. The template calculates paying customer additions from that funnel.

Each SaaS pricing model requires different modeling assumptions; usage-based pricing carries the highest revenue variance and needs a bear-case scenario.
Common Projection Mistakes SaaS Founders Make
Most early-stage SaaS projections fail for the same five reasons. Knowing them in advance saves you from an embarrassing investor meeting.
Mistake 1: Hockey-stick growth with no explanation. Projecting 10% month-over-month growth is fine if you can explain the channel, budget, and conversion rates that produce it. Investors will ask. Build your growth from the bottom up, not from a desired outcome backward.
Mistake 2: Ignoring churn entirely. Many first-time founders project new customer additions without subtracting churn. At 5% monthly churn, you lose more than half your customer base in a year. The template’s cohort tab makes churn visible so you can’t accidentally hide it.
Mistake 3: Confusing gross margin with contribution margin. Gross margin for SaaS is revenue minus COGS (hosting, support, third-party tools). Contribution margin subtracts variable sales and marketing costs too. Investors care about both. Best-in-class SaaS gross margins run 70-80%, according to data from the SaaS Capital Index.
Mistake 4: Underestimating CAC. Founders often forget to include salaries, tools, and agency fees in their CAC calculation. If your VP of Sales earns $150,000/year and your team closes 100 new customers annually, that salary alone adds $1,500 to your CAC before any ad spend.
Mistake 5: Projecting runway without a hiring plan. Headcount is typically the largest cost driver in SaaS. If you plan to hire 3 engineers in month 6, your burn rate jumps significantly. Model each hire individually in the cost tab.
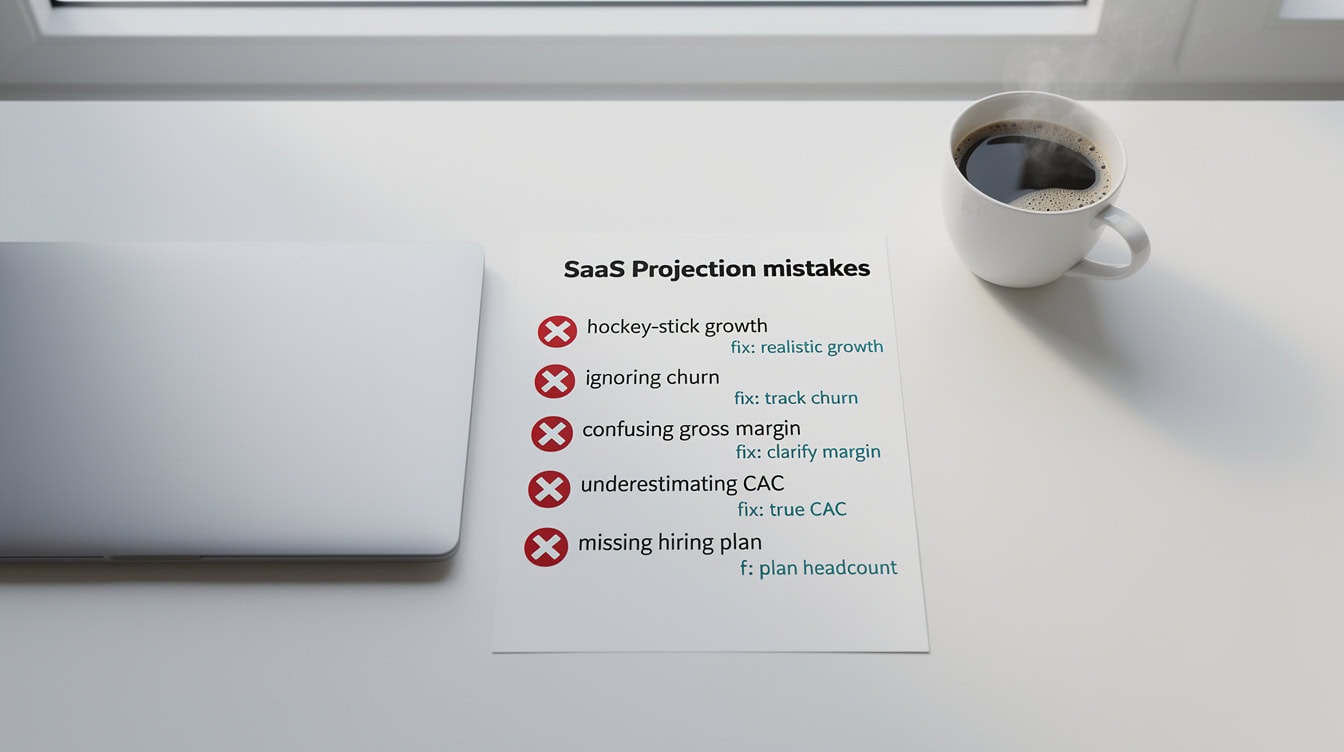
These five mistakes appear in the majority of first-time founder projection decks and are the first things an experienced investor will flag.
What Investors Expect in SaaS Financial Projections
Investors at different stages have specific expectations for your financial projections, and meeting those expectations signals that you understand your business.
Pre-seed: 18-24 months of monthly projections. Investors know the numbers are assumptions, but they’re evaluating your logic and your understanding of unit economics.
Seed: 3 years of projections, monthly for year 1, quarterly for years 2-3. Show a path to $1M ARR and explain the milestones that unlock the next funding round.
Series A: 5 years of projections with monthly detail for years 1-2. Investors expect to see the Rule of 40 (growth rate + EBITDA margin, where EBITDA means earnings before interest, taxes, depreciation, and amortization) trending toward 40% by year 3-4. According to Bain and Company’s analysis of public SaaS companies, firms that sustain a Rule of 40 score above 40% trade at significantly higher revenue multiples than those below.
Key benchmarks investors check:
- LTV:CAC ratio of 3:1 or higher
- CAC payback period under 12 months for B2B SaaS
- Net revenue retention (NRR) above 100% (meaning expansion revenue offsets churn)
- Monthly churn below 1% for B2B, below 3% for B2C
- Gross margin above 65%
According to the SaaS Capital 2023 private SaaS company survey, the median annual revenue growth rate for private SaaS companies with $1-5M ARR was approximately 50%, a useful benchmark when calibrating your own growth assumptions.

Investors calibrate their expectations to your funding stage; showing the right projection horizon and hitting these benchmarks signals financial sophistication.
When to Move Beyond a Template
A template is the right tool until your business complexity outgrows it. You’ll know it’s time to build a custom model when any of these signals appear.
- You have more than 3 pricing tiers with meaningfully different cost structures.
- You’re modeling a marketplace or two-sided platform where supply and demand interact.
- Your revenue includes a mix of SaaS subscriptions, professional services, and usage fees.
- Investors are asking for scenario analysis with 5+ variables toggled simultaneously.
- You’re preparing for a Series B or later round where a Big 4 accounting firm will review your model.
For those situations, eFinancialModels offers custom financial modeling services built by finance professionals who specialize in SaaS. The cost of a custom model is almost always less than the cost of a failed fundraise caused by a model that doesn’t hold up to scrutiny.
For founders who want to build more sophisticated models themselves, the 5-year financial projections templates on eFinancialModels include advanced SaaS-specific structures.

The decision to move beyond a template is driven by model complexity and funding stage, not by company size alone.
Frequently Asked Questions About SaaS Financial Projections
What data do I need before I start building projections?
You need four things to build a credible SaaS projection: your pricing (even if it’s a hypothesis), an estimate of how many customers you can acquire per month and through which channel, an assumption for monthly churn (use 3-5% if you have no data), and your monthly cost structure including salaries, software, and marketing spend. Pre-revenue founders often worry they don’t have enough data, but investors understand that early projections are structured assumptions, not forecasts. The goal is to show that your unit economics work at scale, not to predict the future with precision. Start with the eFinancialModels free template and fill in your best estimates, then stress-test them by changing churn and growth rate by 20% in each direction.
How far out should I project my SaaS financials?
The projection horizon depends on your funding stage. Pre-seed investors typically want 18-24 months of monthly projections. Seed investors expect 3 years, with monthly detail for year 1. Series A investors want 5 years of projections, and they’ll scrutinize the assumptions behind years 3-5 more than the near-term numbers. A common mistake is projecting only 12 months because that’s all you feel confident about. Even if the numbers beyond year 1 are rough, showing a 5-year arc demonstrates that you’ve thought about the long-term business model, market size, and path to profitability. Use the eFinancialModels SaaS template’s multi-year tab to extend your projections without rebuilding from scratch.
How do I model different pricing tiers in the template?
Enter each pricing tier as a separate row in the plan configuration tab. For each tier, input the monthly price, the annual price (if applicable), and your projected customer mix as a percentage. For example, if you have a Starter plan at $49, a Pro plan at $99, and an Enterprise plan at $299, and you expect 60% of customers on Starter, 30% on Pro, and 10% on Enterprise, the template calculates a blended ARPU of $89. Model tier upgrades (expansion MRR) and downgrades (contraction MRR) separately in the churn tab. Expansion MRR is particularly important because it can make your net revenue retention exceed 100%, which is one of the strongest signals of product-market fit you can show an investor.
What if I have no historical data at all?
No historical data is normal for pre-revenue founders, and it doesn’t prevent you from building useful projections. Use a bottom-up approach: start with your planned marketing or sales activity, apply realistic conversion rates from industry benchmarks, and derive customer additions from there. For churn, use 3-5% monthly as a conservative starting assumption for B2B SaaS, or 5-8% for B2C. For CAC, estimate your planned spend divided by expected new customers. The SaaS Capital Index and OpenView Partners publish annual benchmarks for private SaaS companies that give you credible reference points. Document every assumption in a separate tab so investors can see your reasoning. A well-documented set of assumptions is more impressive than a polished spreadsheet with hidden logic.
What’s the difference between MRR and ARR, and which should I use?
MRR (Monthly Recurring Revenue) is the normalized monthly value of all active subscriptions. ARR (Annual Recurring Revenue) is simply MRR multiplied by 12. Use MRR for operational tracking because it shows month-to-month momentum, churn impact, and expansion revenue in real time. Use ARR when talking to investors or comparing yourself to benchmarks, because most SaaS valuations and growth benchmarks are expressed in ARR terms. For example, a company at $100,000 MRR has $1.2M ARR. If you offer annual contracts, recognize revenue monthly (divide the annual contract value by 12) rather than booking it all in month 1. This gives you a more accurate picture of recurring revenue and is the standard accounting treatment under ASC 606, the US revenue recognition standard. Excel supports up to 1,048,576 rows per worksheet (Microsoft), which means even the largest SaaS cohort datasets will fit within a single Excel tab without requiring database tools.
How do I calculate CAC payback period?
CAC payback period is the number of months it takes to recover the cost of acquiring a customer from that customer’s gross profit contribution. The formula is: CAC payback (months) = CAC ÷ (ARPU × gross margin percentage). If your CAC is $600, your ARPU is $99/month, and your gross margin is 70%, then CAC payback = $600 ÷ ($99 × 0.70) = $600 ÷ $69.30 = approximately 8.7 months. Venture-backed B2B SaaS companies target a CAC payback period under 12 months. Above 18 months, investors start questioning sales efficiency. The eFinancialModels SaaS template calculates this automatically in the unit economics dashboard once you’ve entered your CAC and gross margin inputs.
When should I hire a financial modeler instead of using a template?
Use a template for pre-seed and seed rounds, for internal planning, and for board updates when your business model is straightforward. Hire a financial modeler or use a custom modeling service when you’re raising a Series A or later round (where institutional investors will stress-test every assumption), when your revenue model has multiple streams with different margin profiles, or when you need a model that integrates with your accounting software for rolling forecasts. The cost of a professional model typically ranges from $2,000 to $10,000 depending on complexity. That’s a small investment relative to the equity you’re giving up in a fundraising round. eFinancialModels offers both premium SaaS templates and custom modeling services for founders at that inflection point.
Conclusion
SaaS financial projections don’t require a finance degree. They require the right structure, honest assumptions, and a clear understanding of the five or six metrics that actually drive your business. The eFinancialModels free SaaS template gives you that structure immediately, and this guide gives you the logic to fill it in with confidence.
I recommend downloading the free SaaS financial projections template from the eFinancialModels SaaS template library as your starting point. If you’re preparing for a seed or Series A raise and need a more sophisticated model with scenario analysis, investor-ready formatting, and cohort-level detail, the premium SaaS models on eFinancialModels are built specifically for that purpose. A single Excel workbook can contain up to 255 sheets (Microsoft), giving you ample room to separate your assumptions, cohort data, income statement, balance sheet, and cash flow statement into clearly organized tabs without needing multiple files. Additionally, Excel’s NPV function can handle up to 254 value arguments (Microsoft), making it straightforward to model multi-year discounted cash flow scenarios directly within your SaaS projection template.