
0 ITEMS

How to Evaluate a Financial Template Before Buying

Learning how to evaluate a financial template before buying comes down to a repeatable due diligence check rather than a leap of faith. Before you spend a dollar, run the template through eight quality indicators — formula transparency, documentation, error-checking, input separation, version control, stress-testing, vendor support, and output benchmarking — and test it with a few edge-case inputs. This matters because a flawed template becomes part of your control environment the moment you use it for budgeting, valuation, or reporting, and its errors become yours. The checklist below turns template selection into a risk management decision you can defend to an auditor.
Key Takeaways
- 88% of spreadsheets contain at least one error, making template evaluation a risk management decision, not just a purchasing one.
- A single Excel error caused a $6.2 billion shareholder value loss, proving that flawed templates carry real financial consequences.
- 44% of publicly reported spreadsheet incidents involve financial reporting or valuation errors — the exact outputs financial templates produce.
- Evaluate 8 specific quality indicators before purchase: formula transparency, documentation, error-checking, input separation, version control, stress-testing capability, vendor support, and output benchmarking.
- Red flags to reject immediately: hardcoded values inside calculation cells, no assumptions tab, undocumented nested formulas deeper than 3 levels, and no version number.
- 90% of large businesses use spreadsheets in financial reporting despite known control risks, meaning a bad template enters a high-stakes environment the moment you deploy it.
- Test every template with at least 3 edge-case inputs before committing: zero revenue, negative margins, and a 10-year projection horizon.
Why Template Evaluation Is a Risk Management Issue
Buying a financial model template without proper evaluation is the equivalent of signing off on a financial report you haven’t read. The template becomes part of your control environment the moment you use it for budgeting, valuation, or reporting — and if it contains errors, those errors become yours.
Nearly 9 out of 10 spreadsheets contain at least one error (Panko, R., Journal of End User Computing). That statistic covers spreadsheets built by professionals, not amateurs. Templates sold online are spreadsheets. The same failure modes apply.
Among large businesses surveyed, 90% reported using spreadsheets in at least one financial reporting process despite known control risks (ICAEW, 2017). When a flawed template feeds into a financial report, the error doesn’t stay in the spreadsheet — it travels into board presentations, investor decks, and regulatory filings.
Treating template selection as a governance decision means asking: would I be comfortable explaining this model’s logic to an auditor? If the answer is no before you buy, it will still be no after.
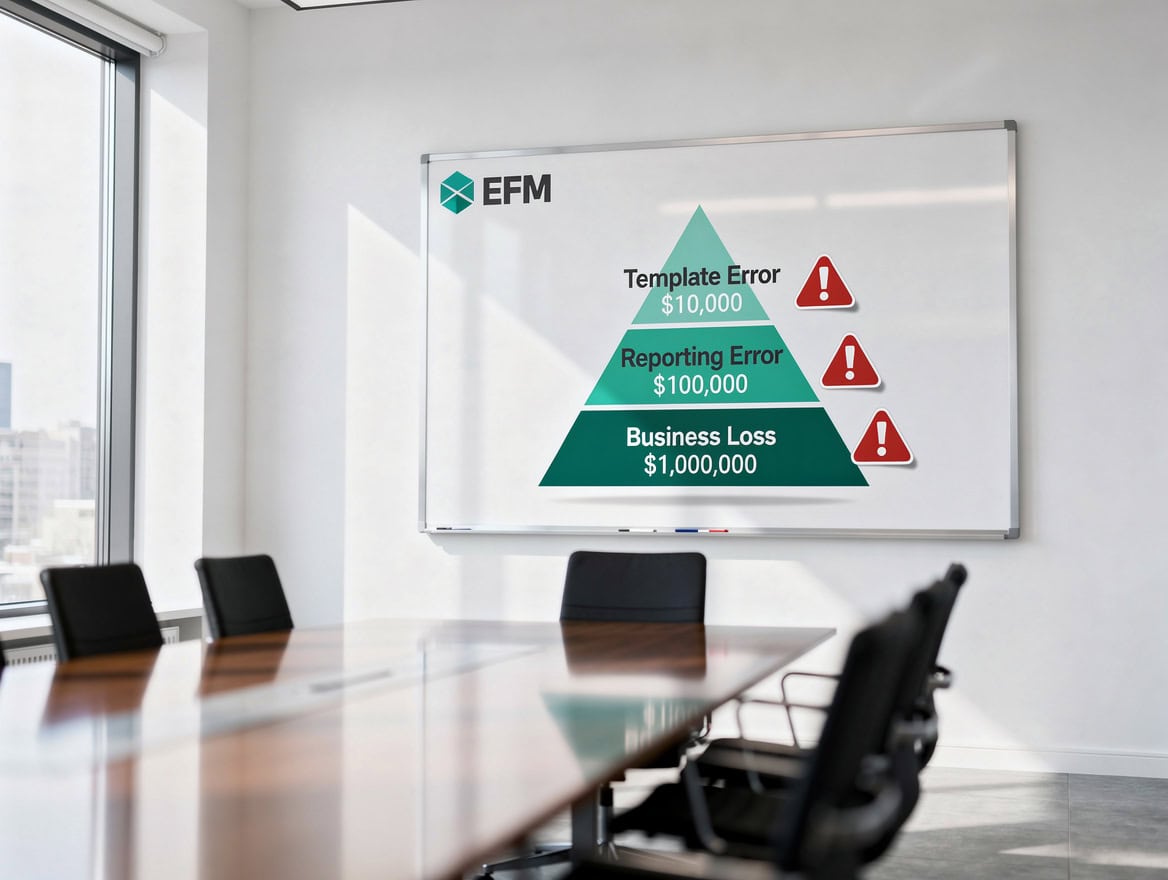
A single formula error in a template can escalate from a spreadsheet mistake to a reported financial loss in three steps.
The True Cost of Spreadsheet Errors: What the Data Shows
The financial consequences of spreadsheet errors are not theoretical. In a field audit of 22 operational spreadsheets used in real organizations, 91% were found to contain significant errors (EuSpRIG, 2007). These weren’t draft files — they were live, decision-driving models.
The most cited single-incident cost: one Excel error led to a $6.2 billion loss in shareholder value (EuSpRIG, 2012). The error was a copy-paste mistake in a risk model that masked the true exposure of a trading portfolio. The model looked correct. It wasn’t.
A review of 25 publicly reported spreadsheet-related incidents found that 44% involved financial reporting or valuation errors (EuSpRIG, 2010). Financial model templates — DCF models, three-statement models, budget templates — produce exactly these outputs. The overlap is not coincidental.
Model errors also contribute to 24% of all internal fraud cases in financial institutions, with spreadsheets cited as a key vulnerability (ACFE Report to the Nations, 2020). A template with poor access controls or no audit trail creates the conditions for both accidental errors and intentional manipulation.
Pre-Purchase Checklist: 8 Essential Quality Indicators
A quality financial template passes all 8 of these checks before you spend a dollar on it. Most vendors provide a preview, demo version, or screenshot gallery — use them to run through this list.
| Quality Indicator | What to Check | Pass Criteria |
|---|---|---|
| Formula Transparency | Can you see and trace every formula? | No locked/hidden formula cells |
| Assumptions Documentation | Is there a dedicated inputs or assumptions tab? | Clearly labeled input cells, color-coded |
| Error-Checking Mechanisms | Does the model flag inconsistencies? | IFERROR, data validation, or check cells present |
| Input/Calculation Separation | Are inputs, calculations, and outputs in separate areas? | Distinct tabs or clearly demarcated sections |
| Version Control | Is there a version number and change log? | Version number visible on cover or header |
| Stress-Testing Capability | Can you run scenarios without breaking the model? | Scenario manager or sensitivity table included |
| Vendor Support | Is documentation or support available post-purchase? | User guide, FAQ, or support contact provided |
| Output Benchmarking | Do outputs match known benchmarks with sample data? | Worked example or sample output included |
For financial reporting templates specifically, also verify that the model separates period-end closing entries from ongoing operational inputs — a common structural failure in lower-quality templates.
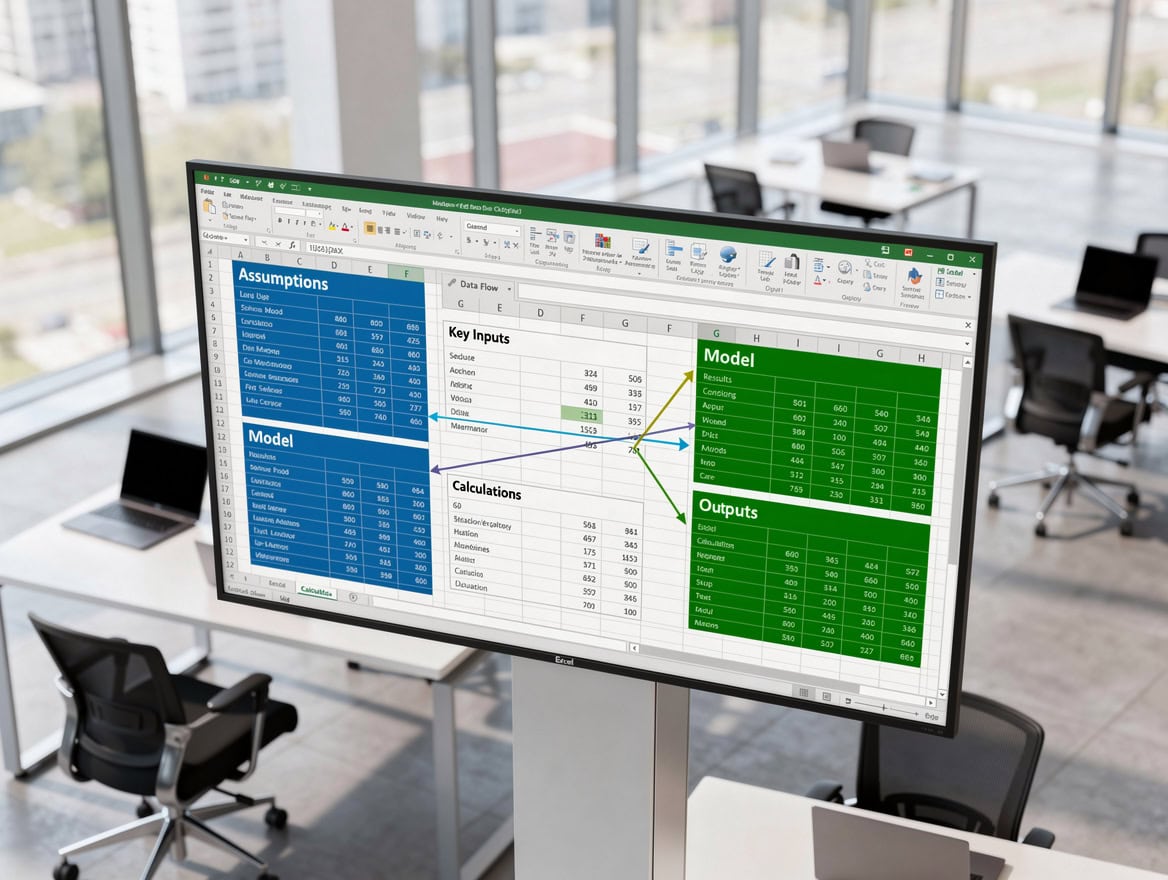
Color-coded input/calculation/output separation is a hallmark of a professionally built financial template.
Evaluating Formula Transparency and Calculation Logic
Formula transparency means you can open any cell in the model and immediately understand what it calculates and why. A template that hides this information is a template you cannot audit — and cannot trust.
Here’s what to look for in the formula bar when you open a preview or demo file:
Named ranges: Quality templates use named ranges (defined names that replace cell addresses like B12 with descriptive labels like Revenue_Growth_Rate). Named ranges make formulas readable. A formula like =Revenue * (1 + Revenue_Growth_Rate) is auditable. A formula like =B12*(1+C4) is not.
Absolute vs. relative references: Absolute references (using $ signs, e.g., $B$4) lock a cell address when a formula is copied. Relative references shift automatically. A template that uses relative references where absolute references are needed will produce silent errors when rows or columns are inserted. Check that discount rates, tax rates, and other fixed assumptions use absolute references.
Hardcoded values inside formulas: A hardcoded value (a number typed directly into a formula rather than referenced from an input cell) is a red flag. For example, =Revenue * 0.21 hardcodes a 21% tax rate. If the tax rate changes, the formula won’t update unless someone manually edits every instance. Quality templates reference a single input cell: =Revenue * Tax_Rate.
Nesting depth: Excel supports up to 64 levels of nested functions (Microsoft Support), but formulas beyond 3-4 levels of nesting become nearly impossible to audit. If you see formulas like =IF(AND(OR(...),NOT(...)),VLOOKUP(...),INDEX(MATCH(...))) stacked 5 levels deep with no explanation, treat it as a red flag.
Excel worksheets can contain up to 1,048,576 rows and 16,384 columns (Microsoft Support), which means a poorly structured template can hide errors across an enormous surface area — another reason formula transparency and named ranges are essential for auditability.
Documentation and User Guidance: Non-Negotiable Requirements
Documentation is the difference between a template you can use confidently and one you have to reverse-engineer every time you open it. Good documentation doesn’t just explain what the model does — it explains why it’s built the way it is.
A professionally built financial template should include all of the following:
- Cover sheet: Model name, version number, date of last update, author or vendor name, and a brief description of the model’s purpose and scope.
- Assumptions tab: Every input assumption listed with its source, unit, and acceptable range. For example: “Revenue Growth Rate: 5-25%, based on industry benchmarks from source.”
- Instructions tab: Step-by-step guidance on how to enter data, which cells to edit, and which cells are locked (protected) and should not be changed.
- Formula notes: Either inline cell comments or a separate reference tab explaining non-obvious formulas. A DCF model, for instance, should document its terminal value methodology (Gordon Growth Model vs. exit multiple) explicitly.
- Change log: A record of what changed between versions. If you’re buying version 3.2 of a template, you should be able to see what was fixed or added since version 3.0.
For complex models like three-statement financial models or DCF valuations, the absence of any one of these documentation elements is sufficient reason to look elsewhere.
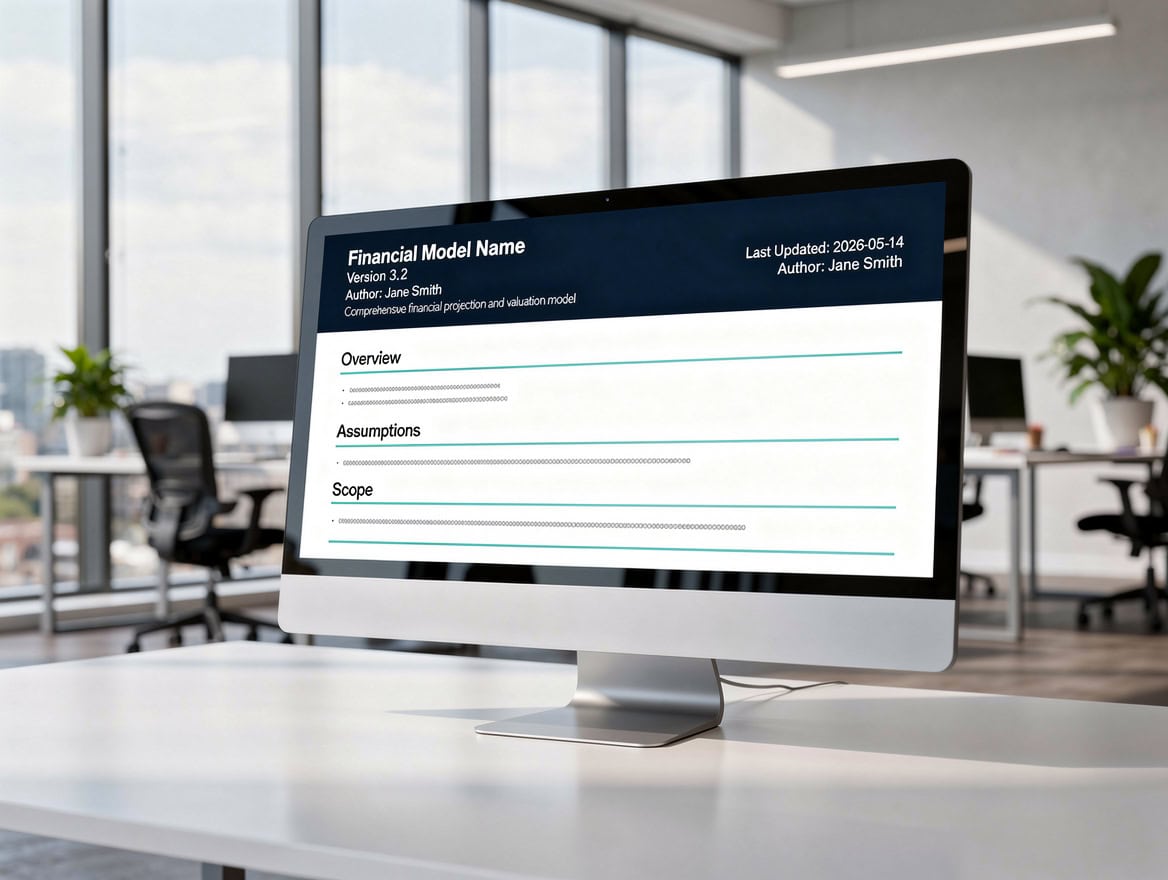
A version number and cover sheet are minimum documentation requirements for any template used in financial reporting.
Built-In Error Prevention and Control Features
Error prevention in a financial template means the model actively resists misuse, not just that it happens to be correct when used perfectly. Look for these specific mechanisms.
Data validation: Input cells should restrict entries to valid ranges. A cell expecting a percentage growth rate should reject text entries and flag values outside a reasonable range (e.g., -100% to 500%). Excel’s built-in Data Validation tool enables this — check whether input cells use it. Excel’s Data Validation feature supports up to 32,767 characters in a custom validation formula (Microsoft Support), giving template builders ample room to implement thorough input constraints.
IFERROR wrapping: Division formulas (e.g., margin calculations) should be wrapped in IFERROR to handle zero-denominator scenarios gracefully. A formula like =IFERROR(Net_Income/Revenue, 0) prevents the #DIV/0! error that breaks downstream calculations.
Check cells: High-quality templates include dedicated check cells that verify internal consistency. A balance sheet model should include a cell that confirms Assets = Liabilities + Equity, displaying “CHECK” or “ERROR” rather than just showing a number. These are sometimes called “balance checks” or “plug checks.”
Circular reference management: Some financial models intentionally use circular references (where a formula refers back to itself, such as interest expense depending on the debt balance, which depends on interest expense). These are legitimate in certain models but must be clearly documented and require iterative calculation to be enabled in Excel settings. A template that uses circular references without documenting them is a liability.
Scenario and sensitivity tools: A template that can only model one scenario is a template that will be abused. Look for a built-in scenario manager, data table, or sensitivity analysis section. The ability to stress-test assumptions without manually overwriting input cells is a core quality feature.
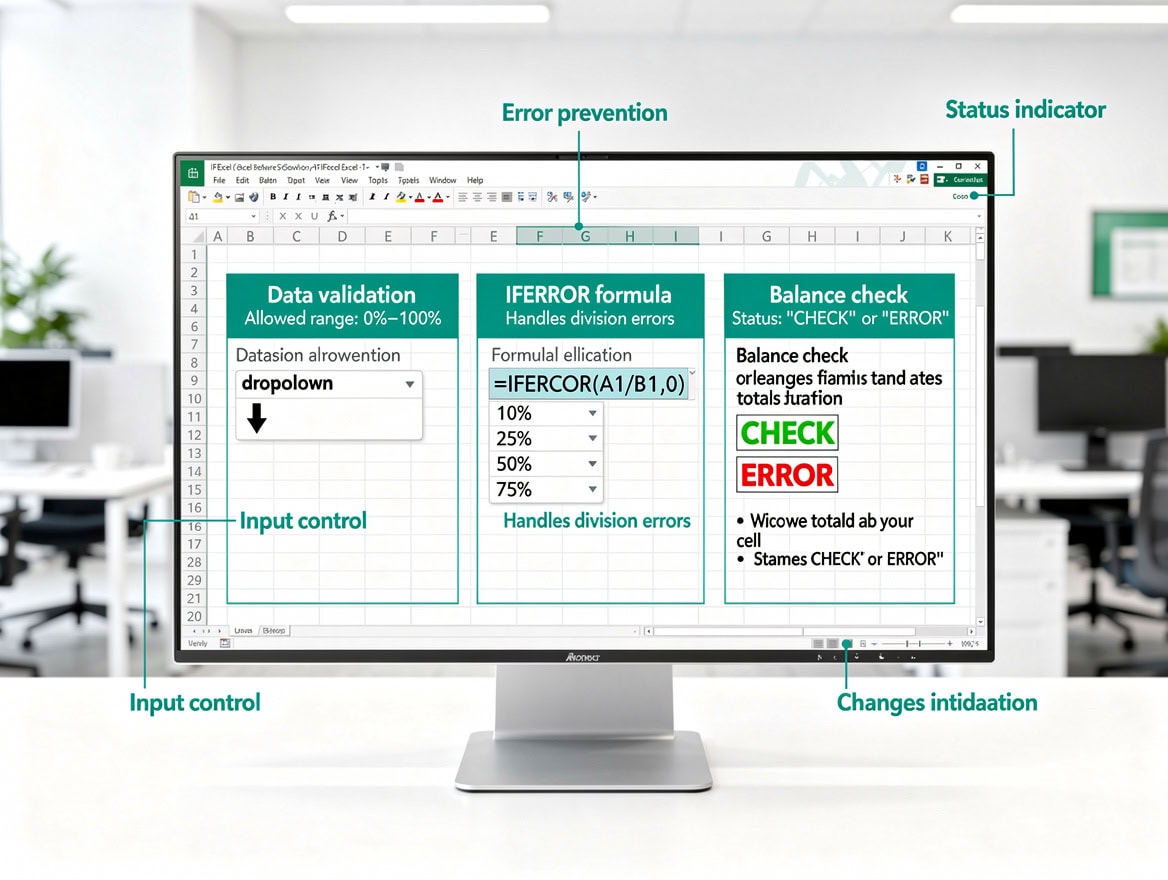
Data validation, IFERROR wrapping, and balance check cells are the three most important built-in error prevention features to look for.
Testing Methodology: How to Validate a Template Before Committing
If the vendor provides a demo or trial version, run this 4-step testing protocol before purchasing.
Step 1: Zero-input test. Enter zeros for all revenue and volume inputs. The model should not produce errors, circular references, or #DIV/0! warnings. It should produce a clean zero-output state. If it breaks on zero inputs, it will break on edge cases in real use.
Step 2: Extreme-value test. Enter an implausibly large number (e.g., $1 billion in revenue for a small business template). Check whether the model scales proportionally. If margins change when they shouldn’t, or if totals don’t add up, the model has structural formula errors.
Step 3: Benchmark test. Use a known dataset with a known correct output. For a DCF model, input a company with publicly available financials and compare the model’s output to a published analyst valuation. For a budget template, input last year’s actuals and verify that the model’s totals match your own calculations.
Step 4: Formula audit. Use Excel’s built-in auditing tools: Formulas tab > Trace Precedents and Trace Dependents. Select 3-5 key output cells and trace their calculation chains. You should be able to follow every number back to an input cell. If a calculation chain dead-ends at a hardcoded number with no input cell, flag it.
Here’s the math for a simple benchmark test on a DCF template:
Assume: Free Cash Flow Year 1 = $100,000, growing at 5% per year for 5 years, discount rate = 10%, terminal growth rate = 2%.
Expected PV of cash flows:
- Year 1: $100,000 / 1.10 = $90,909
- Year 2: $105,000 / 1.21 = $86,777
- Year 3: $110,250 / 1.331 = $82,883
- Year 4: $115,763 / 1.464 = $79,073
- Year 5: $121,551 / 1.611 = $75,452
- Sum of PV: $415,094
Terminal Value = ($121,551 × 1.02) / (0.10 – 0.02) = $123,982 / 0.08 = $1,549,775
PV of Terminal Value = $1,549,775 / 1.611 = $961,997
Total Enterprise Value = $415,094 + $961,997 = $1,377,091
If the template produces a materially different number with these exact inputs, it contains a formula error.
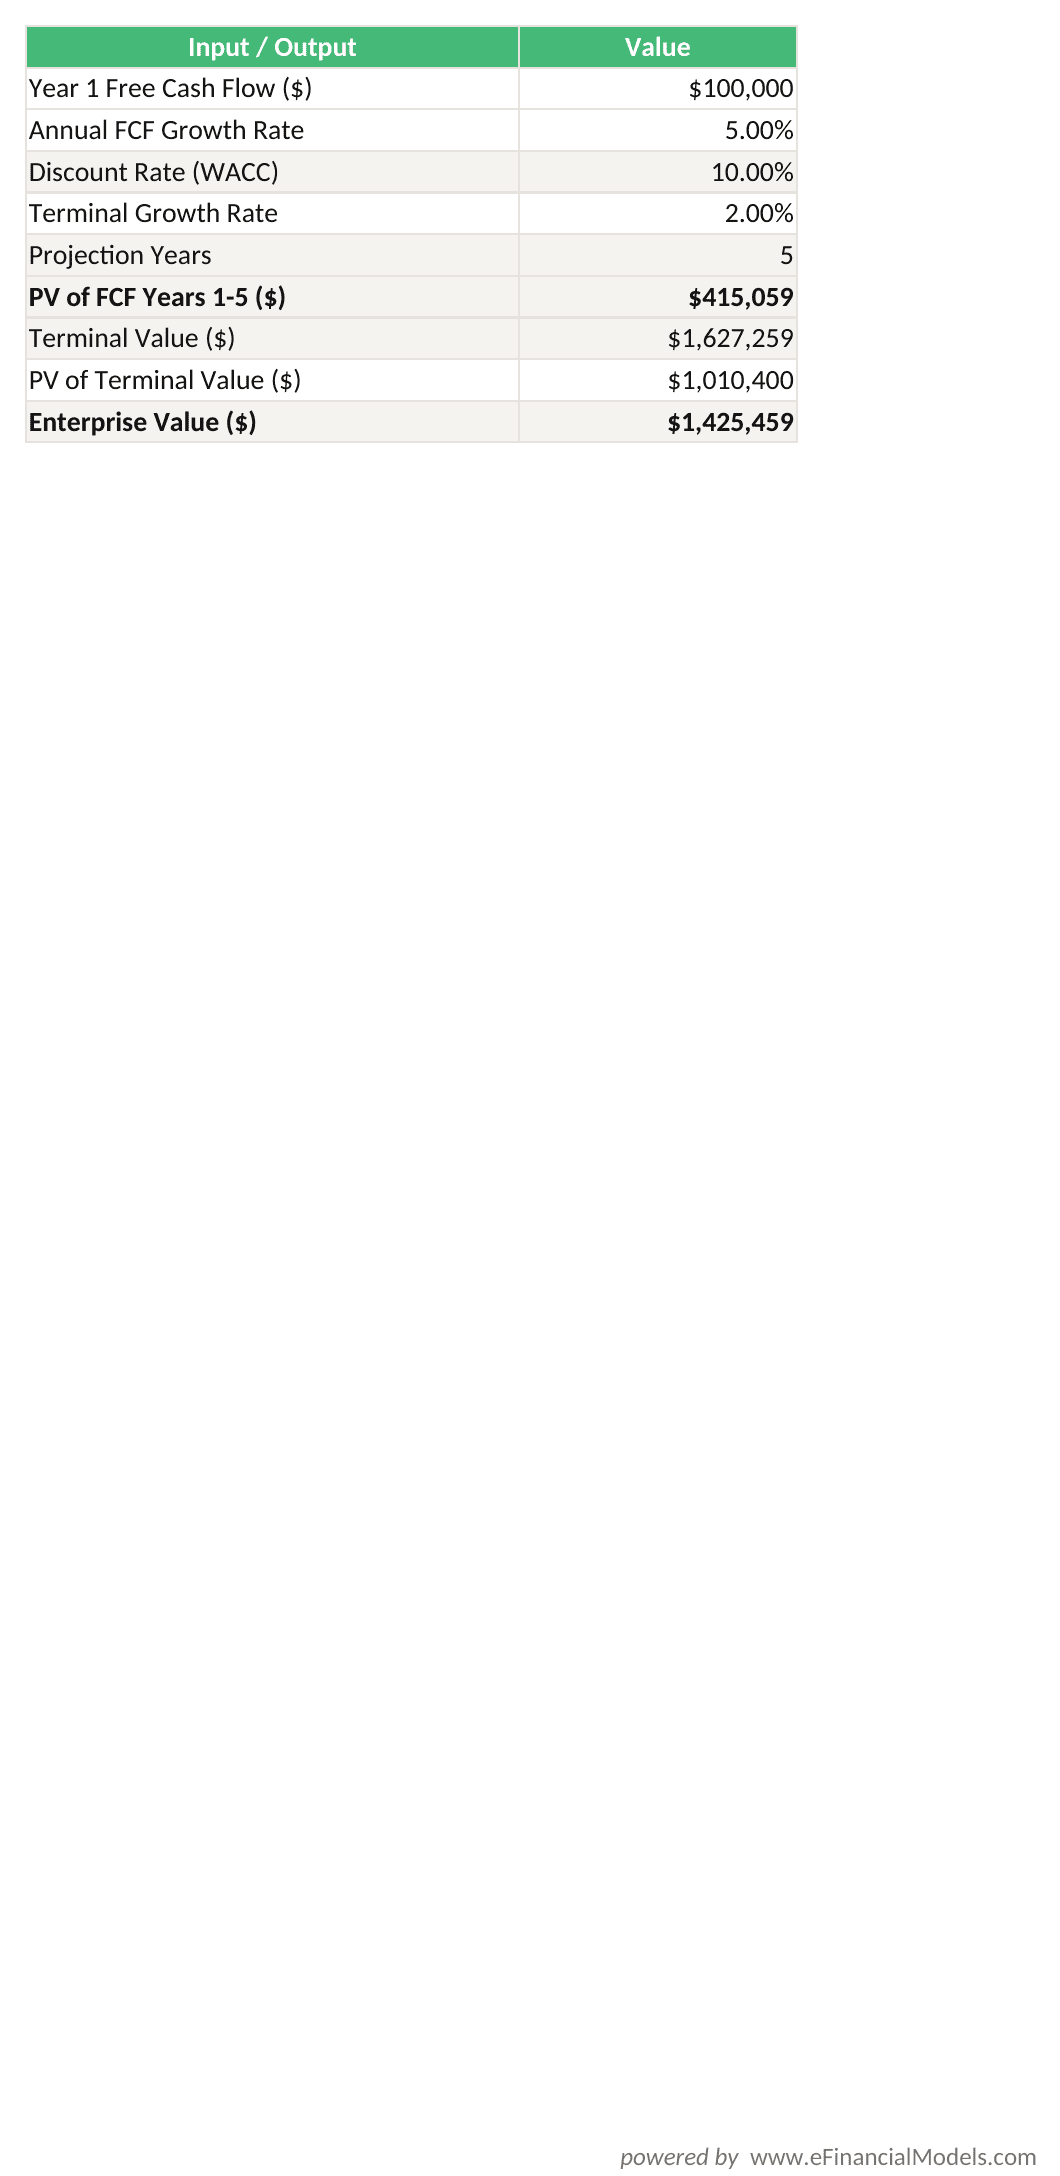
Use these exact inputs to benchmark any DCF template. The correct enterprise value output is $1,377,091. A material deviation indicates a formula error.
Red Flags: Warning Signs of a Poorly Designed Template
These 6 warning signs should stop your evaluation immediately. Each one indicates a structural problem that cannot be fixed by simply updating input values.
- Hardcoded values in calculation cells. If you see numbers typed directly into formulas (e.g.,
=B5*0.35instead of=B5*Tax_Rate), the template will silently produce wrong answers whenever assumptions change.
- No assumptions or inputs tab. A template with no dedicated input section forces users to hunt through calculation sheets to change assumptions — and increases the risk of accidentally overwriting formulas.
- No version number or date. A template with no version information has no change history. You cannot know whether a formula was recently corrected or has been wrong for years.
- Unexplained nested formulas. Formulas that combine 5+ functions with no cell comment or documentation note are a maintenance trap. They’re also a sign the builder prioritized cleverness over auditability.
- No error-handling in division formulas. Any template that calculates margins, ratios, or per-unit figures without
IFERRORprotection will break the moment a denominator hits zero.
- Locked cells with no documentation. Cell protection (locking) is a legitimate feature, but only when the user guide explains what is locked, why, and how to unlock it if needed. Unexplained locked cells suggest the builder is hiding something.
For business financial plan templates, also check whether the cash flow statement links directly to the income statement and balance sheet, or whether it uses manual inputs — the latter is a structural red flag in any integrated model.
Governance Considerations for Finance Teams
For FP&A managers and finance teams, template selection carries governance implications that individual users don’t face. A template used across a team becomes part of the organization’s internal control framework.
Key governance questions to answer before deploying any purchased template:
- Who owns the master version? Templates should have a single controlled master file, not multiple copies circulating via email.
- Is the model auditable by a third party? An external auditor or internal audit team should be able to open the file and trace every calculation without needing to ask the builder for explanations.
- Does the template support access controls? Worksheet protection and workbook password features should be used to prevent unauthorized changes to calculation logic.
- What is the update and support policy? If the vendor releases a corrected version after you’ve already used the template in a report, you need to know how to identify what changed and whether your prior outputs are affected.
A survey of 1,100 Excel-using professionals found that 71% said spreadsheets are critical to their job and 88% use them for more than 5 hours per week (Forrester Research via Microsoft, 2016). At that usage intensity, a flawed template doesn’t create one error — it creates hundreds of downstream errors across every report it touches.
For teams managing multiple model types, a financial model template bundle built to consistent quality standards reduces governance overhead compared to sourcing individual templates from multiple vendors with inconsistent documentation practices.

For FP&A teams, template selection is a team governance decision — the chosen model becomes part of the organization’s internal control framework.
Making the Final Decision: Quality vs. Price Trade-Offs
Price is not a reliable proxy for quality in financial templates. A $500 template can contain more errors than a $50 one. The evaluation criteria above are the only reliable quality signal.
That said, the cost of a template should be weighed against the cost of the errors it might introduce. A DCF model used to support a $10 million acquisition decision has a much higher error cost than a personal budget tracker. Apply proportionally more scrutiny to templates used in high-stakes decisions.
| Template Use Case | Error Cost Potential | Minimum Evaluation Standard |
|---|---|---|
| Personal budgeting | Low | Basic formula check + documentation |
| Departmental budget | Medium | Full 8-point checklist + benchmark test |
| Three-statement model | High | Full checklist + formula audit + governance review |
| DCF / Valuation model | Very High | Full checklist + benchmark test + third-party review |
| Regulatory / Audit filing | Critical | All above + version control + access controls |
For accounts payable and receivable tracking templates, the error cost is medium-to-high because errors compound over time — a mislinked formula in month 1 produces cascading errors through month 12.
Frequently Asked Questions
What is the single most important thing to check in a financial template before buying?
Formula transparency is the single most important check. If you cannot open a cell and immediately understand what it calculates and why, you cannot audit the model — and you cannot trust its outputs. Specifically, look for whether calculation cells reference named input cells or contain hardcoded numbers. A formula like =Revenue * Tax_Rate is auditable. A formula like =B12 * 0.21 is not, because the 0.21 is invisible to anyone who doesn’t already know the tax rate assumption. According to EuSpRIG research, 91% of operational spreadsheets contain significant errors, and hardcoded values are one of the most common sources. Formula transparency is the fastest way to detect this class of error before purchase.
How do I test a DCF template if I don’t have access to the full version before buying?
Most vendors provide screenshots or a locked preview. Use the benchmark test described in this article: input a simple set of assumptions (e.g., $100,000 Year 1 FCF, 5% growth, 10% discount rate, 2% terminal growth) and calculate the expected enterprise value manually. The correct answer for those inputs is approximately $1,377,091. If the template’s sample output section shows a worked example, verify that the numbers are internally consistent. Also check whether the preview shows formula cells or just values — a preview that only shows numbers, not formulas, is a red flag that the model may use hardcoded outputs rather than live calculations.
What does ‘input/calculation separation’ mean and why does it matter?
Input/calculation separation means the model keeps user-editable assumption cells (inputs) physically separate from the formulas that use those assumptions (calculations). In practice, this usually means a dedicated “Inputs” or “Assumptions” tab where you enter all your data, and separate “Calculations” or “Model” tabs where the formulas run. This matters for two reasons. First, it prevents users from accidentally overwriting a formula when they mean to change an assumption. Second, it makes the model auditable: an auditor can review all assumptions in one place without hunting through calculation sheets. Templates that mix inputs and calculations in the same cells are significantly harder to audit and significantly easier to break.
Are more complex templates with advanced formulas safer or riskier?
More complex templates are generally riskier unless the complexity is well-documented and serves a clear purpose. Excel supports up to 64 levels of nested functions (Microsoft Support), but formulas beyond 3-4 levels of nesting become nearly impossible to audit without significant time investment. A template that uses array formulas (formulas that process multiple values simultaneously, entered with Ctrl+Shift+Enter in older Excel versions) or dynamic array functions (like FILTER, SORT, or XLOOKUP) is not inherently bad, but these features must be documented. The test is simple: can you explain every formula in the model to a colleague in plain English? If not, the complexity is a liability.
What questions should I ask a template vendor before purchasing?
Ask these 5 questions before committing: (1) What version is this, and what changed from the previous version? (2) Does the template include a user guide or documentation tab? (3) What is your support policy if I find a formula error after purchase? (4) Has this template been independently reviewed or tested? (5) What Excel version is required, and are there known compatibility issues with newer versions? A vendor who cannot answer questions 1, 2, and 3 confidently is a vendor whose template has not been maintained to a professional standard. Quality vendors document version history and stand behind their error-checking.
How do I evaluate a template for use in a regulated or audit environment?
For regulated environments (financial reporting, SEC filings, bank stress testing), apply the full 8-point checklist plus three additional requirements. First, the template must support version control: every change to the model must be logged with a date, description, and the name of the person who made it. Second, all input cells must be clearly distinguished from formula cells, typically through color-coding (blue for inputs, black for formulas is a common convention). Third, the model must produce a printable audit trail showing all assumptions and their sources. If the template does not meet all three of these requirements, it is not suitable for a regulated environment regardless of its other qualities.
Can I fix a poorly designed template after buying it, or should I always start fresh?
You can fix some issues, but the cost of fixing a poorly designed template often exceeds the cost of buying a better one. Replacing hardcoded values with input cell references is feasible but time-consuming. Adding documentation is straightforward. However, fixing structural problems — like a cash flow statement that doesn’t link to the income statement, or a model that mixes inputs and calculations throughout — typically requires rebuilding the model from scratch. The 44% rate of financial reporting errors in spreadsheet incidents (EuSpRIG, 2010) suggests that partial fixes often miss hidden errors. If a template fails more than 2 of the 8 quality indicators in the pre-purchase checklist, the safer decision is to find a different template.
Conclusion
Template evaluation is a due diligence process, not a shopping exercise. The data is unambiguous: spreadsheet errors are common, consequential, and concentrated in exactly the outputs that financial templates produce. The 8-point checklist in this article gives you a repeatable, testable framework for separating professionally built templates from ones that will create problems the moment you use them in a real decision.
The cost of a rigorous evaluation is 30-60 minutes. The cost of deploying a flawed template into a financial report, a valuation, or a board presentation can be measured in millions.
I recommend exploring the EFM library of professionally designed financial model templates — each built with the formula transparency, documentation standards, error-checking mechanisms, and governance features outlined in this guide. Every template includes a dedicated assumptions tab, visible formula logic, and version documentation so you can deploy with confidence.
























































