
0 ITEMS

Biotech rNPV Valuation Model Pro (Risk-Adjusted)
FinModelAI Biotech rNPV Valuation Model Pro is a purpose-built Excel template for valuing pharmaceutical and biotech assets using the industry-standard risk-adjusted NPV (rNPV) methodology. Designed for analysts, portfolio managers, and investors who need to value early-stage and late-stage drug assets with rigorous probability-of-success (PoS) weighting at every clinical phase, this model delivers institutional-grade pharma valuation in a clean, macro-free Excel workbook.


Overview
FinModelAI Biotech rNPV Valuation Model Pro is a purpose-built Excel template for valuing pharmaceutical and biotech assets using the industry-standard risk-adjusted NPV (rNPV) methodology. Designed for analysts, portfolio managers, and investors who need to value early-stage and late-stage drug assets with rigorous probability-of-success (PoS) weighting at every clinical phase, this model delivers institutional-grade pharma valuation in a clean, macro-free Excel workbook.
The model covers a 20-year projection horizon, with approximately 1,200+ auto-calculating formulas, zero macros, and zero circular references. It produces a complete rNPV analysis — including cumulative PoS to launch, R&D costs weighted by probability of reaching each phase, risk-adjusted revenues with S-curve uptake, patent cliff and generic erosion, rNPV vs unrisked NPV comparison, and option value — and now also a full company-level 3-statement model (P&L, Cash Flow Statement, and a Balance Sheet that ties out), all driven from a single Assumptions tab and a dedicated Clinical Phases input sheet.
Why This Model
Most valuation models available online apply a single discount rate to a generic revenue forecast. Pharma and biotech valuation doesn’t work that way. Drug development involves discrete binary outcomes at each clinical gate — Phase 1, Phase 2, Phase 3, NDA filing — each with its own historical success probability. A model that does not explicitly apply PoS at each phase does not properly reflect the economics of a drug pipeline. This model was built from the ground up with pharma-specific mechanics:
- Per-phase Probability of Success (PoS) — Preclinical, Phase 1, Phase 2, Phase 3, and NDA each carry their own configurable PoS input. Cumulative PoS to launch is calculated automatically and flows into every revenue and cost line.
- R&D spending probability-weighted — R&D costs in each phase are multiplied by the probability of actually reaching that phase, reflecting the reality that spending in Phase 3 is contingent on surviving Phase 1 and Phase 2.
- Revenue risk-adjusted by cumulative PoS — Peak sales, launch revenues, and all commercial-stage cash flows are discounted by the cumulative probability of ever reaching the market — not by a blanket haircut applied at the end.
- S-curve market uptake — Commercial ramp follows a logistic adoption curve, not a straight-line assumption, reflecting how new drugs actually penetrate their target markets.
- Patent cliff and generic erosion — Revenue decline post-patent expiry is explicitly modeled with configurable generic erosion rates and timing.
- rNPV vs Unrisked NPV — Both metrics are calculated and displayed side by side, letting users quantify exactly how much value is being destroyed by clinical risk vs the fully de-risked (unrisked NPV) scenario.
- Option value — The probability-weighted present value of reaching commercialization is calculated as a real-option metric, providing a floor valuation for pipeline assets pre-approval.
- Full company-level 3-statement model — beyond the asset rNPV, the workbook now rolls the risk-adjusted economics into an integrated P&L, Cash Flow Statement, and Balance Sheet that balances every period, so the valuation sits inside a complete set of financials rather than a standalone DCF.
What’s Inside (Tab by Tab)
1) START HERE — Workflow guide, color code legend (blue = inputs, black = formulas, green = cross-sheet links), model structure overview. Start here before touching anything else.
2) Dashboard — Executive summary with 8 key performance indicators and 4 auto-updating charts: rNPV vs Unrisked NPV waterfall, revenue build with PoS weighting, cumulative PoS by phase, and sensitivity heatmap. Key metrics displayed at a glance: rNPV, Unrisked NPV, Cumulative PoS to launch, Peak Net Sales, Launch Year, Total R&D to launch, Option Value, rNPV per share.
3) Assumptions — Centralized input hub for all model drivers: asset name, indication, lead compound, drug class, peak penetration, addressable patient population, pricing (WAC/net price), WACC, start year, patent expiry, generic erosion rate, equity shares outstanding, and tax rate. All blue cells, all in one place.
4) Clinical Phases — Dedicated input sheet for clinical development timeline and probability of success. Input phase start/end years and PoS for each gate: Preclinical, Phase 1, Phase 2, Phase 3, and NDA. Cumulative PoS to launch and probability-weighted time in development calculated automatically. R&D cost per phase entered here — spent amounts are probability-weighted downstream.
5) Market & Revenue — Commercial revenue build-up: addressable patient population, diagnosed and treated patient funnel, market share ramp with S-curve uptake, peak penetration (probability-unweighted), and a full 20-year net revenue schedule. Patent cliff applied in the year of LOE (loss of exclusivity); generic erosion rate applied thereafter.
6) rNPV Valuation — Core valuation tab. Risk-adjusted cash flows (revenues net of COGS, SG&A, and R&D, all PoS-weighted) are discounted at WACC to produce rNPV. Unrisked NPV calculated in parallel using the same cash flows without PoS weighting. Both NPV metrics, option value, and rNPV per share displayed with the full DCF schedule.
7) Costs & Margins — Gross-to-net adjustments (rebates, discounts), COGS build-up (manufacturing cost per unit + royalties), SG&A expense ramp (fixed pre-launch investment + % of revenue post-launch), R&D phase spending, and probability-weighted total R&D to launch.
8) Financial Statements — Full company-level 3-statement model added in this release: an Income Statement (revenue through R&D, SG&A, COGS, operating income, taxes, net income), a Cash Flow Statement (operating, investing, financing), and a Balance Sheet (cash, receivables, PP&E, debt, equity) with an automatic balance check that ties out every period. This places the rNPV valuation inside a complete set of financials rather than a standalone DCF schedule.
9) Sensitivity — Two live sensitivity tables (formula-based, no Excel Data Tables required): (1) rNPV vs Peak Market Penetration × Phase 3 PoS, (2) rNPV vs WACC × Net Price per Patient. Provides immediate intuition for which assumptions drive value most.
10) Scenarios — Base / Bull / Bear scenario analysis with toggle. Each scenario adjusts PoS rates, peak penetration, pricing, and WACC simultaneously. Side-by-side comparison of rNPV, Unrisked NPV, and Cumulative PoS across all three scenarios.
11) Comparison — Multi-asset portfolio view. Supports up to 8 drug assets with individual rNPV inputs, allowing portfolio-level valuation with risk-adjusted NAV summation. Useful for BD/licensing analysis and multi-program pipeline reviews.
12) Methodology — Pedagogical reference tab. Explains rNPV methodology, how cumulative PoS is calculated, the difference between rNPV and NPV, historical PoS benchmarks by clinical phase (from industry databases), S-curve uptake logic, and patent cliff mechanics. A structured, in-workbook methodology reference of this kind is rarely included in competing templates — and it is the model’s clearest point of difference.
13) Glossary — 28 biotech, pharma, and finance terms defined: rNPV, PoS, LOE, WAC, NME, IND, NDA, BLA, WACC, S-curve, patent cliff, generic erosion, option value, unrisked NPV, cumulative PoS, and more.
Key Outputs
Metric
Demo Case: RX-7741 (NSCLC, Base Case)
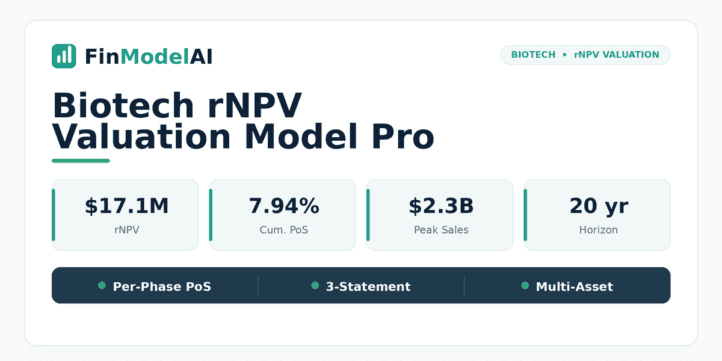
rNPV
+$17.1M
Unrisked NPV
$506.9M
Cumulative PoS to Launch
7.94%
Peak Net Sales
$2,305.7M
Launch Year
Year 10
Total R&D to Launch
$215M
Option Value
$232.1M
rNPV per Share
$0.34
Who It’s For
- Biotech and pharma analysts at investment banks, hedge funds, and asset managers valuing drug pipeline assets for coverage initiation, deal pricing, or portfolio monitoring
- Business development and licensing teams at pharma companies evaluating in-licensing, out-licensing, and M&A targets
- Venture capital and growth equity investors in life sciences needing a disciplined rNPV framework for portfolio company valuation
- Corporate finance teams at pharma/biotech companies building investor presentations, board materials, or capital allocation analyses around pipeline NPV
- CRO and regulatory consultants needing to communicate the financial impact of PoS improvements at each clinical gate
- MBA students and analysts learning pharmaceutical finance, clinical development economics, and risk-adjusted valuation methodology
What Makes It Different
Per-phase PoS weighting and multi-asset rollups are table stakes in this category — capable competing rNPV templates implement them too. We do not claim those as unique. Where this model genuinely stands apart is in being self-explanatory and complete: a built-in methodology reference, a full 3-statement model, a 20-year horizon, and an 8-asset portfolio view — at a meaningfully lower price than the category bestseller.
Methodology Tab — The Real Differentiator — A structured, in-workbook reference explains rNPV mechanics, how cumulative PoS is computed multiplicatively, the difference between rNPV and unrisked NPV, historical PoS benchmarks by clinical phase, S-curve uptake logic, and patent-cliff mechanics. Most competing templates hand you the calculation without explaining the framework behind it. For a buyer who has to defend a valuation to an investment committee, licensing counterparty, or board, that transparency is the point — and it is genuinely hard to find elsewhere.
Full 3-Statement Model Added — Beyond the asset rNPV, the workbook now includes a company-level P&L, Cash Flow Statement, and Balance Sheet that balances every period, so the valuation lives inside a complete set of financials rather than a standalone DCF.
Per-Phase PoS, Not a Single Haircut — Phase-specific PoS (Preclinical → Phase 1 → Phase 2 → Phase 3 → NDA) is computed cumulatively and multiplicatively, with every cost and revenue line carrying its own risk weight. R&D spend in each phase is multiplied by the probability of actually reaching that phase. This is the methodologically correct approach, and it is implemented cleanly and transparently here.
S-Curve Commercial Uptake — Revenue ramp follows a configurable logistic curve, not a flat-line 20%/40%/60%/80%/100% assumption, producing more realistic launch trajectories.
Patent Cliff + Generic Erosion Modeled Explicitly — Revenue continues through patent expiry with configurable generic erosion rates, capturing the real economics of a drug’s commercial life cycle through loss of exclusivity.
rNPV vs Unrisked NPV Side by Side — Both rNPV (probability-weighted) and unrisked NPV (100% probability assumed) are calculated in the same framework, with the delta — the value destroyed by clinical risk — displayed explicitly.
8-Asset Portfolio View — The Comparison tab supports up to 8 drug assets, enabling portfolio-level rNPV summation for pipeline reviews, BD screening, or fund-level NAV builds.
20-Year Horizon — The projection window now runs 20 years, long enough to capture a full commercial life cycle from launch through loss of exclusivity and generic erosion for most assets.
Sensitivity Without Data Tables — Both sensitivity tables are formula-driven rather than Excel Data Table-dependent, ensuring full compatibility across Excel versions, operating systems, and shared workbooks.
Technical Notes / Compatibility
- Built for Microsoft Excel (Windows and Mac)
- No VBA / macros, no circular references
- Approximately 1,200+ auto-calculating formulas, zero formula errors
- Compatible with Google Sheets (some charts may render differently)
- Currency, start year, WACC, and all PoS rates are parameterizable from the Assumptions and Clinical Phases tabs
- 20-year projection horizon (configurable start year)
- Full company-level 3-statement model (P&L, Cash Flow, Balance Sheet) with automatic balance check
Files Included
- 1 Excel file: FinModelAI_Biotech_rNPV_Pro.xlsx
- START HERE tab + Methodology tab + Glossary included inside the workbook
Disclaimer
This template is provided for educational and analytical purposes only. It does not constitute financial, investment, medical, legal, or regulatory advice. Users are responsible for verifying all assumptions and outputs against asset-specific data and current industry benchmarks. Consult qualified professionals before making investment, licensing, or financing decisions related to drug development assets.
Similar ProductsOther customers were also interested in...



 eFinancialModels
Electric Vehicle (EV) Charging Station Financial M...
With this comprehensive 5- or 10-year monthly tool, investors can assess the viability of setting up... Read more

Financial Model for Mobile App | Mobile App Busine...
The Mobile App Financial Plan Template in Excel allows you to develop financial projections when lau... Read more

 HenrySheykin
Food Truck Financial Model Excel Template
The Food Truck Financial Model helps entrepreneurs, founders, business owners, consultants, and anal... Read more

Green Hydrogen Production from Wind Energy Financi...
The Green Hydrogen from Wind Financial Model aims to comprehensively forecast a horizon of 40 years ... Read more

Simple Mutual Non-Disclosure Agreement Template
Protect your business secrets with ease using our Simple Mutual Non-Disclosure Agreement Template. S... Read more

Solar Energy Financial Model
The Solar Energy Financial Model Spreadsheet Template in Excel assists you in preparing a sophistica... Read more

 Peter Graf
The Customer-Centric Financial Model for Restauran...
Starting a restaurant without a financial plan is like driving a car blindfolded. You wouldn´t do i... Read more
You must log in to submit a review.