
0 ITEMS

Multi-Year M&A / Merger Model — Accretion/Dilution, 5-Year Debt Schedule, PPA & EPS Bridge (Excel + Google Sheets)
A 9-tab Excel & Google-Sheets merger model: 5-year accretion/dilution on GAAP and cash-EPS bases, a 5-year debt schedule with no circular references, the as-reported CVS/Aetna purchase-price allocation, and a synergy sensitivity. Arithmetic-only, no macros.
| All Industries, Financial Model, General Excel Financial Models |
| Excel, Financial Model, Mergers and Acquisitions Model |

The M&A Merger Model — Multi-Year is a full investment-banking merger-consequences model for IB analysts, corporate-development and FP&A teams, and senior finance students who need to determine — and defend — whether an acquisition is accretive or dilutive to EPS across a five-year horizon, not just year one. Enter the acquirer and target financials, the cash/stock/new-debt consideration, the synergies and tax, and the debt-sweep drivers, and the model builds the pro-forma combined company, a 5-year debt schedule, the purchase-price allocation, and a 5-year EPS bridge on both GAAP and cash-EPS bases. It ships pre-filled with a complete, fully sourced worked deal.
The model is transparent — no black box. The pro-forma earnings build uses the standard merger-consequences identities, and interest is charged on the beginning debt balance so the debt schedule contains no circular reference and recalculates cleanly with iterative calculation off. It is built on arithmetic-only formulas (SUM/IF/IFERROR/MAX/MIN) and runs unchanged in Microsoft Excel and Google Sheets.
**Model Structure — Excel (9 tabs)**
1. **START HERE** — what the model does, input order, and the method in plain English
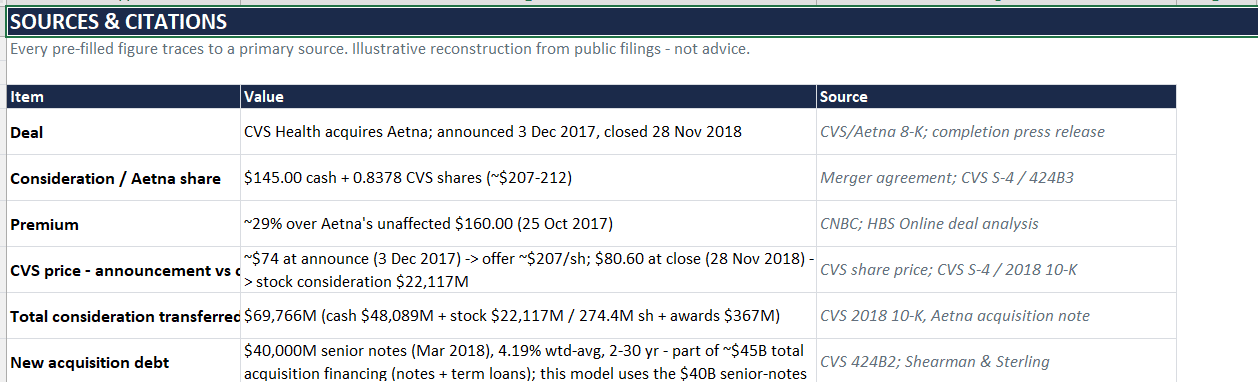
2. **Sources** — every pre-filled figure with its primary-source citation
3. **Assumptions** — acquirer & target financials, consideration, financing, synergies, tax, and debt-sweep drivers (all in $ millions; the only tab you edit)
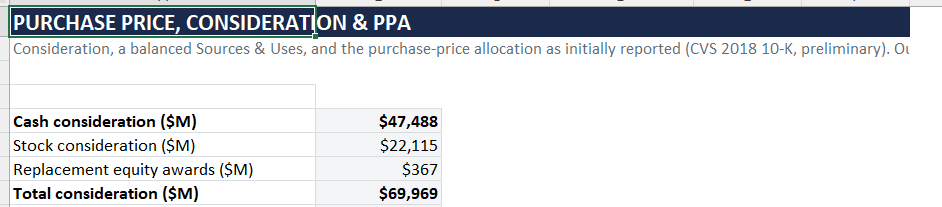
4. **Purchase Price & PPA** — consideration, a balanced Sources & Uses, and the as-reported intangible allocation with a per-class amortization schedule
5. **Debt Schedule** — 5-year beginning-balance interest, mandatory note maturities and a cash sweep, deleveraging year by year
6. **Accretion-Dilution** — the 5-year pro-forma EPS bridge vs standalone, on GAAP and cash-EPS bases, with a verdict
7. **Sensitivity** — first-year accretion across a range of synergy levels, with a chart
8. **Dashboard** — headline metrics and the multi-year accretion chart
9. **License** — terms of use, disclaimer, limitation of liability
**Key Methodological Features**
– 5-year accretion/dilution on BOTH GAAP and cash (ex-intangible-amortization) EPS bases
– Cash, stock, and new-debt consideration, each carrying its true after-tax earnings cost
– A 5-year debt schedule with mandatory maturities and a cash sweep — no circular reference
– The as-reported purchase-price allocation, with per-class intangible lives and amortization
– A balanced Sources & Uses that ties to zero
– Input validation on every input cell; all inputs and outputs in $ millions
– Arithmetic-only — runs in both Excel and Google Sheets; no macros, no VBA, no add-ins
**Worked Example**
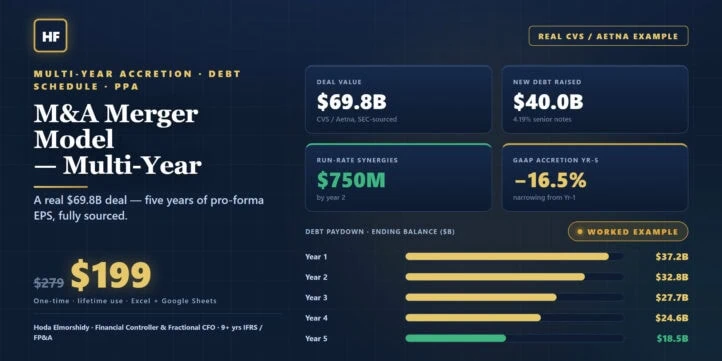
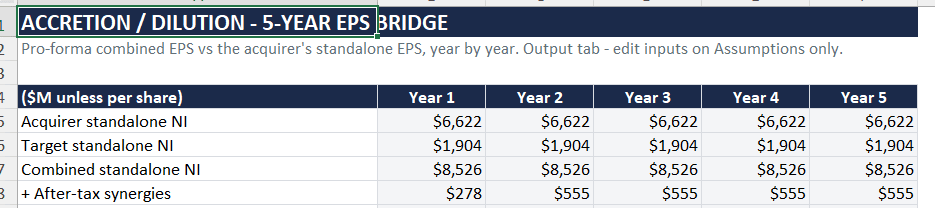
Pre-loaded with the real CVS Health acquisition of Aetna (announced 3 Dec 2017, closed 28 Nov 2018): $145.00 cash + 0.8378 CVS shares per Aetna share (~$207 offer, ~29% over Aetna’s unaffected $160), ~$69.8B total consideration, $40.0B of new senior notes at a 4.19% blended coupon, $750M of run-rate synergies by year two, and CVS’s as-reported PPA ($46.7B goodwill, $23.7B identifiable intangibles). On a trailing-FY2017, zero-growth, no-step-up GAAP basis the deal is dilutive and narrows from −29.7% (year 1) to −16.5% (year 5) as synergies ramp, the debt deleverages from $40.0B to $18.5B, and the 3-year technology intangible rolls off; on a cash-EPS basis the dilution is −11.2% to −2.3%. Every figure is cited on the Sources tab. Replace the inputs with any deal’s figures and every output re-prices.
**Suitable For**
– Investment-banking analysts and associates preparing accretion/dilution analysis
– Corporate-development and FP&A teams evaluating a multi-year acquisition
– Senior finance and MBA candidates learning the full merger-consequences build
– Users on Microsoft Excel 2016/2019/2021/365 or Google Sheets
**Technical Specifications**
– Format: .xlsx (Excel edition) + .xlsx (Google-Sheets-safe edition) + Methodology PDF
– Compatibility: Excel 2016, 2019, 2021, Microsoft 365 (Windows and Mac) and Google Sheets
– No macros, no VBA, no add-ins — arithmetic-only formulas
– 9 tabs · 208 formulas · input validation on every input cell · all inputs in $ millions
– Delivery: instant digital download · single-user license
────────────────── FAQs ──────────────────
Q: How is this different from a single-period accretion model?
A: It shows five years — accretion changes annually as the acquisition debt pays down and intangibles roll off — and it separates GAAP EPS from cash/adjusted EPS.
Q: Does the debt schedule have circular references?
A: No. Interest is on the beginning balance, so each year depends only on the prior year’s ending balance — clean recalculation with iterative calc off.
Q: Is the CVS/Aetna data real?
A: Yes — an illustrative reconstruction from public SEC filings, every figure cited on the Sources tab. Not investment advice; not affiliated with or endorsed by either company.
Q: Does it work in Google Sheets?
A: Yes — a Google-Sheets-safe edition is included; arithmetic-only formulas. Charts may need a one-click refresh on import.
Q: Can I model an asset deal with a tax step-up?
A: Yes — toggle the intangible-amortization deductibility flag on the Assumptions tab.
Q: What’s included?
A: Excel edition, Google-Sheets-safe edition, and the Methodology PDF — one download, one price ($199).
────────────────── ABOUT THE AUTHOR ──────────────────
Built by Hoda Elmorshidy — Financial Controller & Fractional CFO, 9+ years in
IFRS reporting, FP&A, commodity trading, CFO/board reporting, UAE VAT & Corporate
Tax, and finance automation. Practitioner-grade tools, not generic templates.
────────────────── LICENSE ──────────────────
• License grant: Single-user, non-transferable, perpetual license for your own or your organization’s internal use. No resale, redistribution, sublicensing, or repackaging of the file or its templates.
• As-is warranty: Provided “as is” without warranty of any kind, express or implied, including merchantability or fitness for a particular purpose.
• Limitation of liability: To the maximum extent permitted by law, total liability for any claim arising from this product is limited to the amount you paid for it. Not liable for indirect, incidental, or consequential losses.
• Your statutory rights: Nothing here limits rights that cannot be excluded under the consumer-protection law of your jurisdiction.
• Governing terms: This purchase is governed by the terms of the platform you bought it on (Etsy / Gumroad / eFinancialModels) and by the consumer-protection law of your own country of residence. Where those permit, the limitations above apply to the maximum extent allowed.
────────────────── DISCLAIMER ──────────────────
This template is an analytical and educational tool, not professional financial,
investment, tax, accounting, or legal advice, and its use creates no professional
relationship. All assumptions and figures are illustrative — verify against your
own data and current standards (IFRS/GAAP, tax rates) before relying on any
output. The author accepts no liability for decisions made using this model.
Last reviewed: June 2026.
WORKED EXAMPLE — PUBLIC DATA: The pre-filled CVS Health / Aetna figures are an
illustrative reconstruction from public SEC filings (see the Sources tab). Not
affiliated with, endorsed by, or sponsored by CVS Health or Aetna. ASC 805 / IFRS 3;
goodwill not amortized (ASC 350 / IAS 36). PPA shown is CVS’s allocation as initially reported in the 2018 10-K, later finalized via measurement-period adjustments in CVS’s FY2019 10-K.
Similar ProductsOther customers were also interested in...



 eFinancialModels
Electric Vehicle (EV) Charging Station Financial M...
With this comprehensive 5- or 10-year monthly tool, investors can assess the viability of setting up... Read more

Financial Model for Mobile App | Mobile App Busine...
The Mobile App Financial Plan Template in Excel allows you to develop financial projections when lau... Read more

 HenrySheykin
Food Truck Financial Model Excel Template
The Food Truck Financial Model helps entrepreneurs, founders, business owners, consultants, and anal... Read more

Green Hydrogen Production from Wind Energy Financi...
The Green Hydrogen from Wind Financial Model aims to comprehensively forecast a horizon of 40 years ... Read more

Simple Mutual Non-Disclosure Agreement Template
Protect your business secrets with ease using our Simple Mutual Non-Disclosure Agreement Template. S... Read more

Solar Energy Financial Model
The Solar Energy Financial Model Spreadsheet Template in Excel assists you in preparing a sophistica... Read more

 Peter Graf
The Customer-Centric Financial Model for Restauran...
Starting a restaurant without a financial plan is like driving a car blindfolded. You wouldn´t do i... Read more
You must log in to submit a review.