
0 ITEMS

US Multifamily & BTR: 2026 Supply Cliff Creates Opportunity
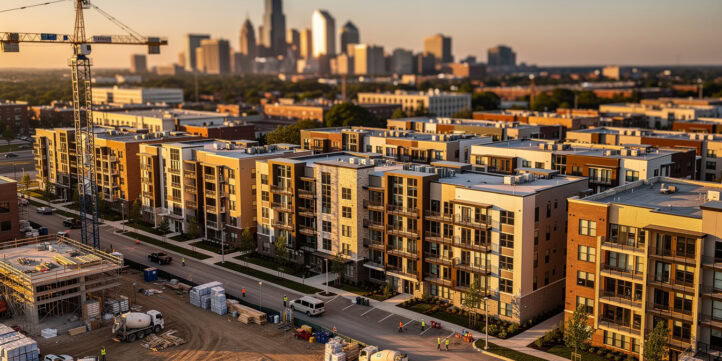
The US rental housing market is at a turning point: two years of record apartment deliveries are giving way to the sharpest supply drop in roughly a decade, and the investors who understand that timing will capture the recovery.
Key Takeaways
- Apartment completions fall to roughly 350,000–440,000 units in 2026, the lowest annual total since around 2014, after a near-50-year high of approximately 590,000 in 2024.
- National vacancy sits at about 8.2% entering 2026, but the base case projects it easing to 7.5% by 2030 as supply tightens and absorption holds.
- Build-to-rent (BTR) is the fastest-growing residential segment, expanding at roughly 27–28% per year, with institutional capital deployment rising from about US$14.8 billion in 2024 to roughly US$25.4 billion in 2025.
- Multifamily loan maturities jump roughly 56% to about US$162 billion in 2026, creating both the sector’s largest near-term risk and its clearest distressed-acquisition opportunity.
- Three scenarios to 2031: Base Case projects a 1.8% rent-growth CAGR and 7.5% vacancy; Bear Case projects 0.5% CAGR and 9.0% vacancy; Bull Case projects 3.0% CAGR and 6.3% vacancy.
- Cost-burdened renter households—those paying more than 30% of income on housing—have reached an all-time high of about 22.7 million, anchoring durable demand regardless of the supply cycle.
- The FHFA raised Fannie Mae and Freddie Mac 2026 multifamily loan-purchase caps to US$88 billion each (US$176 billion combined), up from US$146 billion in 2025, to absorb the maturity wall.
What the 2026 Supply Cliff Actually Means
The defining feature of the 2026–2031 outlook is not demand—it is supply. After apartment completions reached an estimated 525,000–585,000 units in 2025 (following a roughly 50-year high of approximately 590,000 in 2024), deliveries are forecast to fall sharply to roughly 350,000–440,000 units in 2026, according to analysis by eFinancialModels Research based on RealPage, Yardi Matrix, and U.S. Census data USA Multifamily & BTR Market Study 2026–2031.

That collapse in new supply is not a market correction—it is the mechanical result of a construction financing drought that began in 2023. Multifamily units under construction fell from a peak above one million in late 2023 to about 690,000, and that thin pipeline converts directly into the 2026–2027 delivery trough. The United States forms roughly 1.41 million new households each year against housing completions of about 1.36 million U.S. Census Bureau, perpetuating a structural deficit that keeps the demand floor intact even as the cyclical picture softens.
Here is the mechanism that matters for investors: net absorption—units actually leased—has remained healthy throughout the 2024–2025 soft patch, confirming that rent weakness was a supply phenomenon, not a demand failure. As deliveries collapse in 2026 while absorption holds, the two lines cross. The USA Multifamily & BTR Market Study 2026–2031 projects that absorption sustainably overtakes deliveries from the second half of 2026 nationally, and as late as 2027 in the most oversupplied Sun Belt metros.

Net absorption overtakes deliveries from H2 2026 nationally—the crossover that triggers falling vacancy and recovering rent growth.
Apartment Completions: A Year-by-Year Breakdown
Understanding the delivery schedule is the starting point for any 2026–2031 underwriting. The table below summarizes the supply trajectory from the study’s base case.
| Year | Completions (000s) | Phase | Key Note |
|---|---|---|---|
| 2024 | ~590 | Supply peak | ~50-year high; Sun Belt led |
| 2025 | ~525–585 | Elevated | Vacancy ~8.2% |
| 2026 | ~350–440 | Supply cliff | Lowest since ~2014 |
| 2027 | ~330–360 | Trough | Thin starts pipeline |
| 2028–2029 | ~360–405 | Gradual recovery | Contingent on 2026–27 starts |
| 2030–2031 | ~430–455 | Below-peak normal | Structurally under 2024 high |
Source: eFinancialModels Research based on RealPage, Yardi Matrix, and U.S. Census Bureau. 2026–2031 figures are base case projections USA Multifamily & BTR Market Study 2026–2031.
For asset-level modeling, the national delivery number is less important than the three-year forward pipeline within a two-to-three-mile radius of the subject property. A 2026 acquisition in a heavily supplied Sun Belt submarket must underwrite continued concessions through 2027; a coastal-gateway or Midwest asset faces little new competing supply and can underwrite tightening sooner.
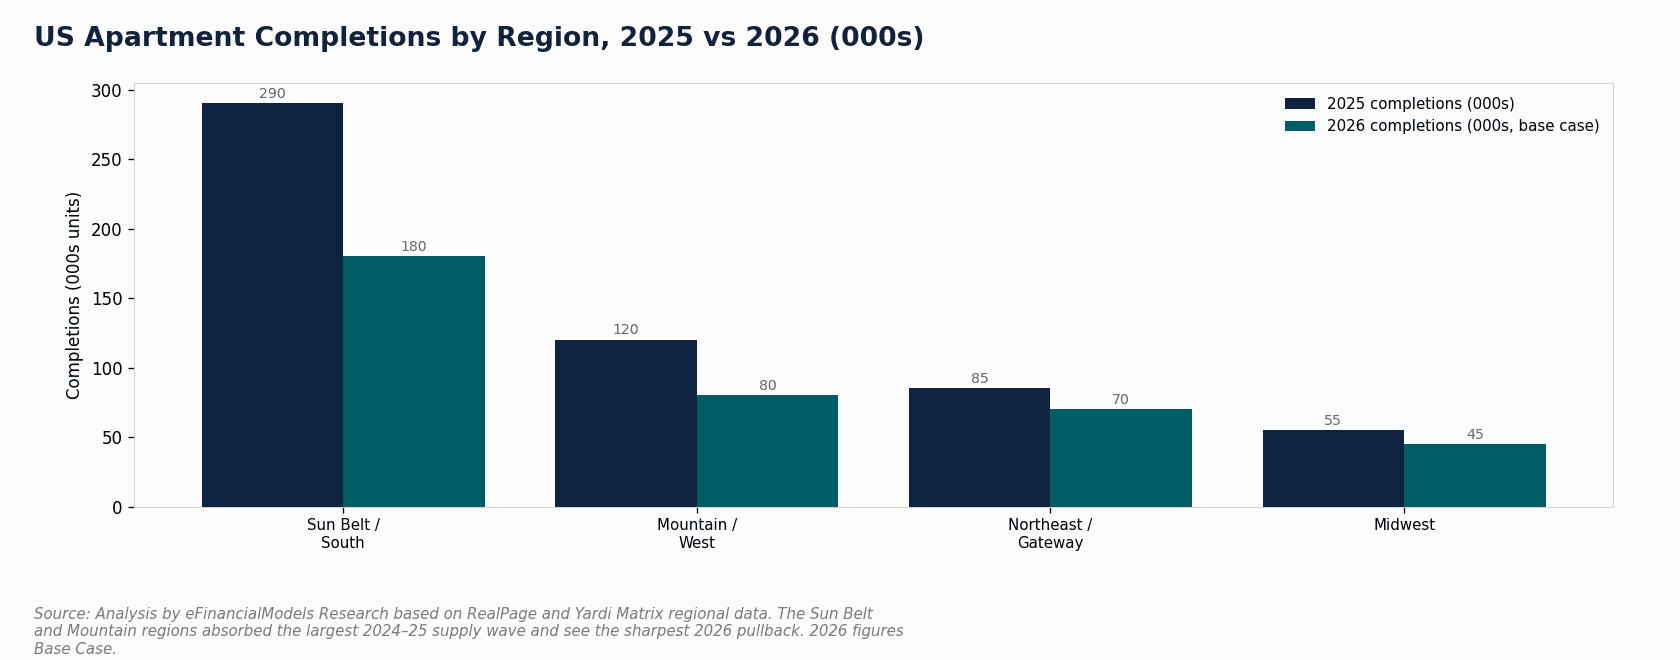
Regional divergence is the key modeling input: coastal gateways and Midwest markets tighten first; Sun Belt metros lag until 2027.
Build-to-Rent: A Distinct Asset Class, Not a Variant
Build-to-rent (BTR) refers to purpose-built single-family homes, cottages, or townhomes designed and operated as rentals at institutional scale—distinct from conventional multifamily apartments in demand profile, operating economics, and exit market. BTR is the fastest-growing segment within US rental housing and should be modeled as a separate sub-asset, not as a garden-apartment variant.
Single-family build-to-rent starts dipped to about 68,000 in 2025, down 19% from 84,000 in 2024, as financing tightened. But more than 64,000 homes remain under construction with deliveries extending into late 2027, and roughly 139,000 units sit in planning and pre-development, according to the National Apartment Association’s Build-to-Rent Q1 2026 report National Apartment Association. Occupancy held near 95%, and BTR commands a rent premium of roughly US$400–500 per month over comparable conventional apartments.
The demand case for BTR is the inverse of for-sale affordability. With mortgage rates elevated and home prices high, older millennials seeking space and good school districts cannot afford to buy—so they rent BTR product instead. That “renting by necessity” dynamic lengthens tenant tenure and supports occupancy in a way that conventional multifamily cannot fully replicate.
Institutional capital deployment into BTR rose from about US$14.8 billion in 2024 to roughly US$25.4 billion in 2025, growing at approximately 27–28% per year USA Multifamily & BTR Market Study 2026–2031. The operator landscape is consolidating: Pretium/Progress Residential leads with over 90,000 single-family units, followed by Invitation Homes (approximately 85,000 homes plus a third-party management platform) and AMH (about 60,000 homes with an in-house BTR development arm). Blackstone’s 2024 acquisition of Tricon Residential added further scale and bidding pressure.
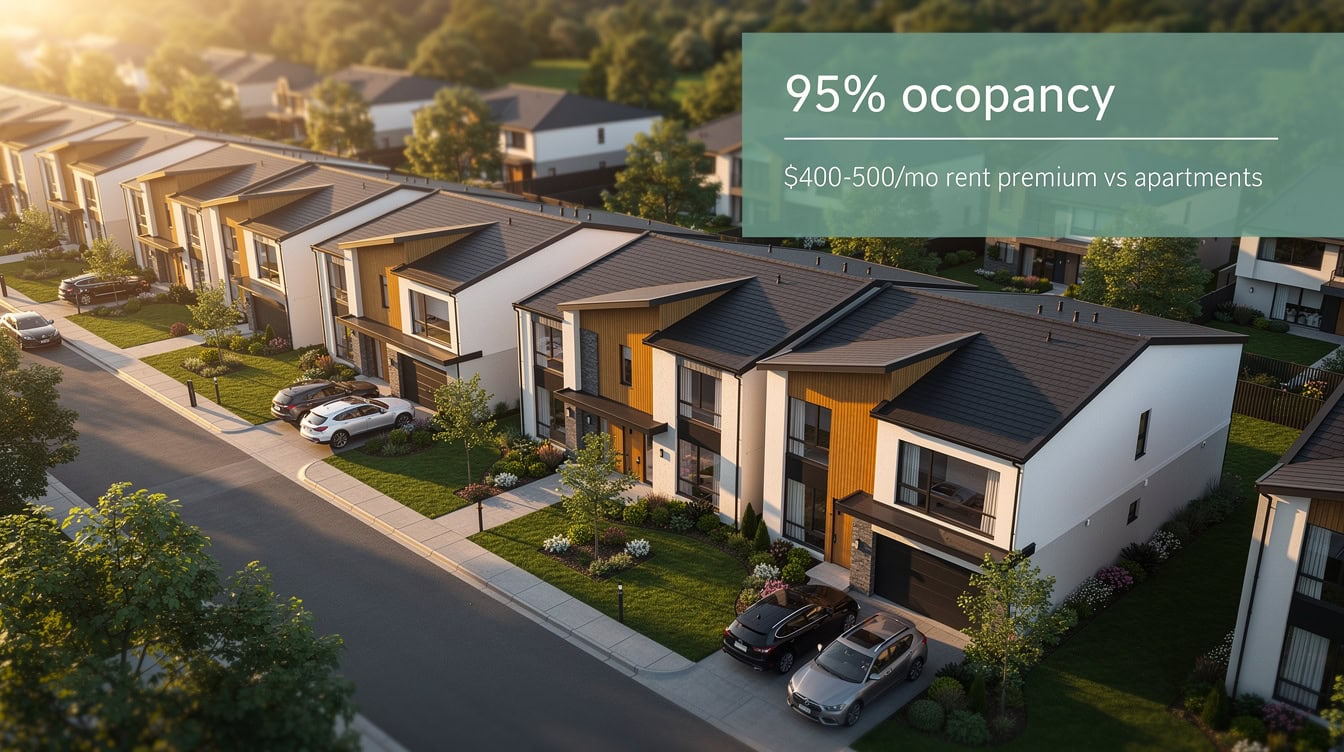
BTR occupancy held near 95% through the 2025 financing slowdown, supported by demand from older millennials priced out of homeownership.
The Debt-Maturity Wall: Risk and Opportunity in One Number
The debt-maturity wall is the defining capital-markets feature of the 2026–2031 period. Multifamily loan maturities jump roughly 56% to about US$162 billion in 2026 and stay near US$168 billion in 2027, part of a commercial real estate maturity wall exceeding US$1.5 trillion, according to analysis by eFinancialModels Research based on MBA and MSCI data USA Multifamily & BTR Market Study 2026–2031.
A large share of this debt was originated at 3%–4% in the mid-2010s and now faces refinancing at materially higher rates. Floating-rate and bridge-financed value-add deals from 2021–2022 are the most exposed: a meaningful minority of properties may not refinance at sustainable terms without fresh equity injection.
The FHFA raised Fannie Mae and Freddie Mac 2026 multifamily loan-purchase caps to US$88 billion each—US$176 billion combined, up from US$146 billion in 2025—to provide liquidity into the maturity wall and a recovering transaction market FHFA. For modelers, the practical implication is to stress debt-service-coverage ratio (DSCR) and loan-to-value (LTV) at refinancing and exit, not only at acquisition. Agency debt is the base-case source for stabilized assets; bridge and bank debt should be priced at a premium for value-add and transitional deals.
The clearest opportunity of the period is the inverse of the clearest risk: well-located assets bought from over-levered, maturity-wall-stressed sellers at a reset basis, held into the supply-cliff recovery, offer the period’s most asymmetric returns.
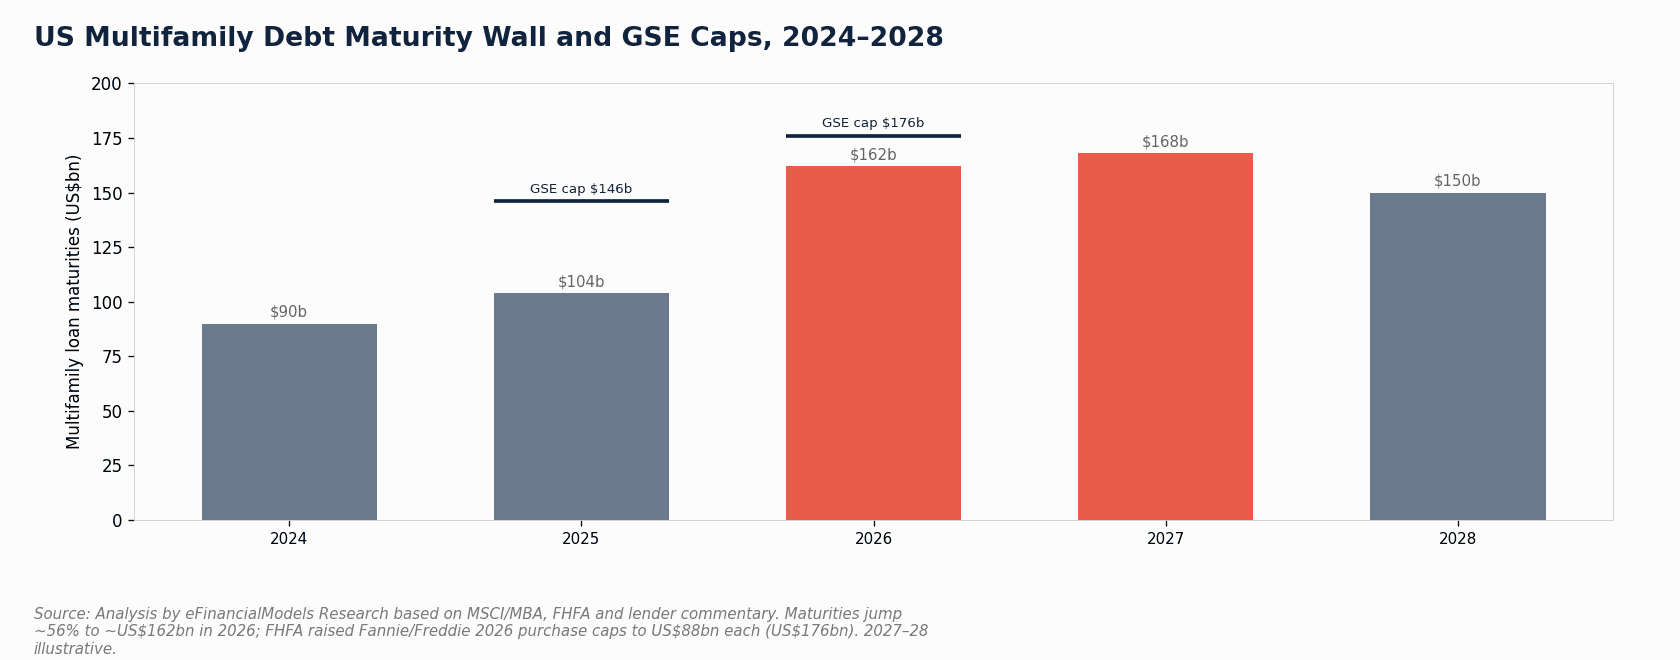
Multifamily loan maturities peak at ~$162bn in 2026—a 56% jump—but the FHFA’s $176bn combined GSE cap provides a critical liquidity backstop.
Three Scenarios to 2031: A Worked Numerical Example
The study’s scenario framework gives modelers three probability-weighted paths. Here is the math for a stabilized US apartment asset at approximately 65% LTV, using the study’s base-case pricing model assumptions.
Base Case inputs (50% probability):
- Entry cap rate: 5.5%
- Effective rent growth: ~0.7% in 2026, rising to ~2.2% per year by 2028
- Exit cap rate: entry + 0 to 25 basis points (no compression assumed)
- 10-year Treasury: ~3.8–4.1%
- Leverage: ~60–65% LTV, agency debt
- Equity hurdle (illustrative): ~12%
Here’s the math for a simplified 5-year levered IRR estimate:
Assume a property purchased at a 5.5% cap rate on Year-1 NOI of US$1,100,000:
- Purchase price = US$1,100,000 / 0.055 = US$20,000,000
- Equity invested at 65% LTV = US$20,000,000 × 0.35 = US$7,000,000
- NOI grows at 1.8% CAGR over 5 years: Year-5 NOI = US$1,100,000 × (1.018)^5 = ~US$1,203,000
- Exit at entry cap rate (5.5%): Exit value = US$1,203,000 / 0.055 = ~US$21,873,000
- Debt outstanding at exit (simplified, interest-only): US$13,000,000
- Equity proceeds at exit = US$21,873,000 − US$13,000,000 = ~US$8,873,000
- Plus 5 years of net cash distributions (simplified): ~US$1,500,000 cumulative
- Total equity return = US$8,873,000 + US$1,500,000 = ~US$10,373,000 on US$7,000,000 invested
- Approximate 5-year levered IRR: ~14% (consistent with the study’s base-case illustration)
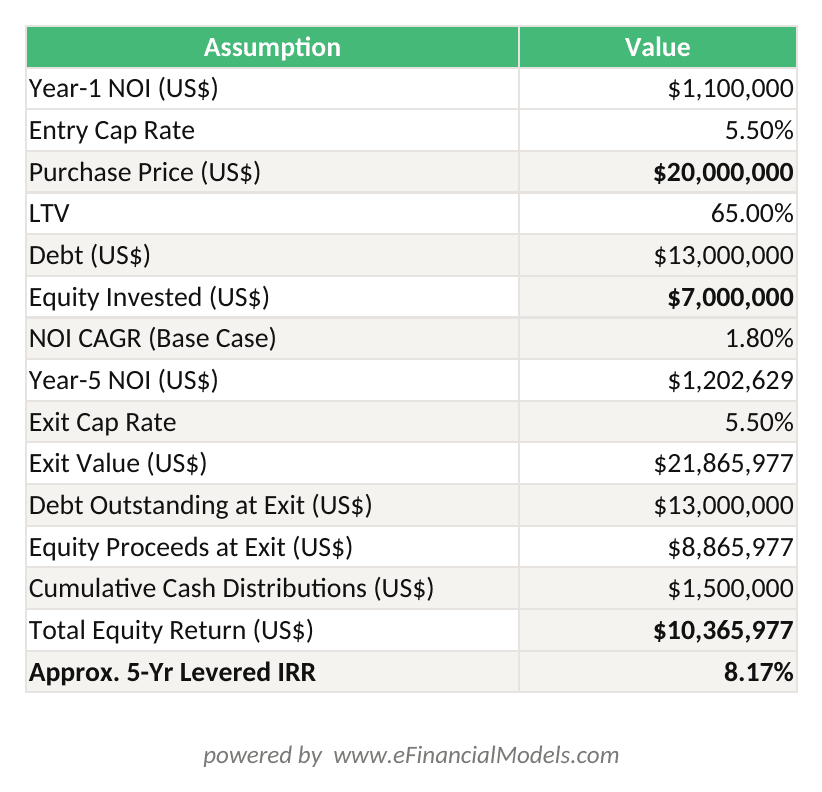
Base case: ~14% levered IRR on a stabilized US apartment asset at 65% LTV, 5.5% entry cap rate, 1.8% NOI CAGR. Inputs match the study’s Appendix A pricing model assumptions.
The scenario sensitivity table below shows how outcomes diverge across the three cases.
| Variable | Bear (25%) | Base (50%) | Bull (25%) |
|---|---|---|---|
| Rent growth CAGR | 0.5% | 1.8% | 3.0% |
| Vacancy 2031 | 9.0% | 7.5% | 6.3% |
| Cap rate 2031 | ~5.8% | ~5.2% | ~4.8% |
| 5-yr levered IRR | ~6% | ~14% | ~22% |
| Maturity-wall resolution | Disorderly | Orderly/painful | Benign |
| Rate path | Higher-for-longer | Gradual easing | Material decline |
Source: eFinancialModels Research USA Multifamily & BTR Market Study 2026–2031. IRR figures are illustrative for a stabilized US apartment asset at ~65% LTV.
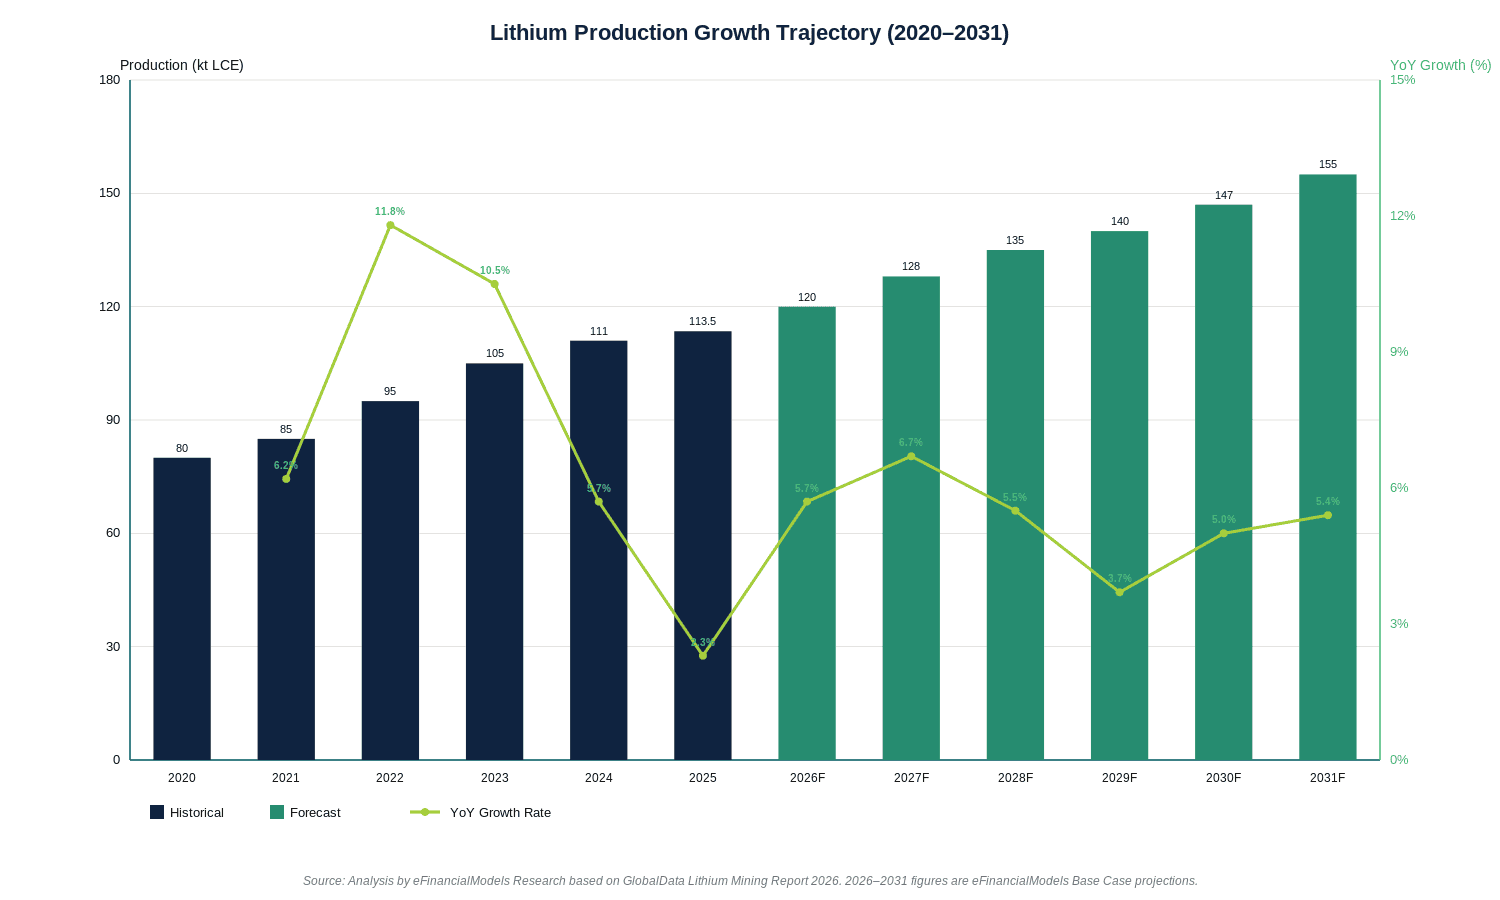
The spread between bear (~6% IRR) and bull (~22% IRR) scenarios is driven primarily by the debt-maturity wall resolution and the rate path—not by demand.
Competitive Landscape: Who Sets the Pace
No single entity dominates a market of this scale, but the largest operators set the pace of new supply through their cost of capital and development capability. The announced 2026 merger of AvalonBay (approximately 97,000 homes) and Equity Residential (approximately 86,000 units) creates one of the nation’s largest apartment owners with a combined portfolio exceeding 180,000 apartments, reshaping the coastal and gateway competitive map CoStar.
| Operator | Segment | Approx. Units | Strategic Position |
|---|---|---|---|
| MAA | Multifamily REIT | ~100,000 | Largest owner; Sun Belt-weighted |
| AvalonBay | Multifamily REIT | ~97,000 | Coastal/gateway; merging with EQR |
| Equity Residential | Multifamily REIT | ~86,000 | Coastal/gateway; merging with AVB |
| Morgan Properties | Private owner | ~94,000 | Largest private; value-add |
| Greystar | Owner/manager | 900,000+ managed | Dominant third-party manager |
| Pretium/Progress | SFR/BTR | ~92,000 | Largest SFR operator |
| Invitation Homes | SFR/BTR REIT | ~85,000 | Owned + third-party mgmt |
| AMH | SFR/BTR REIT | ~60,000 | SFR + in-house BTR development |
Source: eFinancialModels Research based on NMHC Top-50, company filings (Q3–Q4 2025), NAREIT, and CoStar NMHC.
For investors, the value gap between average and best-in-class operation is closable but execution-dependent. The operators that entered this period with conservative leverage and laddered maturities are positioned to acquire from the distressed; those that underwrote 2021–2022 deals on aggressive, low-rate assumptions are the supply of that distress.
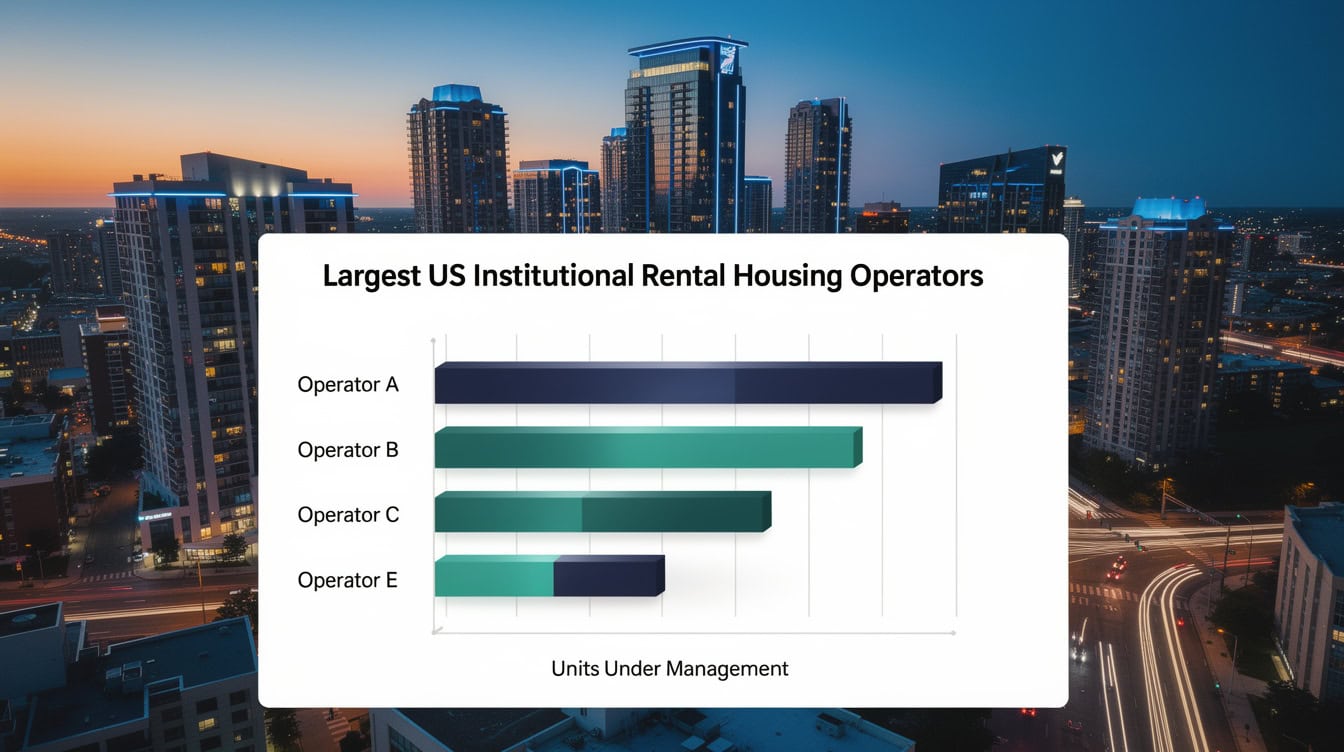
The AvalonBay-Equity Residential merger creates a 180,000+ unit coastal gateway giant—the defining competitive event of the 2026 period.
Regulatory and Policy Risks Every Modeler Must Price In
Policy and regulation now shape the operating model as much as the macro cycle. Modelers should treat the regulatory regime as a state-specific input rather than a national constant.
The November 2025 DOJ settlement with RealPage restricts the use of competitors’ nonpublic data in algorithmic rent-setting U.S. Department of Justice, forcing a rethink of revenue-management practice across the industry. Modelers should lower rent-optimization assumptions and shift toward own-data pricing strategies.
Statewide rent control now covers Oregon, Washington (HB 1217, capping increases at the lesser of 7% plus CPI or 10%), California, and Washington, DC, with active campaigns elsewhere Stoel Rives. The 2025 One Big Beautiful Bill expanded the Low-Income Housing Tax Credit (LIHTC) and eased bond-financing tests from 2026, improving affordable-housing economics. Federal scrutiny of large institutional single-family ownership is a live risk for BTR/SFR sponsors.
For commercial real estate financial modeling, apply state-specific rent-growth ceilings where rent control applies and model operating expenses above CPI for insurance and property taxes—two cost lines that have consistently outpaced rent growth in recent years.
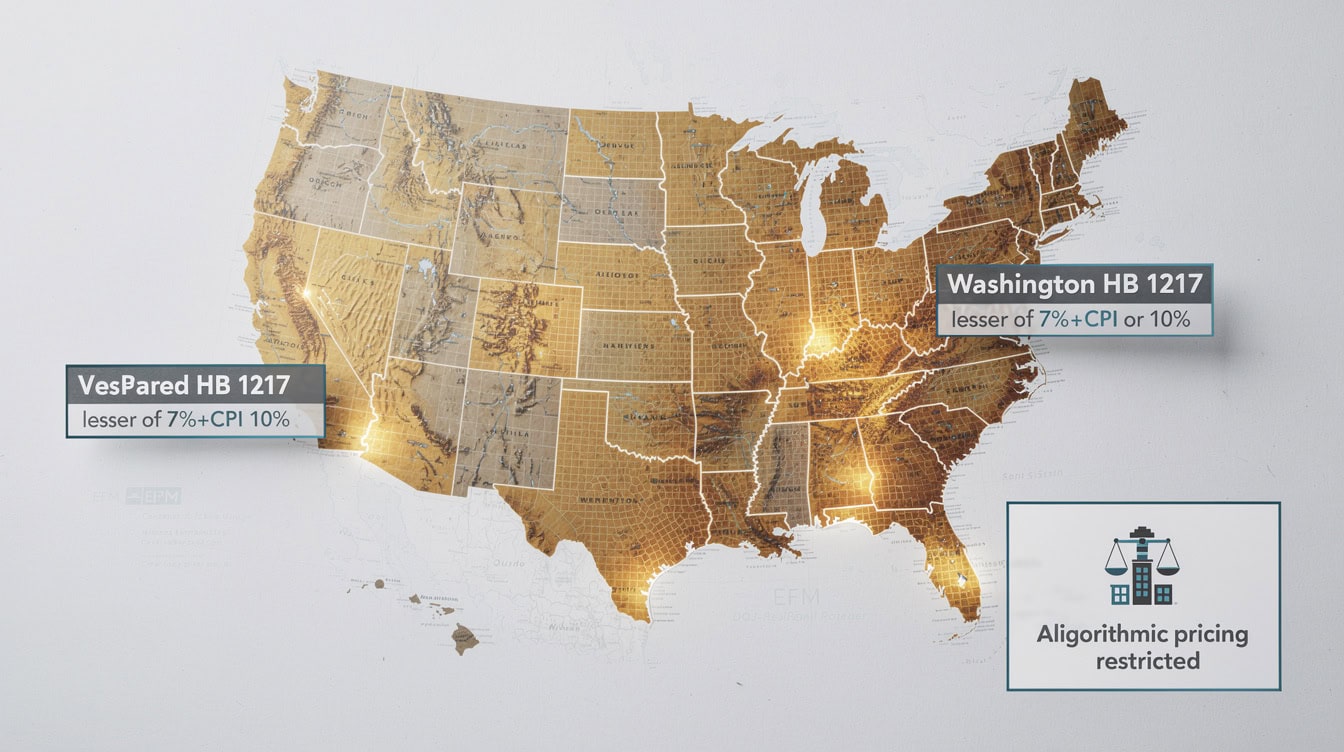
Rent control now covers 4 jurisdictions with active campaigns elsewhere—model it as a state-specific input, not a national constant.
Common Modeling Mistakes and How to Fix Them
Modelers working on US multifamily and BTR deals consistently make five errors that distort returns.
Mistake 1: Using a flat rent-growth assumption. The market is not flat—it moves from near zero in 2025 to roughly 2.2% per year by 2028. Apply a rising, region-differentiated curve and gate the inflection timing on the metro-level pipeline, not the national average.
Mistake 2: Assuming cap-rate compression as a return driver. The study explicitly recommends modeling exit cap rates at or modestly above entry. Compression is a bull-case assumption, not a base-case input.
Mistake 3: Stress-testing demand and supply independently. The top risks are correlated: higher-for-longer rates simultaneously worsen the maturity wall, freeze transactions, and raise exit caps. Stress-test them together as a single adverse macro state.
Mistake 4: Treating BTR as a garden-apartment variant. BTR has a distinct yield profile, operating complexity (scattered-site logistics), a less liquid exit market, and separate regulatory risks. Model it as its own sub-asset with its own assumptions.
Mistake 5: Testing debt metrics only at acquisition. Test DSCR and LTV at refinancing and exit, not just at closing. Many 2021–2022 value-add deals that penciled at acquisition are now failing at refinancing.
You can pair the study’s findings with a purpose-built real estate financial model template to run property-level DCF, levered IRR, and debt-sizing calculations with the correct regional and scenario inputs.
Frequently Asked Questions
What is the absorption inflection, and why does it matter so much?
Absorption (net change in occupied units over a period) has stayed healthy even during the 2024–2025 soft patch, proving that rent weakness was a supply problem, not a demand failure. The absorption inflection is the point where net absorption sustainably overtakes new deliveries—projected for the second half of 2026 nationally. That crossover is the mechanical trigger for falling vacancy and recovering rent growth. For a 2026 acquisition, the inflection date determines when concessions burn off and when pricing power returns, which is where most of the early-hold valuation sensitivity lives. A deal underwritten with the inflection 6 months too late can show a 14% IRR instead of 10%—or vice versa.
How does the debt-maturity wall create acquisition opportunities?
Multifamily loan maturities jump to about US$162 billion in 2026, with many loans originated at 3%–4% now facing refinancing at materially higher rates. Floating-rate and bridge-financed value-add deals from 2021–2022 are the most exposed. When a property cannot refinance at sustainable terms without fresh equity, the owner faces a forced sale. Buyers with conservative balance sheets and access to agency debt (Fannie/Freddie caps at US$176 billion combined in 2026) can acquire well-located assets at a reset basis from these forced sellers, then hold into the supply-cliff recovery. The study’s base case shows a ~14% levered IRR for a stabilized asset bought at a 5.5% cap rate and held 5 years.
What makes BTR different from conventional multifamily for modeling purposes?
BTR (build-to-rent) refers to purpose-built single-family homes operated as rentals at institutional scale. It differs from conventional multifamily in four key ways: (1) it commands a rent premium of roughly US$400–500 per month; (2) it serves a distinct demographic—older millennials who want yards and school districts but cannot afford to buy; (3) scattered-site operations are more complex and expensive than centralized apartment management; and (4) the exit market is less liquid, with fewer institutional buyers than for stabilized apartment buildings. Model BTR with its own cap rate, operating-cost structure, and exit assumptions rather than applying multifamily benchmarks.
Which US markets are best positioned for 2026–2028 acquisitions?
The study identifies two distinct opportunity sets. Coastal gateway and Midwest markets (New York, Boston, Chicago) face little new competing supply and can underwrite tightening occupancy sooner—rent growth recovery is already underway in these markets. Sun Belt markets (Dallas, Austin, Phoenix, Atlanta, Charlotte, Nashville) took the heaviest supply in 2024–2025 and will lag the recovery until 2027, but assets bought through the tail of oversupply at a discount are positioned to capture the full rent recovery as the cliff tightens the market. The single most important input for any deal is the three-year forward pipeline within a two-to-three-mile radius of the subject property.
How should I model the RealPage DOJ settlement in my rent assumptions?
The November 2025 DOJ settlement requires RealPage to end the sharing of competitors’ nonpublic data in algorithmic rent-setting. In practice, this removes a source of above-market rent optimization that many operators had built into their revenue-management systems. For modeling, lower your rent-optimization uplift assumption—the study recommends shifting to own-data pricing strategies and reducing the premium you attribute to algorithmic pricing. In rent-controlled markets (Oregon, Washington, California, DC), apply the statutory ceiling as a hard cap on annual increases: Washington’s HB 1217 caps increases at the lesser of 7% plus CPI or 10%.
What are the FHFA’s 2026 GSE caps and why do they matter?
The Federal Housing Finance Agency (FHFA) sets annual limits on how much Fannie Mae and Freddie Mac can purchase in multifamily loans. For 2026, the FHFA raised these caps to US$88 billion each—US$176 billion combined, up from US$146 billion in 2025—specifically to provide liquidity into the maturity wall and a recovering transaction market. For modelers, agency debt is the base-case financing source for stabilized assets because it offers the most competitive rates and terms. Bridge and bank debt should be priced at a premium for value-add and transitional deals. Stress-test your model against a scenario where agency execution is unavailable or delayed.
What is LIHTC and how does the 2025 legislation change the math?
LIHTC stands for Low-Income Housing Tax Credit, the principal US affordable-housing finance program. Developers use LIHTC allocations to attract equity investors who receive federal tax credits in exchange for funding affordable units. The 2025 One Big Beautiful Bill expanded the LIHTC program and eased bond-financing tests from 2026, making it easier to finance affordable housing projects with tax-exempt bonds. For modelers working on mixed-income or affordable-adjacent projects, the expanded LIHTC improves the equity stack and can lower the required market-rate subsidy. It also increases the supply of affordable units, which is a modest competitive factor for market-rate properties in the same submarkets.
Conclusion
The US multifamily and BTR market enters 2026 at a genuine inflection point. The supply cliff is real, the demand floor is durable, and the debt-maturity wall creates both the period’s largest risk and its clearest acquisition opportunity. Rent growth recovers from near zero to roughly 2.2% per year by 2028 in the base case, vacancy eases from 8.2% to 7.5% by 2030, and the investors who buy well-located assets from forced sellers in 2026–2028 are positioned for asymmetric returns.
I recommend downloading the USA Multifamily & BTR Market Study 2026–2031 for the full scenario analysis, regional breakdowns, and pricing model assumptions—then pairing it with the Real Estate Financial Model Bundle to run your own property-level DCF, levered IRR, and debt-sizing calculations with the correct regional and scenario inputs built in from day one.

























































