
0 ITEMS

DTC E-Commerce Financial Model: Build It Right
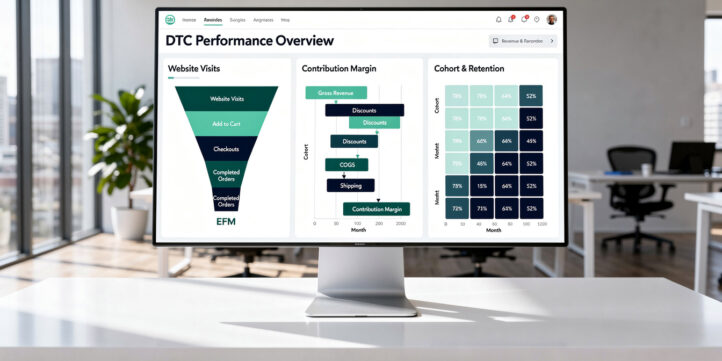
Key Takeaways
- U.S. retail e-commerce hit $1.192 trillion in 2024, giving DTC brands a massive but competitive TAM that demands rigorous financial modeling to capture share profitably.
- The revenue model chain has 5 stages: Sessions → Conversion Rate → Orders → AOV → Net Revenue. Every projection starts here.
- Contribution margin has 3 levels: CM1 (gross margin after COGS), CM2 (after fulfillment and shipping), CM3 (after CAC). Profitable DTC brands target CM3 above 20%.
- CAC payback period, not CAC alone, determines whether a channel is fundable. A $60 CAC with a 3-month payback beats a $40 CAC with a 12-month payback every time.
- Cohort-based LTV modeling separates consumable DTC (high repurchase, lower AOV) from durable DTC (low repurchase, higher AOV) and produces materially different cash flow profiles.
- Working capital requirements for DTC brands are front-loaded: inventory must be purchased 60-90 days before revenue lands, creating a structural cash gap that grows with revenue.
- Scenario planning must stress-test at least 3 variables simultaneously: CAC inflation, conversion rate degradation, and gross margin compression from discounting.
DTC E-Commerce Financial Model: Structural Overview and Key Assumptions
A DTC (direct-to-consumer) e-commerce financial model is an integrated projection system that connects traffic acquisition, unit economics, customer retention, and working capital into a single three-statement output. Unlike a generic P&L, a DTC model must capture the non-linear relationship between marketing spend, customer cohorts, and cumulative revenue.
The model architecture has four layers:
- Revenue engine: traffic, conversion, AOV (average order value), and returns
- Unit economics: COGS, fulfillment, CAC, and contribution margin waterfall
- Retention engine: cohort LTV, repurchase curves, and subscription mechanics
- Financial statements: P&L, balance sheet, and cash flow statement
U.S. retail e-commerce sales reached $1.192 trillion in 2024, up 8.1% year-over-year (U.S. Census Bureau), and e-commerce represented 16.1% of total U.S. retail sales in Q4 2024 (U.S. Census Bureau). Global e-commerce sales reached approximately $6.3 trillion in 2024 (Statista), with worldwide retail e-commerce projected to exceed $6.8T by 2028 (Forrester). These figures frame your TAM (total addressable market) assumptions in scenario planning, but they also signal the competitive intensity that makes unit economics the real battleground.
Key model assumptions to set before building:
- Base conversion rate: 2.5% to 3.0% for most categories (Littledata benchmark)
- Gross margin target by category: 55-70% for beauty, 45-60% for apparel, 30-50% for food and beverage
- CAC payback period target: under 6 months for subscription, under 12 months for one-time purchase
- Inventory days on hand: 45-90 days depending on SKU count and supplier lead times

The revenue chain: every DTC projection starts with sessions and ends with net revenue after returns. Model each stage separately.
Revenue Formula for DTC E-Commerce
The revenue model for a DTC e-commerce business flows through a five-step funnel. Every number in your P&L ultimately traces back to this chain. Build your forecast from the top down and validate each conversion rate against industry benchmarks.
Revenue Formula
Key Inputs
Sessions
Total website visits from all channels, including paid media, organic search, email, affiliate traffic, and direct visits.
CVR (Conversion Rate)
The percentage of sessions that result in a purchase. Average e-commerce conversion rates typically range from 2.5% to 3.0% across industries.
AOV (Average Order Value)
The average gross revenue generated per order before returns.
Returns Rate
The percentage of orders refunded or returned. This varies significantly by category:
- Apparel: 20%–30%
- Beauty & Consumables: 5%–10%
Worked Example
Assume a DTC skincare brand in Month 6 with the following metrics:
- Sessions: 80,000
- CVR: 2.8%
- AOV: $65
- Returns Rate: 7%
Step 1: Orders
80,000 × 2.8% = 2,240 orders
Step 2: Gross Revenue
2,240 × $65 = $145,600
Step 3: Net Revenue
$145,600 × (1 − 7%) = $135,408
Net Revenue = $135,408
Here’s the math:
- Gross Orders = 80,000 × 2.8% = 2,240 orders
- Gross Revenue = 2,240 × $65 = $145,600
- Net Revenue = $145,600 × (1 – 7%) = $135,408
Model sessions by channel separately (paid social, paid search, organic, email, referral) so you can apply channel-specific CVRs and tie marketing spend directly to incremental sessions. This structure also lets you model the revenue impact of CVR optimization without changing your traffic assumptions.
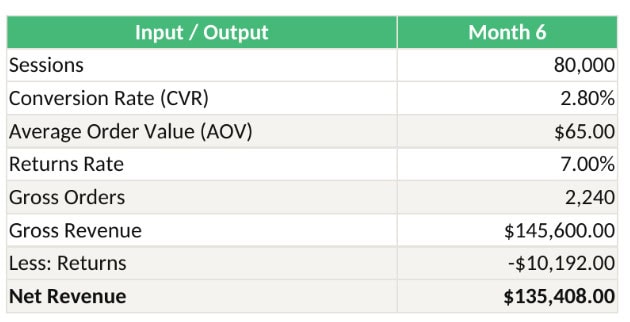
Net Revenue = Sessions × CVR × AOV × (1 − Returns Rate). For 80,000 sessions at 2.8% CVR, $65 AOV, and 7% returns, net revenue = $135,408.
Revenue model inputs to track monthly:
| Input | Consumable DTC | Durable DTC |
|---|---|---|
| AOV | $40-$80 | $120-$400 |
| CVR | 2.5-3.5% | 1.5-2.5% |
| Returns Rate | 5-10% | 15-25% |
| Repeat Purchase Rate (12-month) | 40-60% | 10-20% |
| Subscription Attach Rate | 20-40% | 2-8% |
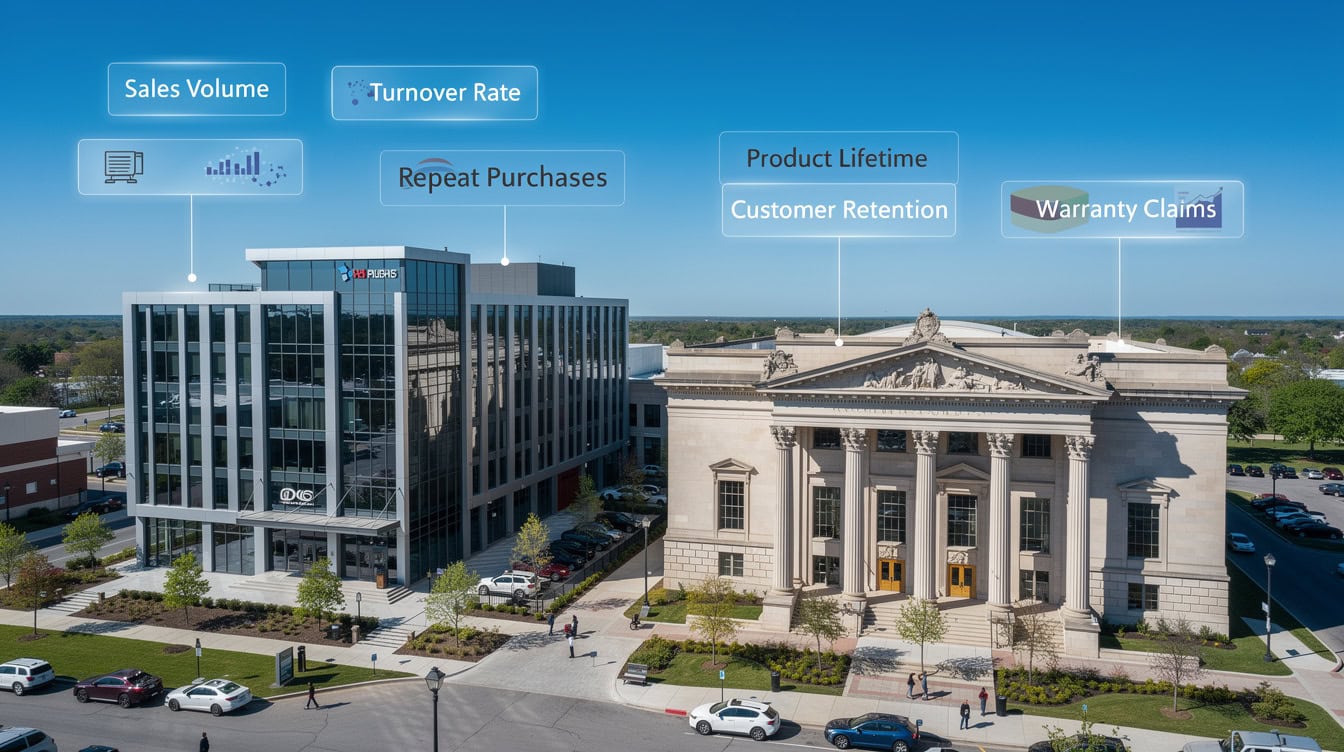
Consumable vs durable DTC: the product type determines retention curve shape, LTV calculation method, and working capital intensity.
Modeling Customer Acquisition Cost (CAC) by Channel
CAC (customer acquisition cost) is the total marketing spend divided by the number of new customers acquired in a period. Blended CAC hides channel efficiency, so model it by channel first, then blend.
CAC Formula:
CAC (Channel) = Channel Ad Spend ÷ New Customers Acquired via Channel
CAC Payback Period Formula:
CAC Payback (Months) = CAC ÷ (AOV × Gross Margin % ÷ 12)
For a brand with $60 CAC, $65 AOV, and 58% gross margin:
- Monthly gross profit per customer = ($65 × 58%) ÷ 12 = $3.14
- CAC Payback = $60 ÷ $3.14 = 19.1 months
That payback period is too long for a one-time purchase model. It becomes acceptable only if the 12-month repurchase rate exceeds 40%, which shifts the denominator to cumulative gross profit across the cohort.
Typical DTC CAC benchmarks by channel (2024 estimates based on industry practitioner data):
| Channel | CAC Range | Notes |
|---|---|---|
| Facebook/Instagram (Meta) | $25-$80 | Higher for cold audiences; lower with strong creative |
| Google Shopping | $20-$60 | Intent-driven; lower for branded terms |
| TikTok Ads | $15-$50 | Lower CPMs but lower purchase intent |
| Influencer/Affiliate | $30-$90 | Highly variable by niche and commission structure |
| Email/SMS (owned) | $2-$10 | Retention channel; near-zero marginal CAC |
| Organic/SEO | $5-$20 | Amortized content investment over 12-24 months |
Model blended CAC as your channel mix shifts. Early-stage DTC brands rely heavily on paid social (60-70% of spend), which inflates blended CAC. Mature brands shift 30-40% of spend to owned channels (email, SMS, loyalty), compressing blended CAC by 20-35%.
You can explore startup financial models that include pre-built CAC and payback period calculators to accelerate this part of the build.
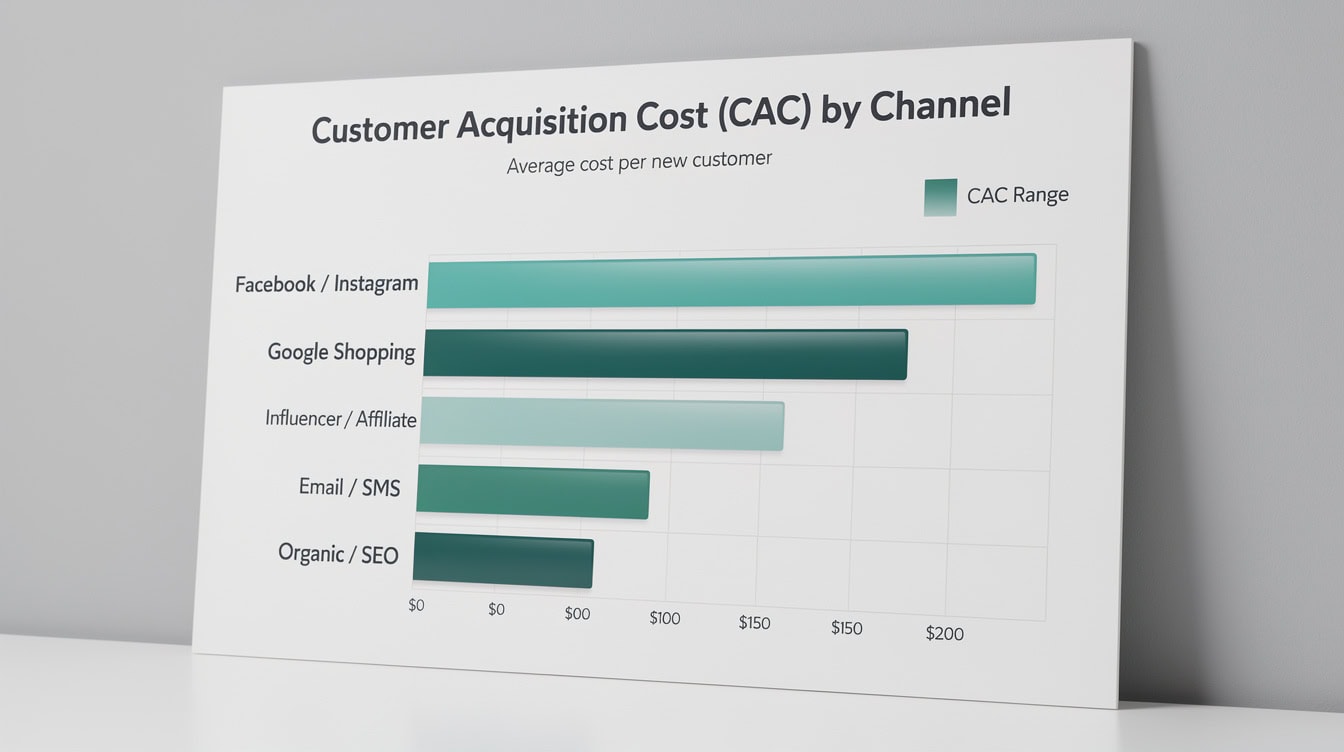
CAC varies 10x across channels. Email and organic deliver the lowest marginal CAC but require 12-24 months of investment to scale.
Unit Economics and Contribution Margin Waterfall (CM1, CM2, CM3)
Contribution margin analysis at the unit level tells you whether each incremental sale generates cash or destroys it. The waterfall has three levels, each stripping away a cost layer.
CM1: Product Margin (after COGS)
CM1 = Net Revenue − COGS
CM1 % = CM1 ÷ Net Revenue
CM2: Fulfillment Margin (after fulfillment and shipping)
CM2 = CM1 − Fulfillment Cost − Outbound Shipping − Packaging
CM2 % = CM2 ÷ Net Revenue
CM3: Marketing Margin (after CAC)
CM3 = CM2 − CAC (allocated per order)
CM3 % = CM3 ÷ Net Revenue
Worked example for a DTC supplement brand:
| Line Item | Per Order | % of Net Revenue |
|---|---|---|
| Net Revenue (AOV $70, 6% Returns) | $65.80 | 100% |
| COGS (Product + Inbound Freight) | $19.74 | 30.0% |
| CM1 | $46.06 | 70.0% |
| Fulfillment (3PL Pick & Pack) | $4.50 | 6.8% |
| Outbound Shipping | $7.20 | 10.9% |
| Packaging | $1.50 | 2.3% |
| CM2 | $32.86 | 49.9% |
| CAC (Blended, Allocated per Order) | $18.00 | 27.4% |
| CM3 | $14.86 | 22.6% |
A CM3 of 22.6% is healthy for a consumable DTC brand. Brands below 15% CM3 typically cannot fund growth without external capital. Brands below 0% CM3 are paying to acquire customers who don’t generate enough lifetime value to recover the cost.
For a deeper framework on contribution margin modeling, see EFM’s financial model templates.

The CM waterfall: a DTC brand with CM3 below 15% cannot self-fund growth. The supplement example above shows a healthy 22.6% CM3.
Cost of Goods Sold: Landed Costs, Fulfillment, and Shipping Economics
COGS in a DTC model is not just the factory price. Landed cost (the true cost to get a unit to your warehouse) includes 5-7 components that most early-stage models undercount.
Landed cost formula:
Landed Cost = Factory Price + Inbound Freight + Import Duties + Quality Inspection + Warehouse Receiving
For a product with a $12 factory price:
Inbound freight (ocean, per unit): $1.80
Import duties (10% of factory price): $1.20
Quality inspection: $0.30
Warehouse receiving: $0.20
Landed Cost: $15.50 (29% above factory price)
Variable vs semi-variable COGS structure:
| Cost Component | Variable | Semi-Variable | Fixed |
|---|---|---|---|
| Factory price | Yes | ||
| Inbound freight | Yes (per unit) | ||
| Import duties | Yes | ||
| 3PL pick/pack | Yes | ||
| Outbound shipping | Yes | ||
| Packaging materials | Yes | ||
| Warehouse rent | Yes (steps up with volume) | ||
| Quality control staff | Yes |
Model outbound shipping as a tiered variable cost. Most DTC brands subsidize shipping (offering free shipping above a threshold), which creates a non-linear cost curve. If your free shipping threshold is $50 and your AOV is $52, you’re subsidizing shipping on nearly every order. Model the shipping subsidy separately:
Shipping Subsidy per Order = Actual Shipping Cost – Amount Charged to Customer
3PL (third-party logistics) costs typically run $3.50-$6.00 per order for pick-and-pack, plus $0.50-$1.50 per additional unit in a multi-unit order. Storage fees add $0.50-$1.20 per cubic foot per month. Model these as a function of order volume and SKU count, not as a flat percentage.
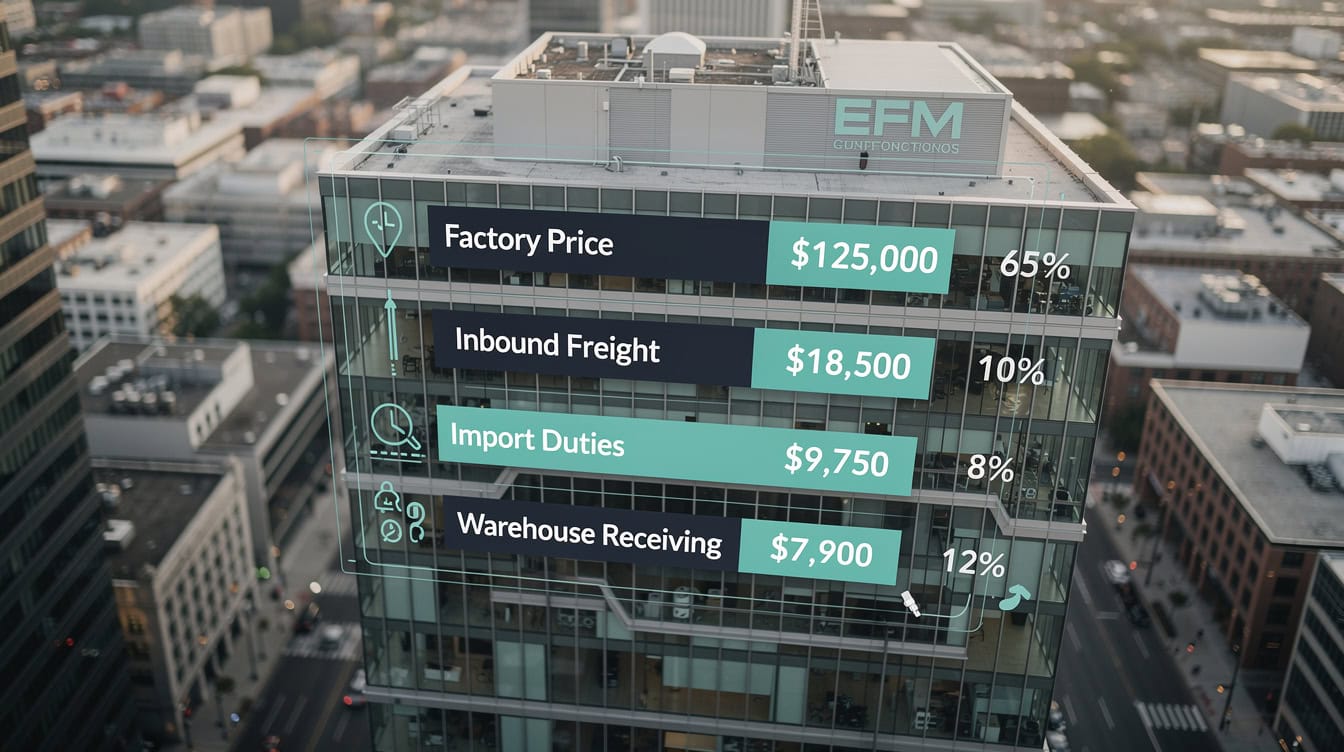
Landed cost runs 20-35% above factory price for most DTC brands. Modeling only factory price understates COGS and overstates gross margin.
Customer Lifetime Value (LTV) and Cohort-Based Retention Modeling
LTV (lifetime value) is the total gross profit a customer generates over their relationship with the brand. Cohort-based LTV modeling groups customers by acquisition month and tracks their purchasing behavior over time, producing a retention curve that feeds directly into the P&L.
LTV formula (gross profit basis):
LTV = AOV × Gross Margin % × (1 ÷ (1 – Retention Rate))
For a consumable brand with $65 AOV, 62% gross margin, and 45% 12-month retention:
LTV = $65 × 62% × (1 / (1 – 0.45))
LTV = $40.30 × 1.818
LTV = $73.27
With a $40 CAC, the LTV:CAC ratio is 1.83x. Investors typically want to see 3x or higher for a fundable DTC business. This brand needs to either reduce CAC, improve retention, or increase AOV.
Cohort retention curve assumptions by product type:
| Month | Consumable Retention | Durable Retention |
|---|---|---|
| Month 1 (first repeat) | 35-45% | 10-15% |
| Month 3 | 25-35% | 7-10% |
| Month 6 | 20-28% | 5-8% |
| Month 12 | 15-22% | 3-6% |
| Month 24 | 10-18% | 2-4% |
Build your cohort model as a matrix: rows = acquisition cohorts (Month 1, Month 2, etc.), columns = months since acquisition. Each cell = cohort size × retention rate for that period × AOV × gross margin. Sum across all active cohorts each month to get total retention revenue, then add new customer revenue on top.
Subscription models change this structure fundamentally. A subscription DTC brand with 85% monthly retention has a predictable revenue base that reduces working capital risk and supports higher CAC. Model subscription and one-time purchase customers as separate cohorts with different retention curves and AOV assumptions.
For pre-built cohort LTV models, EFM’s e-commerce financial models include cohort matrices with configurable retention assumptions.

Cohort heatmaps reveal whether retention is improving over time. Darker cells in newer cohorts signal better product-market fit or improved onboarding.
Operating Expense Structure: Platform Fees, Payment Processing, and Returns
DTC operating expenses below the contribution margin line include platform fees, payment processing, returns handling, and fixed overhead. These are often modeled as a percentage of gross revenue, but the more accurate approach is to model each as a function of its actual driver.
Platform fees:
Shopify reported $7.1 billion in revenue for 2024 (Shopify Investor Relations), which reflects the scale of merchant fees flowing through the platform. Shopify Basic charges 2.9% + $0.30 per transaction for online payments (Shopify); Shopify Advanced drops this to 2.4% + $0.30. Model the fee tier you expect to be on at each revenue stage.
Amazon Marketplace fees run 8-15% of selling price depending on category, plus $0.99 per item for individual sellers or $39.99/month for professional accounts.
Payment processing:
Stripe charges 2.9% + $0.30 per successful card charge for standard accounts (Stripe)
PayPal charges 3.49% + $0.49 for standard checkout
Model payment processing as: (Gross Revenue × Processing Rate) + ($0.30 × Number of Orders)
Returns and refunds:
Returns create a double cost: lost revenue AND COGS already incurred. Model returns as a gross revenue reduction AND a separate COGS line for returned goods that cannot be resold (typically 30-50% of returned units in apparel, 10-20% in beauty).
Returns handling cost: $3-$8 per return for 3PL processing
Full DTC P&L structure:
| Line Item | Driver |
|---|---|
| Gross Revenue | Sessions × CVR × AOV |
| Less: Returns | Gross Revenue × Returns Rate |
| Net Revenue | |
| Less: COGS (Landed) | Units Sold × Landed Cost |
| Gross Profit (CM1) | |
| Less: Fulfillment & Shipping | Orders × Per-Order Cost |
| CM2 | |
| Less: Marketing (CAC × New Customers) | New Customers × CAC |
| CM3 | |
| Less: Platform Fees | Net Revenue × Fee % |
| Less: Payment Processing | Net Revenue × Rate + (Orders × $0.30) |
| Less: G&A (Salaries, Software, etc.) | Fixed Costs + % of Revenue |
| EBITDA |

The DTC P&L has more line items than a traditional retail P&L. Platform fees and payment processing alone can consume 4-6% of net revenue.
Working Capital Requirements and Cash Flow Dynamics for DTC
DTC brands face a structural working capital challenge: inventory must be purchased and paid for 60–90 days before the revenue from selling that inventory arrives. This gap widens as the business grows.
Cash Conversion Cycle (CCC) Formula:
CCC = Days Inventory Outstanding (DIO) + Days Sales Outstanding (DSO) − Days Payable Outstanding (DPO)
For a typical DTC brand:
- DIO: 60 days (inventory sits in the warehouse before selling)
- DSO: 2 days (credit card settlements are near-instant)
- DPO: 30 days (supplier payment terms)
CCC = 60 + 2 − 30 = 32 days
A 32-day CCC means the brand needs to fund 32 days of COGS at any given time. At $500,000 monthly COGS, that’s $533,000 in working capital tied up in the cycle. As monthly COGS doubles to $1 million, the working capital requirement doubles to $1.07 million.
Inventory Financing Model:
Inventory Investment = (Monthly COGS ÷ 30) × DIO
Pre-order models reduce this requirement by collecting cash before inventory is purchased. Subscription models improve it by creating predictable demand that reduces safety stock requirements. Model these as separate scenarios in your working capital tab.
For financial projections that include working capital schedules, EFM’s templates automate the CCC calculation and flag cash shortfalls before they appear in the bank account.

The DTC cash gap: inventory is paid for 30-60 days before revenue arrives. At $1M monthly COGS, a 32-day CCC ties up $400,000 in working capital.
Scenario Analysis: Modeling Growth, CAC Inflation, and Margin Pressure
Scenario analysis in a DTC model tests how the business performs when key assumptions move against you simultaneously. A single-variable sensitivity table is not enough. Build at least 3 scenarios that stress-test correlated risks.
Three-scenario framework:
| Assumption | Bear Case | Base Case | Bull Case |
|---|---|---|---|
| Monthly Traffic Growth | 5% | 12% | 20% |
| Conversion Rate | 2.0% | 2.8% | 3.5% |
| AOV | $58 | $65 | $72 |
| Blended CAC | $75 | $55 | $40 |
| Gross Margin | 52% | 62% | 68% |
| 12-Month Retention | 30% | 42% | 55% |
| Returns Rate | 14% | 8% | 5% |
In the bear case, CAC inflation (Meta CPMs rising 20-30% year-over-year is a documented trend in digital advertising) combines with margin compression from discounting to push CM3 negative. Model this explicitly: if CM3 goes negative, the business cannot grow its way to profitability without a structural change in either channel mix or product economics.
Key scenario triggers to model:
- iOS privacy changes reducing Meta ROAS by 15-25%
- Supplier price increases of 10-15% compressing gross margin
- Free shipping threshold changes affecting AOV distribution
- Stockout scenarios: model 2-week stockout events and their impact on organic ranking and paid efficiency
For scenario analysis templates with pre-built toggle switches, EFM’s models let you flip between scenarios without rebuilding formulas.
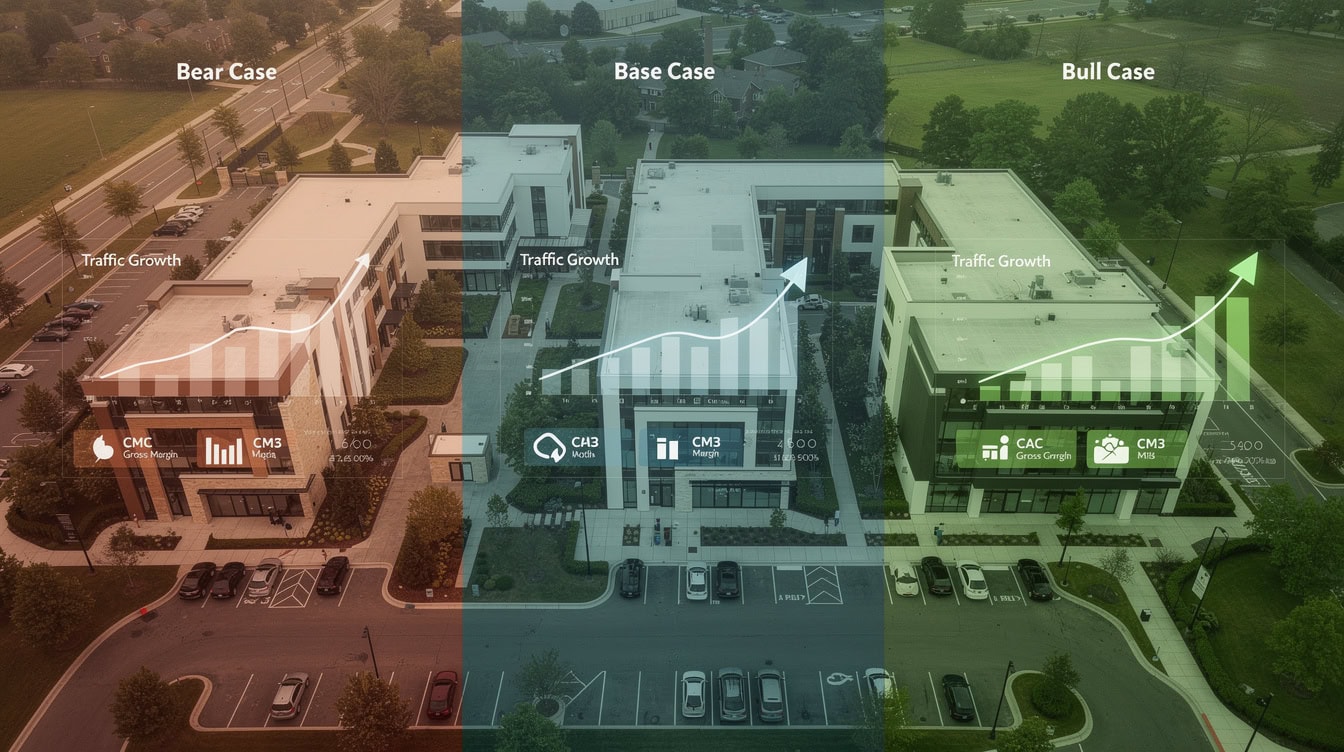
Scenario planning must stress-test correlated risks simultaneously. Bear case CAC inflation plus margin compression is the most common DTC failure mode.
Building the Integrated Three-Statement Model for DTC E-Commerce
The three-statement model (income statement, balance sheet, cash flow statement) integrates all the unit economics and operational assumptions into a coherent financial picture. In a DTC model, the key integration points are inventory on the balance sheet, accounts payable from supplier terms, and the cash flow impact of marketing spend timing.
Integration checklist:
- P&L net income flows to retained earnings on the balance sheet
- Inventory purchases (not COGS) drive cash outflows on the cash flow statement
- Accounts payable balance = monthly COGS × (DPO / 30)
- Deferred revenue (for subscriptions or pre-orders) appears as a current liability
- Capex for warehouse equipment or owned fulfillment infrastructure flows through the balance sheet and depreciates on the P&L
The three-statement model templates at EFM include DTC-specific line items and auto-populate the balance sheet from P&L and cash flow inputs.
Common integration errors in DTC models:
- Booking inventory purchases as COGS immediately: COGS should only hit the P&L when units are sold, not when purchased. Unsold inventory sits on the balance sheet as a current asset.
- Ignoring returns in the cash flow statement: Refunds are cash outflows that don’t appear in net revenue. Model them explicitly in operating cash flows.
- Missing the VAT/sales tax liability: For DTC brands selling across state lines or internationally, sales tax collected but not yet remitted is a current liability.
- Treating marketing spend as fully variable: Agency retainers, creative production, and platform minimums are semi-fixed. Model them as a base cost plus a variable component tied to spend.
- Not modeling the equity or debt needed to fund working capital: The cash flow statement will show a deficit in growth phases. The model must show where that cash comes from.
Frequently Asked Questions
What is a DTC e-commerce financial model and what does it include?
A DTC e-commerce financial model is a structured projection tool that connects traffic acquisition, unit economics, customer retention, and working capital into an integrated three-statement output (income statement, balance sheet, cash flow). It includes a revenue funnel model (sessions to net revenue), a contribution margin waterfall (CM1, CM2, CM3), a cohort-based LTV table, a working capital schedule, and scenario analysis toggles. Unlike a generic P&L, it models the non-linear relationship between marketing spend and cumulative customer revenue. A complete model typically covers 36-60 months of monthly projections and includes at least 3 scenarios.
How do I calculate CAC payback period for a DTC brand?
CAC payback period measures how many months it takes for a customer’s gross profit to recover the cost of acquiring them. The formula is: CAC Payback (months) = CAC / (Monthly Gross Profit per Customer). Monthly gross profit per customer = (AOV × Gross Margin %) / 12 for a one-time purchase model, or AOV × Gross Margin % × Monthly Purchase Frequency for a subscription model. For example, a brand with $55 CAC, $70 AOV, and 60% gross margin has a monthly gross profit of $3.50 per customer and a payback period of 15.7 months. Investors in DTC typically want payback under 12 months for one-time purchase models and under 6 months for subscription models.
What gross margin should I assume for a DTC brand?
Gross margin varies significantly by category. Beauty and personal care DTC brands typically achieve 55-70% gross margin on a landed cost basis. Apparel runs 45-60%, food and beverage runs 30-50%, and supplements run 60-72%. These ranges reflect landed cost (factory price plus inbound freight, duties, and receiving) but exclude fulfillment and shipping, which are modeled separately as CM2 deductions. Your model should build gross margin from the bottom up using actual landed cost quotes rather than applying a category average, because supplier terms, order volumes, and product complexity create wide variation within each category.
How do I model customer retention and LTV in a DTC financial model?
Build a cohort matrix where each row represents a monthly acquisition cohort and each column represents months since acquisition. Apply a retention curve to each cohort: for consumable DTC, typical 12-month retention runs 35-45% of the original cohort; for durable DTC, it runs 10-20%. Multiply cohort size × retention rate × AOV × gross margin to get gross profit per cohort per month. Sum across all active cohorts to get total retention revenue each month. LTV is the sum of all future gross profit from a cohort, discounted at your cost of capital. A simple undiscounted LTV formula is: LTV = AOV × Gross Margin % × (1 / (1 – Monthly Retention Rate)).
What working capital does a DTC brand need at $1 million monthly revenue?
At $1 million monthly net revenue with a 60% gross margin, monthly COGS is approximately $400,000. With a 60-day inventory holding period and 30-day supplier payment terms, the cash conversion cycle is approximately 32 days. Working capital tied up in inventory = ($400,000 / 30) × 60 = $800,000. Subtract the accounts payable offset: ($400,000 / 30) × 30 = $400,000. Net working capital requirement = $400,000. Add 2-3 months of operating expenses as a cash buffer, and a $1 million monthly revenue DTC brand typically needs $600,000-$900,000 in working capital. This requirement grows proportionally with revenue, which is why DTC brands often raise inventory financing or revolving credit facilities at the Series A stage.
How do platform fees affect DTC profitability and how should I model them?
Platform fees are a direct deduction from gross revenue and must be modeled as a function of transaction volume, not as a fixed cost. Shopify’s transaction fees range from 2.9% + $0.30 (Basic) to 2.4% + $0.30 (Advanced) for online card payments. Amazon Marketplace fees run 8-15% of selling price depending on category. For a brand doing $500,000 monthly gross revenue on Shopify Advanced, payment processing alone costs approximately $12,300 per month (2.4% × $500,000 + $0.30 × 7,000 orders). Add Shopify’s monthly subscription fee ($399 for Advanced) and any app fees ($200-$800/month for email, reviews, loyalty tools), and total platform costs typically run 3-5% of net revenue for a Shopify-native DTC brand.
What are the most common mistakes in DTC financial models?
The 5 most common mistakes are: (1) Modeling inventory purchases as COGS at time of purchase rather than at time of sale, which overstates early losses and understates later ones. (2) Using blended CAC without modeling channel-level efficiency, which masks deteriorating paid social performance. (3) Applying a flat retention rate instead of a declining cohort curve, which overstates LTV by 30-50% in most cases. (4) Ignoring the cash flow impact of returns: a 10% returns rate on $1 million gross revenue is $100,000 in cash refunds that don’t appear in net revenue but do appear in the bank account. (5) Not stress-testing the model with simultaneous CAC inflation and margin compression, which is the most common failure mode for DTC brands that grew rapidly on cheap paid social and then hit a wall.
Conclusion
A well-built DTC e-commerce financial model is the difference between a brand that scales profitably and one that grows into insolvency. The framework above gives you the architecture: revenue funnel, contribution margin waterfall, cohort LTV, working capital schedule, and three-statement integration. The numbers only work if the assumptions are grounded in real channel benchmarks, actual landed costs, and honest retention curves.
I recommend downloading EFM’s DTC E-Commerce Financial Model Template to start building your own projections with pre-built formulas for unit economics, cohort analysis, and three-statement integration. The template includes configurable scenario toggles, a CAC payback calculator, and a working capital schedule that auto-flags cash shortfalls before they hit your bank account.

























































