
0 ITEMS

Cash Flow Projection: A 5-Step How-To Guide

Running out of cash is the most common way an otherwise healthy business fails — and it almost always happens to owners who never saw it coming. A cash flow projection fixes that blind spot by mapping out, period by period, exactly when money will land in your bank account and when it will leave.
This guide walks through a practical 5-step method for building one: choosing your projection period and intervals, estimating inflows and outflows with realistic payment timing, calculating net and ending cash, and then keeping the forecast honest with variance analysis and rolling updates. You will also find a fully worked numerical example, guidance on the direct versus indirect method, and tips for handling seasonality, payment terms, and capital expenditures.
Key Takeaways
- 82% of business failures trace back to poor cash flow management, not lack of profit — building a projection is the single highest-leverage financial action you can take (SCORE).
- Only 52% of small businesses have a documented cash flow forecast, meaning nearly half are operating without visibility into their future cash position (Intuit QuickBooks).
- Businesses that forecast monthly are 2.5 times more likely to handle a cash crisis confidently than those that forecast less often (Intuit QuickBooks).
- The core formula is: Ending Cash = Beginning Cash + Total Inflows – Total Outflows. Apply it for each period in your projection.
- A cash flow projection is forward-looking (what will happen); a cash flow statement is historical (what did happen). Confusing the two leads to reactive, not proactive, financial management.
- Companies using rolling forecasts are 43% more likely to achieve accuracy within plus or minus 5% compared to those using only annual budgets (AFP).
- Use weekly intervals for startups and seasonal businesses, monthly for established SMBs, and quarterly for mature companies with stable cash patterns.
What Is a Cash Flow Projection and Why Does It Matter?
A cash flow projection is a forward-looking financial schedule that estimates how much cash will enter and leave your business over a defined future period. It is not the same as a profit forecast: a business can show strong profits on paper while running out of cash entirely, because revenue is recorded when earned but cash arrives when customers actually pay.
According to U.S. Bank data cited by SCORE, 82% of business failures are caused by poor cash flow management or a poor understanding of cash flow (SCORE). That number is not a warning about unprofitable businesses. Many of those failed companies were generating revenue. The problem was timing: money owed to them had not yet arrived when bills came due.
The real-world consequences are significant. 61% of small businesses regularly struggle with cash flow, and 32% are unable to pay vendors, employees, or themselves at some point due to cash flow issues (Intuit QuickBooks). A projection does not prevent those pressures from existing. It gives you enough advance notice to act before they become crises.
If you would rather start from a proven structure than a blank spreadsheet, this walkthrough on using a cash flow projection template shows how the same inputs feed a budget or business plan.
Cash Flow Projection vs. Cash Flow Statement: A Critical Distinction
A cash flow projection looks forward; a cash flow statement looks backward. Both track cash movement, but they serve opposite purposes and you should never substitute one for the other.
The cash flow statement (also called the statement of cash flows) is a historical document. It records actual cash receipts and payments that already occurred, organized into three sections: operating activities, investing activities, and financing activities. Accountants prepare it after the period closes.
The cash flow projection is a planning document. You build it before the period begins, using estimates for future sales, payment timing, and expenses. Its value is entirely in the future: it tells you whether you will have enough cash to meet obligations 30, 60, or 90 days from now.
Here is a concrete example of why the distinction matters. Suppose your business invoices $50,000 in January on 60-day payment terms. Your income statement records $50,000 in January revenue. Your cash flow projection, however, shows $0 cash arriving in January and $50,000 arriving in March. If your rent, payroll, and supplier payments total $45,000 in February, you have a cash gap of $45,000 in February despite being profitable. Only the projection reveals this gap in time to act.
How to Choose Your Projection Period and Time Intervals
Your projection period is the total time horizon you want to forecast, and your time interval is how you break that period into segments (weekly, monthly, quarterly). Choosing the right combination determines how useful your projection actually is.
Use these guidelines:
- Weekly intervals: Best for startups in their first 6 months, businesses in financial distress, or highly seasonal businesses (holiday retail, summer tourism) during peak periods. Weekly granularity catches cash gaps before they become emergencies.
- Monthly intervals: The standard for established small and medium businesses. A 12-month monthly projection gives you enough detail to manage payroll cycles, quarterly tax payments, and supplier terms without becoming unwieldy.
- Quarterly intervals: Appropriate for mature companies with stable, predictable cash flows. Use quarterly projections for 3-to-5-year strategic planning alongside monthly operational forecasts.
For most small business owners reading this, a 12-month monthly projection is the right starting point. Businesses that create cash flow forecasts at least monthly are 2.5 times more likely to be confident they can handle a cash crisis than those that forecast less often or not at all (Intuit QuickBooks).
The 5-Step Cash Flow Projection Methodology
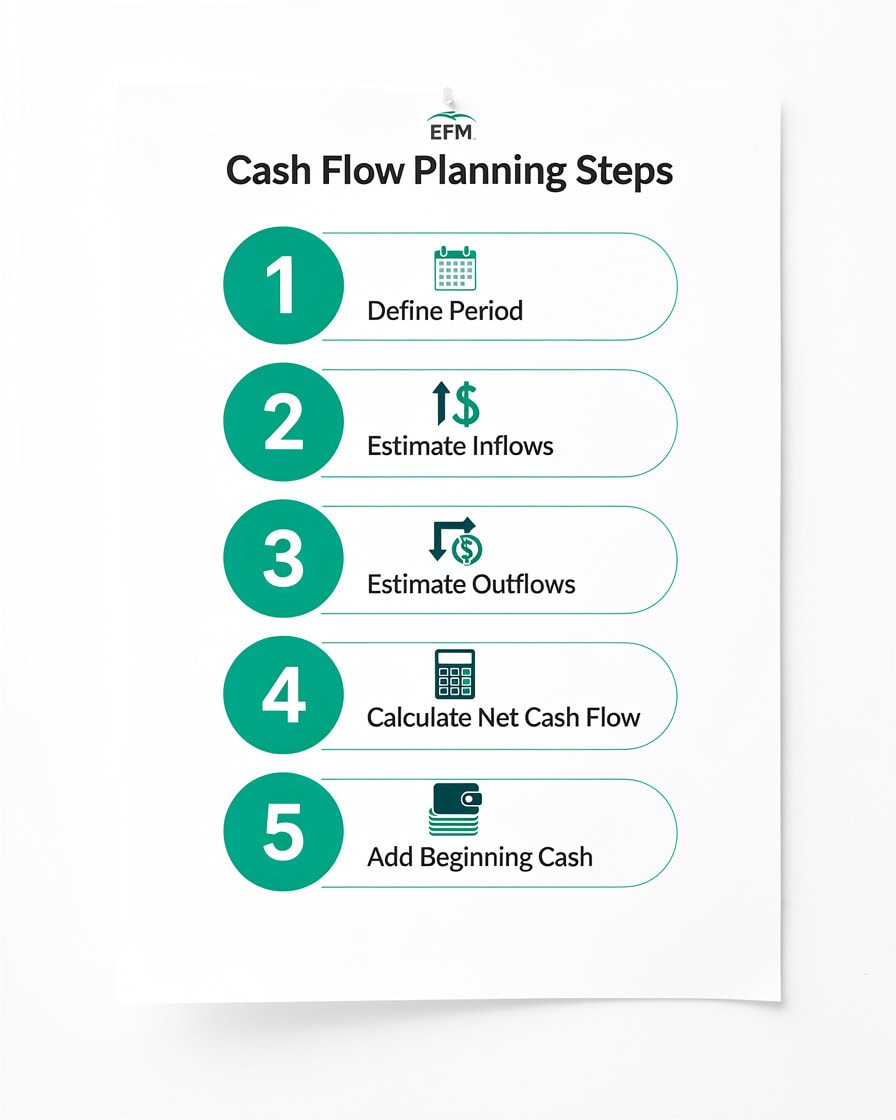
Building a cash flow projection follows a repeatable five-step process. Each step feeds the next, and skipping any one of them produces an unreliable result.

Step 1: Define Your Projection Period
Decide the total time horizon and the interval length before you enter a single number. A 12-month monthly projection means 12 columns in your spreadsheet, one per month. A 13-week weekly projection means 13 columns. Write the period start and end dates at the top of your model so every assumption you make is anchored to a specific timeframe.
Also decide whether you are projecting on a cash basis (record cash when it physically moves) or an accrual basis adjusted for timing (record revenue when earned, then adjust for when cash actually arrives). For most small businesses, the direct cash basis is simpler and more accurate for short-term projections.
Step 2: Estimate Cash Inflows with Accounts Receivable Timing
Cash inflows are all money your business actually receives during the period: customer payments, loan proceeds, asset sales, and investment income. The critical word is “receives,” not “earns.”
For businesses that invoice customers, you must account for Days Sales Outstanding (DSO), which is the average number of days it takes customers to pay after you invoice them. The formula is:
DSO = (Accounts Receivable / Total Credit Sales) x Number of Days
If your accounts receivable balance is $30,000 and your monthly credit sales are $50,000, your DSO is ($30,000 / $50,000) x 30 = 18 days. That means cash from a sale made on Day 1 of the month arrives around Day 19, not Day 1.
For a retail business with mostly cash or card sales, DSO is near zero and inflow timing is straightforward. For a B2B services firm with net-30 or net-60 terms, DSO can push cash receipts into the following month or the month after. Build this lag directly into your inflow estimates.
Other inflow sources to include: recurring subscription revenue (predictable), project milestone payments (tied to delivery dates), seasonal spikes (model these using prior-year actuals), and any planned financing draws.
Step 3: Estimate Cash Outflows Including All Payment Obligations
Cash outflows are every payment your business makes: payroll, rent, supplier invoices, loan repayments, tax installments, insurance premiums, and capital expenditures (purchases of equipment or property, abbreviated as CAPEX). List them by the date the cash actually leaves your account, not the date the expense was incurred.
Group outflows into three categories to stay organized:
- Fixed outflows: Same amount, same date every period (rent, loan payments, subscription software).
- Variable outflows: Tied to revenue or production volume (cost of goods sold, sales commissions, shipping).
- One-time outflows: Equipment purchases, lease deposits, annual insurance premiums. These are easy to forget and often cause the largest projection errors.
For inventory-based businesses, account for the timing gap between paying suppliers and receiving customer cash. If you pay suppliers on net-30 terms but collect from customers on net-60 terms, you carry a 30-day cash gap on every unit sold. Working capital (current assets minus current liabilities) measures this gap at a point in time; your projection shows how it evolves month by month.
Step 4: Calculate Net Cash Flow
Net cash flow is the difference between total inflows and total outflows for a single period. The formula is:
Net Cash Flow = Total Cash Inflows – Total Cash Outflows
A positive result means you collected more cash than you spent. A negative result means you spent more than you collected. Neither is automatically good or bad: a negative net cash flow in a month when you purchased $80,000 of equipment may be entirely planned and healthy. A negative net cash flow caused by slow customer payments and rising supplier costs is a warning signal.
Calculate net cash flow for every period in your projection, not just the total. A business can show positive cumulative cash flow over 12 months while experiencing a dangerous 3-month cash gap in months 4 through 6. The period-by-period view reveals that gap; the annual total hides it.
Step 5: Add Beginning Cash and Calculate Ending Cash
Beginning cash is the actual cash balance in your bank accounts at the start of each period. For Month 1, this is your current bank balance. For every subsequent month, beginning cash equals the ending cash from the prior month.
The ending cash formula is:
Ending Cash = Beginning Cash + Net Cash Flow
Or expanded:
Ending Cash = Beginning Cash + Total Inflows – Total Outflows
This ending cash figure is the most important number in your projection. If it turns negative in any month, you have identified a funding gap that requires action: accelerating receivables collection, delaying a capital purchase, drawing on a credit line, or raising additional capital.
Worked Numerical Example
Here is a 5-month projection for a small B2B consulting firm starting with $20,000 in cash. The firm invoices on net-30 terms, so January sales are collected in February.
Month 3 shows a net cash flow of negative $5,000, dropping ending cash to $30,000. Without the projection, this shortfall would have been invisible until the bank account ran low. With it, the owner has 60 days of advance notice to either accelerate a client payment, delay a discretionary purchase, or draw on a credit facility.
Direct vs. Indirect Method: Which Approach Fits Your Business?
The direct method and indirect method are two ways to calculate the operating section of a cash flow projection. They produce the same net operating cash flow figure but start from different inputs.
| Feature | Direct Method | Indirect Method |
|---|---|---|
| Starting point | Actual cash receipts and payments | Net income from P&L |
| Formula | Operating Receipts – Operating Disbursements | Net Income + Non-Cash Items +/- Working Capital Changes |
| Best for | Small businesses, startups, cash-basis accounting | Companies with accrual accounting and existing P&L |
| Data required | Bank statements, payment records | Income statement, balance sheet changes |
| Transparency | High: shows actual cash sources | Moderate: requires adjustments |
| Complexity | Low for simple businesses | Higher: requires reconciliation |
The direct method (operating receipts minus operating disbursements) is simpler for small businesses because it mirrors how you actually experience cash: money in, money out. You pull the numbers directly from bank statements and payment records.
The indirect method starts with net income (the bottom line of your profit and loss statement) and adjusts it for non-cash items like depreciation (a bookkeeping expense that does not involve actual cash leaving the business) and changes in working capital. This method is standard for companies that already maintain accrual-basis financial statements and want their cash flow projection to integrate with their P&L and balance sheet.
For most small business owners building their first projection, start with the direct method. You can always migrate to the indirect method as your accounting sophistication grows.
If you want your projection to tie directly into your income statement and balance sheet, see our guide to building a three-statement financial model.

Handling Complexity: Seasonality, Payment Terms, and CAPEX
Real businesses have cash flow patterns that a simple monthly average cannot capture. Three complexities trip up most first-time projections.
Seasonality: A retail business may generate 40% of its annual revenue in November and December but carry fixed costs of $15,000 per month year-round. Model this by using monthly revenue estimates based on prior-year actuals rather than dividing annual revenue by 12. The 75% of construction firms that report inaccurate cash flow forecasts caused project delays or cost overruns (KPMG) largely suffer from failing to model seasonal payment timing on multi-month projects.
Payment terms: If you offer customers net-60 terms but your suppliers require payment in net-30, you carry a permanent 30-day cash gap. Quantify this gap using DSO for receivables and Days Payable Outstanding (DPO = Accounts Payable / Cost of Goods Sold x Days) for payables. The difference between DSO and DPO tells you how many days of cash you need to fund operations.
Capital expenditures: A $50,000 equipment purchase does not appear as a $50,000 expense on your income statement (it depreciates over several years), but it does appear as a $50,000 cash outflow in the month you pay for it. Always include planned CAPEX as a lump-sum outflow in the specific month of purchase, not spread across the depreciation schedule.
Variance Analysis and Rolling Forecasts
Building a projection is step one. Using it is step two, and most businesses skip step two entirely.
Variance analysis means comparing your actual cash results each month against what you projected, then investigating the differences. The formula is:
Variance % = (Actual – Projected) / Projected x 100
A practical decision rule: if any line item varies by more than 15% from projection, investigate the cause before updating the number. A one-time variance (a customer paid late) requires a different response than a structural variance (your DSO has permanently increased from 30 days to 45 days).
Rolling forecasts extend this discipline. Instead of building one annual projection in January and ignoring it until December, a rolling 12-month forecast drops the most recent completed month and adds a new month at the far end each month. You always have 12 months of forward visibility. Companies that use rolling forecasts are 43% more likely to report forecast accuracy within plus or minus 5% compared with those using only traditional annual budgeting (AFP).
For more on keeping the numbers current as conditions change, read our guide to cash-flow forecasting for small business survival.
From Spreadsheet to Integrated Tools: When to Upgrade
Excel or Google Sheets is the right starting point for most small businesses. A well-built spreadsheet with the 5-step structure above, proper formula links between months, and a variance tracking tab handles everything a business under $5M in revenue typically needs.
You should consider upgrading to integrated planning software when any of these conditions apply: you have multiple revenue streams with different payment timing, you need real-time bank feed integration to reduce manual data entry, you manage multiple entities or currencies, or your finance team spends more than 4 hours per month maintaining the spreadsheet model.
73% of high-performing finance organizations use integrated planning tools rather than standalone spreadsheets for forecasting cash flow and other financials (PwC). That statistic reflects companies with the complexity to justify the investment. For a 10-person business, a clean Excel template with built-in formulas outperforms a $500/month SaaS tool you do not have time to configure properly.
Key features that distinguish integrated tools from spreadsheets: automatic bank reconciliation, scenario modeling with one-click switching, multi-user access with version control, and direct API connections to accounting software like QuickBooks or Xero.
Startups raising capital have an extra layer to plan for — see what investors expect from a startup financial model template.
Frequently Asked Questions
What is the difference between a cash flow projection and a budget?
A budget sets spending targets and revenue goals for a period, usually annually. A cash flow projection forecasts the timing of actual cash movements, week by week or month by month. A budget might show you plan to spend $120,000 on payroll this year. The cash flow projection shows you will pay $10,000 on the 15th and last day of every month, which means you need at least $10,000 in your account on those specific dates. You can hit your annual budget perfectly and still run out of cash in a specific month if the timing of inflows and outflows does not align. Use both tools together: the budget sets the targets, the projection manages the timing.
How accurate does a cash flow projection need to be?
Perfect accuracy is not the goal. A projection within plus or minus 10-15% on major line items is considered strong for most small businesses. The AFP found that companies using rolling forecasts are 43% more likely to achieve accuracy within plus or minus 5% (AFP), but that benchmark applies to larger organizations with more historical data. For a startup or early-stage business, the value of the projection is not precision: it is the discipline of thinking through timing, identifying potential gaps, and having a plan ready. Update your projection monthly with actual results and your accuracy will improve naturally over 3 to 6 months as you learn your business’s real cash patterns.
How do I handle unpredictable revenue in my cash flow projection?
Build three scenarios: a base case using your most realistic revenue estimate, a downside case at 70-80% of base, and an upside case at 120-130% of base. Run the 5-step projection for each scenario. The downside case tells you the minimum cash reserve you need to survive a slow period. For businesses with genuinely lumpy revenue (project-based consulting, construction, grant-funded nonprofits), tie inflow estimates to specific contracts or milestones rather than monthly averages. A $200,000 contract with a 50% deposit on signing and 50% on delivery produces two specific cash inflow events, not a smooth $16,667 per month for 12 months. Model the actual payment schedule.
What is Days Sales Outstanding (DSO) and how does it affect my projection?
Days Sales Outstanding (DSO) measures the average number of days between issuing an invoice and receiving payment. The formula is: DSO = (Accounts Receivable / Total Credit Sales) x Number of Days in the Period. If your accounts receivable balance is $60,000 and your monthly credit sales are $40,000, your DSO is ($60,000 / $40,000) x 30 = 45 days. This means cash from a sale made on Day 1 of the month arrives around Day 45, pushing it into the following month. In your projection, shift inflow timing by your DSO rather than recording revenue in the month of sale. Reducing DSO by 10 days on $500,000 in annual revenue frees up approximately $13,700 in working capital, which directly improves your projected cash position.
How often should I update my cash flow projection?
Update your projection at least monthly, immediately after your accounting period closes and you have actual bank and accounts receivable data. The update process has three steps: first, replace projected figures for the completed month with actual figures; second, calculate the variance for each line item using the formula (Actual – Projected) / Projected x 100; third, adjust future month assumptions if any variance exceeds 15% and reflects a structural change rather than a one-time event. If you are a startup or in a cash-tight period, update weekly. Businesses that forecast at least monthly are 2.5 times more likely to handle a cash crisis confidently than those that forecast less frequently (Intuit QuickBooks).
Can a profitable business have a negative cash flow projection?
Yes, and this is one of the most important concepts in business finance. Profit is an accounting concept: it records revenue when earned and expenses when incurred, regardless of when cash moves. Cash flow is a physical reality: it records money when it actually enters or leaves your bank account. A business can earn $100,000 in profit in Q1 while showing negative cash flow if customers have not yet paid their invoices, if the business pre-paid annual expenses in January, or if it invested heavily in inventory or equipment. This timing gap is why 82% of business failures trace back to cash flow problems rather than profitability problems (SCORE). Always run both a P&L forecast and a cash flow projection: the P&L tells you if the business model works; the projection tells you if you can survive long enough to prove it.
What is the minimum cash reserve I should maintain based on my projection?
Most financial advisors recommend maintaining a cash reserve equal to 3 months of fixed operating expenses. Calculate your fixed monthly outflows (rent, payroll, loan payments, essential subscriptions) and multiply by 3. If your fixed costs are $30,000 per month, target a minimum cash balance of $90,000. Your cash flow projection helps you determine whether you are on track to maintain that buffer or whether a specific month will draw it down. If your projection shows ending cash falling below your 3-month reserve in any month, that is a trigger to take action: accelerate collections, delay discretionary spending, or arrange a credit facility before the gap arrives.
Build Your First Projection Today
A cash flow projection is not a finance department luxury. It is the tool that separates the 18% of businesses that survive from the 82% that fail due to cash flow problems. The 5-step methodology is straightforward: define your period, estimate inflows with payment timing built in, estimate outflows by actual payment date, calculate net cash flow for each period, and add beginning cash to find your ending position. Run variance analysis monthly, shift to rolling forecasts as your business matures, and upgrade your tools only when spreadsheet complexity genuinely slows you down.
I recommend downloading the EFM Cash Flow Projection Template to start immediately. It includes pre-built monthly and quarterly formats, DSO-adjusted inflow timing, CAPEX scheduling, and a variance tracking tab so you can compare actuals against projections from month one.





















































