
0 ITEMS

Startup Financial Model Template: 5 Must-Have Investor Slides

A startup financial model template for an investor pitch deck is the single document that separates fundable companies from forgettable ones. Get the five core components right, and investors can stress-test your assumptions themselves.
Key Takeaways
- A credible startup financial model template must include 5 components: revenue projections, unit economics, cash flow forecast, headcount plan, and capital requirements, with monthly granularity for the first 18 months.
- 65% of pitch decks that fail due diligence are rejected because of financial model credibility gaps, not product or market concerns, according to DocSend pitch deck research.
- CAC payback period under 18 months is the benchmark most Series A investors use to evaluate SaaS unit economics viability.
- Burn multiple (net burn divided by net new ARR) below 1.5x signals capital efficiency; above 2x raises immediate red flags at institutional funds.
- Bottom-up revenue projections, built from individual customer or transaction assumptions, are 3 to 5 times more credible to investors than top-down market-share estimates.
- Assumptions must live on a dedicated, visible tab, not buried in cell formulas, so investors can run their own scenarios during due diligence.
- eFinancialModels offers investor-validated startup financial model templates with built-in formulas for all five components, formatted for direct pitch deck integration.
What Makes a Financial Model ‘Investor-Ready’ for Your Pitch Deck
An investor-ready financial model is one that a VC partner can open, change three assumptions, and immediately see how the business responds. It is not a spreadsheet that proves your optimism. It is a decision-support tool that proves your understanding of the business.
DocSend’s analysis of what VCs look for inside seed pitch decks found that investors spend an average of 3 minutes 44 seconds reviewing a deck, and that the financials section holds their attention about as long as the team slide. That means your model must communicate its logic visually and instantly.
Three qualities separate institutional-grade models from amateur ones:
- Transparent assumptions: Every key driver lives in a clearly labeled input cell, not hardcoded into a formula.
- Bottom-up construction: Revenue builds from unit-level activity, not from a percentage of a TAM (total addressable market).
- Integrated statements: The income statement, cash flow statement, and balance sheet link together so changing one assumption flows through all three.
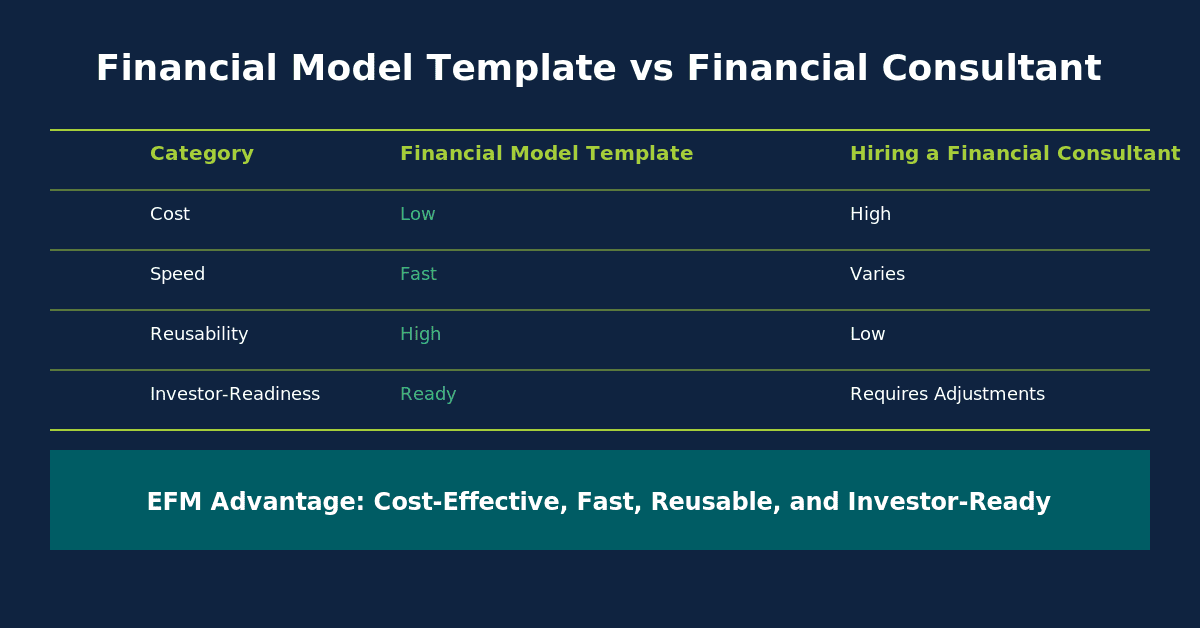
Investor-ready models share three structural qualities that allow VCs to stress-test assumptions independently during due diligence.
The 5 Core Components Every Startup Financial Model Template Must Include
Every investor-ready startup financial model template contains five non-negotiable components. Miss any one of them and a sophisticated investor will notice within the first two minutes of review.
Here are the five components, each with the specific outputs investors expect:
| Component | Key Output | Minimum Granularity |
|---|---|---|
| Revenue Projections | MRR/ARR growth curve | Monthly, 36 months |
| Unit Economics | CAC, LTV, Payback Period | By cohort or channel |
| Cash Flow Forecast | Runway in months | Monthly, 18-24 months |
| Headcount Plan | Salary + benefits by role | Quarterly |
| Capital Requirements | Use of funds breakdown | By milestone |
Each component feeds the next. Revenue projections drive the cash flow forecast. The headcount plan drives operating expenses. Capital requirements follow from the runway calculation. Build them in this sequence and the model stays internally consistent.
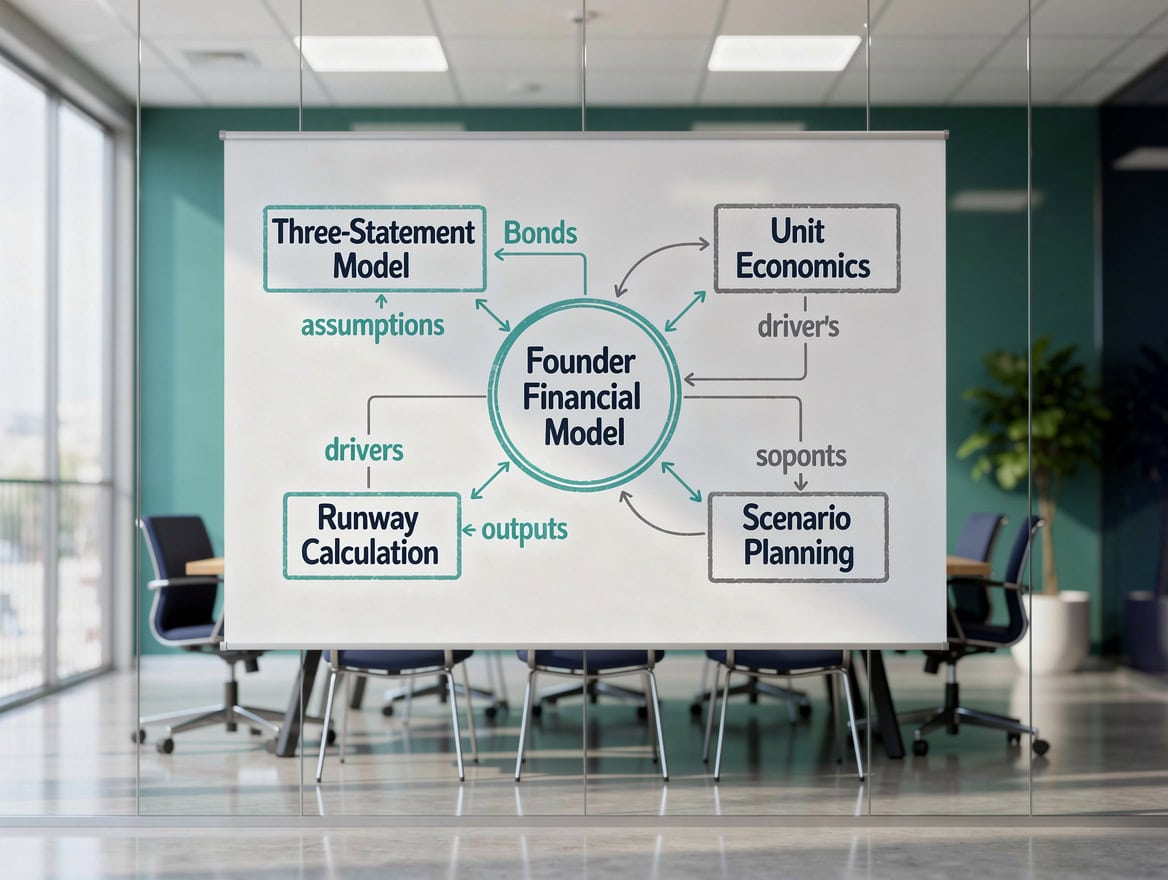
The five components of an investor-ready startup financial model build on each other sequentially: revenue drives cash flow, headcount drives expenses, and capital requirements follow from runway.
Revenue Projections: Building Bottom-Up Forecasts Investors Will Believe
Bottom-up revenue projections start from the number of customers, transactions, or units you can realistically acquire each month, then multiply by average revenue per unit. This approach is more credible than top-down estimates because it forces you to articulate your sales and marketing engine.
A top-down projection says: “The market is $10 billion and we’ll capture 1%.” A bottom-up projection says: “We’ll hire 2 SDRs in month 4, each closing 3 deals per month at $2,000 ACV, generating $12,000 in new MRR that month.”
Founders who build bottom-up financial models are far better placed to hit their 12-month revenue targets than those relying on top-down market-share assumptions. The discipline of building from unit assumptions forces realistic thinking about sales capacity and conversion rates.
Worked Example: SaaS Monthly Revenue Build
Assume the following inputs for Month 6:
- Sales reps active: 3
- Deals closed per rep per month: 4
- Average contract value (ACV): $18,000 per year
- Monthly recurring revenue per deal: $18,000 / 12 = $1,500
- New MRR from new deals: 3 reps x 4 deals x $1,500 = $18,000
- Churn rate: 1.5% monthly
- Beginning MRR (Month 5 close): $72,000
- Churned MRR: $72,000 x 1.5% = $1,080
- Ending MRR Month 6: $72,000 + $18,000 – $1,080 = $88,920
Repeat this logic for 36 months, adjusting the number of reps and ACV as the business scales. That is a bottom-up SaaS revenue model.
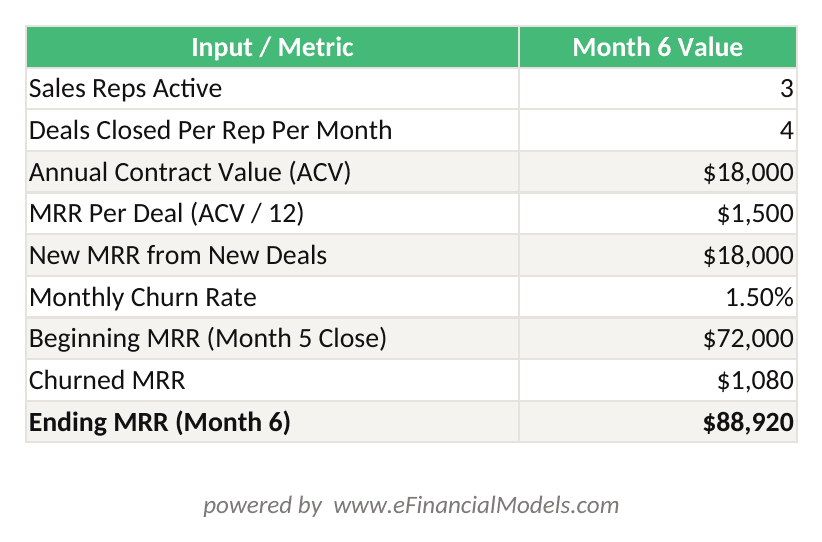
Bottom-up SaaS revenue model: 3 reps x 4 deals x $1,500 MRR per deal = $18,000 new MRR. Apply 1.5% churn to $72,000 beginning MRR to reach $88,920 ending MRR in Month 6.
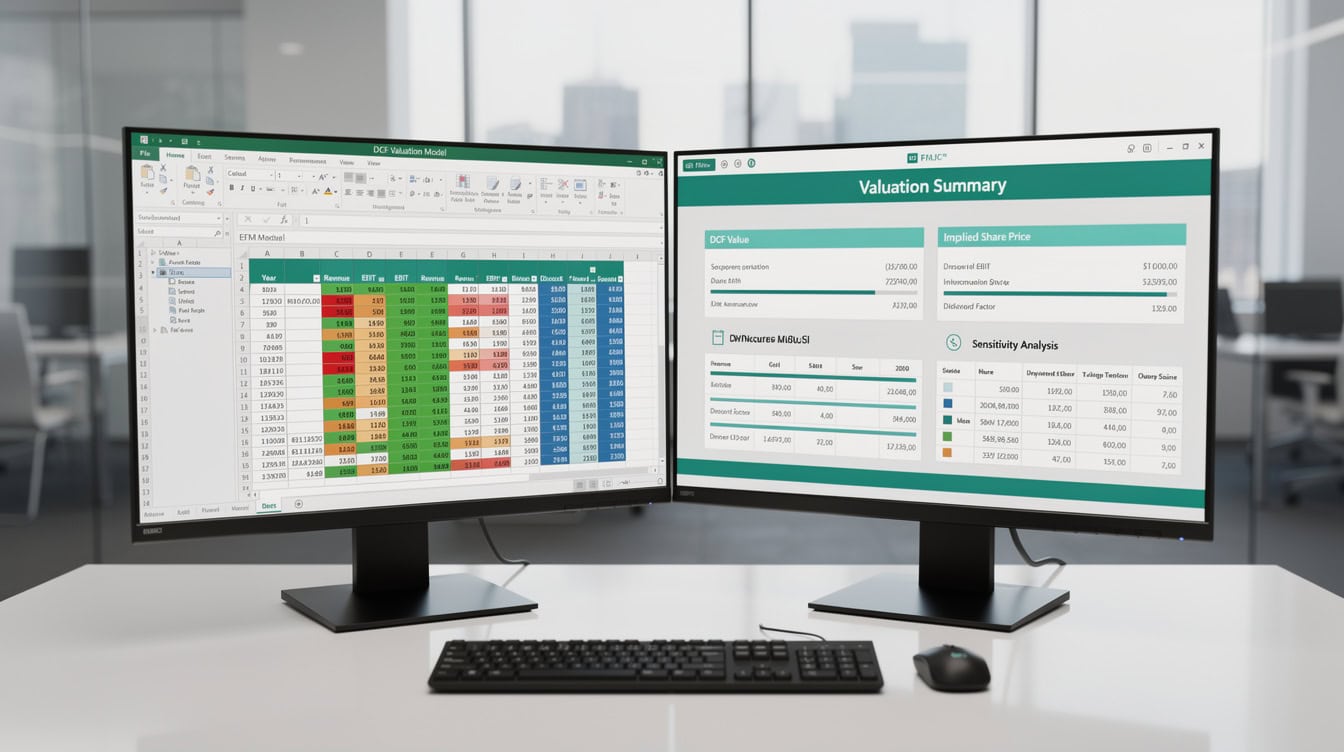
A bottom-up SaaS revenue model builds from sales rep capacity and deal conversion rates, not from top-down market share estimates.
Unit Economics and CAC/LTV: The Metrics That Make or Break Your Model
Unit economics (the revenue and cost associated with a single customer or transaction) tell investors whether your business model works at scale. The two most scrutinized metrics are CAC (customer acquisition cost) and LTV (lifetime value).
CAC is the total sales and marketing spend in a period divided by the number of new customers acquired in that period. If you spent $60,000 on sales and marketing in Q1 and acquired 40 customers, your CAC is $1,500.
LTV is the average gross profit generated by a customer over their entire relationship with your company. For a SaaS business with $1,500 monthly revenue, 70% gross margin, and 24-month average customer life: LTV = $1,500 x 0.70 x 24 = $25,200.
LTV:CAC ratio should be at least 3:1 for a Series A SaaS company. In the example above: $25,200 / $1,500 = 16.8x, which is strong.
CAC Payback Period is CAC divided by monthly gross profit per customer. Using the same numbers: $1,500 CAC / ($1,500 x 0.70) = 1.43 months. Most institutional investors expect SaaS CAC payback under 18 months; marketplace businesses typically run 6 to 12 months; hardware companies often see 24 to 36 months.
Burn Multiple is net cash burned divided by net new ARR added. A burn multiple of 1.0x means you burned $1 to generate $1 of new ARR. According to data published by Bessemer Venture Partners in their State of the Cloud report, top-quartile SaaS companies at Series A maintain burn multiples below 1.5x.
Cash Flow Forecasting and Runway Calculations for Fundraising
Cash flow forecasting shows investors exactly when you run out of money and what milestones you’ll hit before that date. Runway (the number of months of operating capital remaining) is calculated by dividing current cash balance by average monthly net burn.
Here’s the math: If you have $800,000 in the bank and your average monthly net burn is $65,000, your runway is $800,000 / $65,000 = 12.3 months.
Investors expect you to raise your next round with at least 6 months of runway remaining. That means you should start fundraising when you have 12 to 18 months of runway, giving yourself 6 months to close the round. Build this timeline explicitly into your model so investors can see the fundraising trigger point.
Your cash flow forecast should show three scenarios: base case, upside (20% better revenue), and downside (20% worse revenue). The downside scenario is the one investors care about most. It tells them how much buffer exists between your plan and insolvency.
For financial projections that integrate cash flow with your income statement, eFinancialModels provides three-statement model templates where changing a single revenue assumption automatically updates cash position and runway.

Start fundraising when you have 12 to 18 months of runway remaining, giving yourself 6 months to close the round before hitting the trigger point.
Headcount Planning and Operational Expense Modeling
Headcount is typically the largest expense category for early-stage startups, often representing 60 to 80% of total operating costs. Investors scrutinize salary assumptions because they reveal whether founders understand market compensation rates.
Build your headcount plan role by role, not as a lump sum. For each hire, specify: role title, start month, annual base salary, benefits load (typically 15 to 20% of base for US startups), and equity grant. The U.S. Bureau of Labor Statistics Occupational Employment and Wage Statistics program provides verified salary benchmarks by role and geography that you can cite directly in your assumptions tab. According to the BLS Occupational Outlook Handbook profile for software developers, quality assurance analysts, and testers, there were approximately 1,847,900 people employed in these roles in the United States. This underscores how competitive the talent market is and why accurate salary modeling matters.
A common mistake is modeling a VP of Engineering at $90,000 when BLS wage data for computer and information systems managers in the San Francisco metro area shows average pay well above $180,000. Investors who know the market will immediately discount your entire model when they see unrealistic salary figures.
Operational expenses beyond headcount should include: cloud infrastructure (model as a percentage of revenue for SaaS), office and facilities, software subscriptions, legal and accounting, and marketing spend. Each line item should have a visible assumption driving it.
How to Structure Assumptions for Investor Transparency and Stress-Testing
Assumptions should live on a single, dedicated tab labeled ‘Inputs’ or ‘Assumptions,’ with every key driver clearly labeled and color-coded. Blue cells for inputs, black cells for formulas is the standard convention used by institutional financial models.
Separate your assumptions into three tiers:
- Tier 1 (Critical): Revenue growth rate, churn rate, gross margin, CAC. These drive 80% of model outcomes. Make them prominent and easy to change.
- Tier 2 (Important): Headcount ramp, average deal size, conversion rates by funnel stage. These refine the model but don’t change the story dramatically.
- Tier 3 (Supporting): Tax rate, depreciation schedule, payment terms. These matter for accuracy but rarely change an investment decision.
For each Tier 1 assumption, include a brief written rationale in an adjacent cell. Example: “Churn rate: 1.5%/month. Based on industry median for SMB SaaS per OpenView Partners SaaS Benchmarks report. We expect to improve to 1.0% by Month 18 as onboarding improves.”
This documentation transforms your model from a spreadsheet into a business argument.
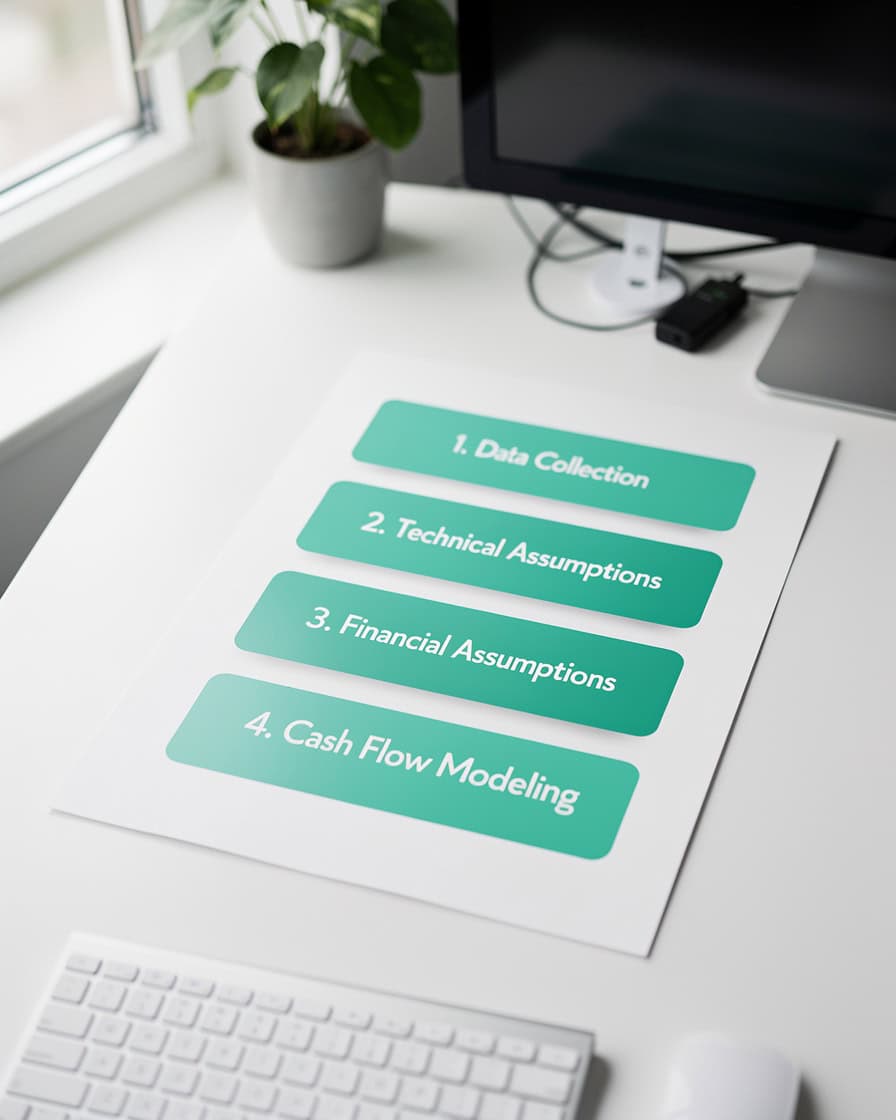
Organizing assumptions into three tiers helps investors navigate your model and focus their stress-testing on the drivers that matter most.
Industry-Specific Considerations: SaaS vs. Marketplace vs. Hardware Models
Different business models require different model structures and emphasize different metrics. A SaaS model built for a marketplace investor will immediately signal that the founder doesn’t understand their own business.
| Metric | SaaS | Marketplace | Hardware | Consumer |
|---|---|---|---|---|
| Primary Revenue Driver | MRR/ARR | GMV Take Rate | Units Sold | DAU/MAU x ARPU |
| Gross Margin Target | 70-80% | 50-70% | 30-50% | 40-60% |
| Key Efficiency Metric | CAC Payback | Liquidity Score | Inventory Turns | Retention D30 |
| Burn Multiple Benchmark | <1.5x | <2.0x | <3.0x | <2.5x |
| Model Complexity | Medium | High | High | Medium |
SaaS models must show MRR waterfall (new MRR, expansion MRR, churned MRR, net new MRR) and ARR bridge. Gross margins above 70% are expected; below 60% requires explanation.
Marketplace models must show gross merchandise value (GMV, the total transaction value flowing through the platform) separately from net revenue (your take rate applied to GMV). A 15% take rate on $500,000 GMV generates $75,000 net revenue, not $500,000.
Hardware models must include bill of materials (BOM) cost, manufacturing yield rates, and inventory financing assumptions. Gross margins below 40% at scale are a concern for most hardware investors.
Consumer app models must show daily active users (DAU), monthly active users (MAU), and the DAU/MAU ratio as an engagement proxy. Monetization assumptions should tie directly to engagement levels.
For SaaS-specific modeling, eFinancialModels provides dedicated financial model templates with pre-built MRR waterfall, cohort analysis, and ARR bridge tabs.
Common Financial Modeling Mistakes That Kill Startup Pitches
Five specific mistakes cause investors to immediately discount a startup’s financial model. Each one signals a credibility problem that extends beyond the spreadsheet.
Mistake 1: Hockey-stick projections without a mechanism. Revenue that grows 10x in Year 3 with no corresponding increase in sales headcount, marketing spend, or channel investment is mathematically impossible. Fix: Show the specific inputs (hires, campaigns, partnerships) that drive each growth step.
Mistake 2: Missing expense categories. Models that show only salaries and software subscriptions, omitting legal fees, accounting, insurance, office costs, and recruiting fees, understate burn by 20 to 35%. Fix: Use a complete operating expense checklist and validate against comparable companies’ S-1 filings.
Mistake 3: Unrealistic conversion rates. Modeling a 10% free-to-paid conversion rate when the SaaS industry median is 2 to 5% (per OpenView Partners SaaS Benchmarks) signals wishful thinking. Fix: Cite your source for every conversion rate assumption.
Mistake 4: Salary figures disconnected from market rates. As noted above, underpriced salaries make the entire model suspect. Fix: Use BLS OEWS data or verified compensation surveys for every role.
Mistake 5: No scenario analysis. A model with only one scenario tells investors you haven’t stress-tested your own assumptions. Fix: Build base, upside, and downside scenarios with a simple toggle on the assumptions tab.
Integrating Your Financial Model with Pitch Deck Slides and Cap Table
Your financial model and pitch deck must tell the same story with the same numbers. Inconsistencies between the two are one of the fastest ways to lose investor trust.
Four pitch deck slides pull directly from your financial model:
- Traction slide: Pull actual MRR, customer count, and growth rate from your model’s historical tab.
- Financial projections slide: Show a 3-year revenue and gross profit chart directly from your model output. Use the same numbers, not rounded approximations.
- Use of funds slide: The capital requirements tab in your model should produce the exact percentages shown on this slide (e.g., 45% product, 35% sales and marketing, 20% operations).
- Unit economics slide: CAC, LTV, and payback period should match the unit economics tab exactly.
For cap table integration, your model should show pre-money and post-money ownership percentages for the current round, including option pool dilution. The financial projections templates at eFinancialModels include a cap table tab that links directly to the use-of-funds and valuation sections.
On file format: Excel remains the standard for institutional investors because it allows formula auditing. Excel supports up to 64 levels of nested functions, according to Microsoft’s Excel specifications and limits documentation. This means even the most complex multi-driver financial models can be built with full formula transparency inside a single workbook. Google Sheets is acceptable for early-stage angel rounds but convert to Excel before any Series A process. Never share a PDF of your model as the primary deliverable; investors need to be able to change assumptions.

Four pitch deck slides pull directly from your financial model. Inconsistencies between the model and the deck are one of the fastest ways to lose investor trust.
Startup Financial Model Template: Implementation Checklist and Next Steps
A startup financial model template becomes investor-ready when it passes a 10-point checklist. Use this before sending your model to any investor.
Pre-Send Checklist:
- [ ] Assumptions tab exists with all Tier 1 inputs labeled and color-coded
- [ ] Revenue model is bottom-up, built from unit-level activity
- [ ] MRR waterfall or equivalent revenue bridge is present
- [ ] Unit economics tab shows CAC, LTV, LTV:CAC ratio, and payback period
- [ ] Cash flow forecast shows monthly runway for 24 months
- [ ] Headcount plan lists every role with start month and market-rate salary
- [ ] Three scenarios (base, upside, downside) are accessible via a toggle
- [ ] All three financial statements (income, cash flow, balance sheet) are linked
- [ ] Use-of-funds breakdown matches the pitch deck slide exactly
- [ ] Model has been reviewed by someone who has not seen it before (the “fresh eyes” test)
For stage-specific guidance: pre-seed models can simplify to a single-tab cash flow with 12-month granularity. Seed models should include all five components above. Series A models require full three-statement integration, cohort analysis, and sensitivity tables.
The free financial model templates at eFinancialModels include stage-specific versions for pre-seed through Series A, with built-in assumption documentation and scenario toggles.
Frequently Asked Questions
What should a startup financial model template include for a pitch deck?
A startup financial model template for a pitch deck must include five core components: revenue projections built bottom-up from unit-level assumptions, unit economics showing CAC, LTV, and payback period, a monthly cash flow forecast with runway calculation, a headcount plan with market-rate salaries by role, and a capital requirements breakdown showing use of funds by category. Each component should link to the others so changing one assumption flows through the entire model. The assumptions tab should be visible and editable, not hidden, so investors can run their own scenarios. eFinancialModels provides templates with all five components pre-built and formatted for direct pitch deck integration.
How many months of projections do investors expect in a startup financial model?
Investors expect monthly projections for the first 24 months and annual projections for Years 3 through 5. The monthly granularity for the first 24 months is critical because it shows the fundraising trigger point (when you’ll need to raise again) and the specific milestones you’ll hit with the current round’s capital. Annual projections for Years 3 to 5 are used to calculate terminal value in DCF (discounted cash flow) analysis and to assess the scale potential of the business. Pre-seed models can simplify to 12 months of monthly detail; Series A models should show 36 months of monthly data.
What is a burn multiple and why do investors care about it?
Burn multiple is net cash burned divided by net new ARR (annual recurring revenue) added in the same period. It measures capital efficiency: how much money you spend to generate each dollar of new recurring revenue. A burn multiple of 1.0x means you burned $1 to generate $1 of new ARR. According to Bessemer Venture Partners’ State of the Cloud benchmarks, top-quartile SaaS companies at Series A maintain burn multiples below 1.5x. A burn multiple above 2.0x signals that the business is growing inefficiently and will require disproportionate capital to scale. Investors use this metric to compare capital efficiency across portfolio companies and to assess whether your growth is sustainable.
Should I use Excel or Google Sheets for my startup financial model?
Excel is the standard for institutional investors at seed stage and above because it supports formula auditing, named ranges, and more sophisticated data validation than Google Sheets. Institutional investors and their analysts need to audit your formulas, and Excel’s ‘Trace Precedents’ and ‘Evaluate Formula’ tools make that process faster. Google Sheets is acceptable for angel and pre-seed rounds where the investor relationship is more informal. If you build in Google Sheets, export a clean Excel version before any Series A process. Never share a PDF as your primary model deliverable. The eFinancialModels startup financial model templates are built in Excel with full formula transparency and a clean assumptions tab.
What CAC payback period is acceptable for a Series A SaaS startup?
Most Series A SaaS investors expect a CAC payback period under 18 months, with top-quartile companies achieving 12 months or less. CAC payback period is calculated by dividing CAC by monthly gross profit per customer. For example, if your CAC is $3,600 and your monthly gross profit per customer is $300 (monthly revenue of $400 x 75% gross margin), your payback period is $3,600 / $300 = 12 months. Payback periods above 24 months are a concern at Series A because they indicate the business requires significant upfront capital to acquire customers before generating returns. Marketplace businesses typically target 6 to 12 months; hardware companies often see 24 to 36 months and must compensate with higher LTV.
How do I make my revenue projections credible to investors?
Revenue projections become credible when they are built bottom-up from specific, auditable assumptions about sales capacity, conversion rates, and average deal size. Start with the number of salespeople or marketing channels active each month, apply a realistic conversion rate (cite your source, whether it is your own early data or an industry benchmark), and multiply by average contract value. Every assumption should have a written rationale in an adjacent cell. Avoid top-down projections that start with market size and apply a percentage capture rate. Investors have seen thousands of “we’ll capture 1% of a $10 billion market” slides and they are universally dismissed. Your own early traction data, even from 10 customers, is more credible than any market-share estimate.
What is the difference between a pre-seed and Series A financial model?
A pre-seed financial model can be a single-tab cash flow showing 12 months of monthly burn, revenue assumptions, and runway. It needs to answer one question: how long does this capital last and what milestones does it buy? A Series A financial model requires full three-statement integration (income statement, balance sheet, and cash flow statement all linked), 36 months of monthly revenue detail, cohort analysis showing retention curves, sensitivity tables for key assumptions, and a cap table showing pre- and post-money ownership. The complexity difference reflects the investor’s due diligence process: angel investors often make decisions in days; Series A institutional funds run 60 to 90 day processes with dedicated analysts who will audit every formula. eFinancialModels offers stage-specific startup financial model templates for pre-seed through Series A.
Conclusion
A startup financial model template for your investor pitch deck is not a formality. It is the document that proves you understand your business well enough to allocate someone else’s capital responsibly. Build it bottom-up, make your assumptions visible, integrate it with your pitch deck slides, and stress-test it before every investor meeting.
I recommend downloading the eFinancialModels investor-ready startup financial model template as your starting point. It includes pre-built tabs for all five core components, a dedicated assumptions tab with color-coded inputs, three-scenario toggle, and a use-of-funds breakdown formatted for direct pitch deck integration. It has been used by founders raising from pre-seed through Series A and is built in Excel for full formula transparency during investor due diligence.























































