
0 ITEMS

Manufacturing KPI Dashboard
What Is A Manufacturing KPI? A manufacturing Key Performance Indicator (KPI) or metric is a well defined and quantifiable measure that the manufacturing industry uses to gauge its performance over time. Manufacturing companies specifically use KPIs to monitor, analyze, and optimize operations, often comparing their efficiencies to those of competitors in the same sector.

| Financial Model, Manufacturing |
| Human Resources (HR), KPIs (Key Performance Indicators), Management, Marketing |


The Fundamental Manufacturing KPIs and Metrics That You Should Be Using in 2021
When your company is just starting to implement KPIs, the whole concept can seem fairly daunting. Rest assured, it isn’t as bad as you think. Everything can be broken down into smaller, more digestible morsels of information. In this section, we will go over 10 of the basic examples of KPIs in manufacturing that your company should consider using:
Throughput – This is probably one of the most fundamental KPIs for the manufacturing industry while also arguably one of the most important. The Throughput KPI measures the production capabilities of a machine, line, or plant, also known as how much they can produce over a specified time period.
Throughput = # of Units Produced / Time (hour or day)
Cycle Time – The cycle time KPI is very simple in nature, but that doesn’t mean it can’t be manipulated to be a very powerful tool. In the manufacturing industry, cycle time is the average amount of time it takes to produce a product. Simple, right? Maybe not as simple as you think. The cycle time metric can be used to measure the time it takes to manufacture a completed product, each individual component of the final product, or even go as far as to include delivery to the end user. Thus, cycle time can be used to analyze the overall efficiency of a manufacturing process on the macro scale, as well as determine inefficiencies on a micro scale.
Cycle time = Process End Time – Process Start Time
Demand Forecasting – This manufacturing metric is used by companies to estimate the amount of raw materials they will require to meet future customer demand. This metric can be a little bit trickier for companies to fully utilize, as it is highly dependent on uncontrollable external factors. The basic formula is as follows:
Projected Customer Demand = Raw Materials * Production Rate
Inventory Turns – This is a measure of how many times inventory is sold over a specific time period and helps indicate resource effectiveness. Low ratio numbers indicate poor sales and excessive inventory, while high ratio numbers represent strong sales or insufficient inventory.
Inventory Turns = Cost of Goods Sold / Avg. Inventory
Production Attainment – This production performance metric measures production levels over a specific time period and calculates what percentage of the time a target production level is achieved.
Production Attainment = # of Periods Production Target Met / Total Time Periods
Cash to Cash Cycle Time – This is a time-based manufacturing KPI metric. It measures the amount of time it takes from an initial cash outlay for raw materials, inventory, or a manufacturing plant until the company receives cash from its customers for its products. This KPI is typically measured in days.
Cash to Cash Cycle Time = Inventory Sale Date – Inventory Purchase Date
Avoided Cost – This doesn’t mean you can just avoid paying bills and keep all the profits. The avoided cost manufacturing metric is an estimate of how much money you saved by spending money. Seems strange, right? The most common example is how much money is spent on machine maintenance vs. repair cost if a machine were to break down, plus the lost production value associated with the repair downtime.
Avoided Cost = Assumed Repair Cost + Production Losses – Preventative Maintenance Cost
Changeover Time – At the most basic level, changeover time represents the amount of time required to switch from one task to another. Typically, in manufacturing, it represents the amount of time lost from switching a production line from one product to another. However, it can also represent the amount of time lost during a shift change.
Changeover Time = Net Available Time – Production Time
Takt Time – This is a very useful manufacturing KPI when scheduling production orders or deciding whether to take an order from a client. Takt time is the maximum permissible amount of time that can be spent manufacturing a product while still meeting a client’s deadline. For those who are curious, Takt stands for “taktzeit,” a German word meaning “cycle time.” While very similar in nature, this is not to be confused with the cycle time KPI.
Takt Time = Net Available Time / Customer’s Daily Demand
Manufacturing KPI Takt Time
Return on Assets (ROA) – You might be thinking this seems like it has less to do with manufacturing and more to do with finance. That is because it does. However, financial metrics are just as important as manufacturing metrics. You can’t have a business if you aren’t making money. This metric evaluates how well your business is making use of its assets (money). It is the annual net income divided by total assets (fixed assets + working capital).
ROA = Net Income / Avg. Total Assets
It is key to note that these are just the basic KPIs used in the manufacturing industry. A company should look beyond these for more insight into its production practices.
What Makes the Best Manufacturing KPI Metrics?
There is a plethora of manufacturing KPIs considered to be standard practice throughout the industry. However, that doesn’t mean that they should all be applied to any company that produces a product. While many of them are applicable, some are not. There might even be the possibility that a standard manufacturing metric doesn’t even exist for what you want to measure. If you are going to create your own production metric, there are some things you should take into consideration.
Every KPI needs a clearly defined goal. What are you trying to achieve? Is it even something that can be achieved? What is the time period that you wish to achieve this goal? Be specific and set up parameters that clearly define your goal. This goal needs to be something that can be numerically defined (quantitative, not qualitative).
It is very important that you are able to objectively measure your progress toward the goal. This means collecting and interpreting data. This brings us to the next criterion.
Data, data, data. There must be a clearly defined data source with a strict procedure for how the data are measured or collected. There should be nothing left to interpret here.
Reporting your data is just as important as collecting it. Different manufacturing KPIs will have different reporting frequencies. Typically, reporting should happen on a weekly or monthly basis and will often make use of a manufacturing reporting software solution.
Now that we have gone over some of the basic KPIs for the manufacturing industry and have a grasp of what makes a good KPI, we can dig a bit deeper into the world of manufacturing KPIs and explore lean manufacturing KPIs.
Lean Manufacturing KPIs
Lean manufacturing is a practice of Japanese origin (name drop: Toyota) whereby companies attempt to minimize the amount of “waste” without sacrificing productivity. “Waste” in this situation doesn’t mean garbage or refuge from the production process. It actually represents any activity that does not add value from a customer’s perspective. Listed below are 10 examples of lean manufacturing KPIs:
Machine Downtime Rate – While this is commonly used as a manufacturing metric to give a general snapshot of how the operation is going, it doesn’t paint a full picture. Machine downtime is a combination of both scheduled downtime and unscheduled downtime.
Machine Downtime Rate = Downtime Hours / (Downtime Hours + Operational Hours)
Percentage Planned Maintenance – This production metric is used to analyze the ratio of scheduled maintenance against unscheduled maintenance. This KPI is useful in identifying when more preventative maintenance is required for certain assets.
PPM = (# Planned Maintenance Hours * 100) / # Total Maintenance Hours
Downtime to Operating Time – This manufacturing metric can be used to measure the effectiveness of machinery maintenance and the machine itself. With effective preventative maintenance, the amount of downtime can be reduced, creating a more optimal manufacturing process. Companies aspire to reduce this ratio as much as possible.
Downtime to Operating Time = Downtime / Operating Time
Capacity Utilization – This production KPI measures the amount of capacity being utilized as a function of the total capacity available. Ideally, companies want this number to be as high as possible, as it indicates they are making better use of their production capabilities and maximizing return on their assets. This metric can also be used by management when deciding whether to take on new orders or quote lead time, as it gives a snapshot of available resources.
Capacity Utilization = Actual Factory Utilization / Total Productive Capacity
First Pass Yield – This is one of the most fundamental production KPIs. It calculates the percentage of products manufactured to specification the first time through the process. This means that they do not require any rework or become scrap. A higher FPY rate is very desirable for any company.
First Pass Yield Rate = Quality Units / Total Units Produced
Overall Equipment Effectiveness (OEE) – This key performance indicator is considered the gold standard for measuring manufacturing productivity. The higher your OEE, the more effective your equipment is. A score of 100 percent means that you are manufacturing 100 percent of the time, at 100 percent capacity, and at a 100 percent yield (no defective parts).
OEE = Availability * Performance * Quality
Manufacturing Cost Per Unit – It is very important that you know the total cost associated with manufacturing a product on a per-unit basis. Without it, you wouldn’t be able to price a product properly. This KPI takes into account all costs associated with production and divides the cost by the number of units manufactured. Typical costs include materials, overhead, depreciation, labor, etc.
Manufacturing Cost Per Unit = Total Manufacturing Cost / # of Units Produced
Material Yield Variance – This lean manufacturing KPI takes the estimated amount of material required for a product and compares it against the amount of material actually used.
Material Yield Variance = Actual Material Use / Expected Material Use
Maintenance Cost Per Unit – This production metric is often overlooked as people tend to consider maintenance cost to be an overhead item. However, it is an important lean manufacturing KPI to take into consideration when trying to optimize efficiency. This calculation takes the total cost of maintenance (both preventative and emergency) and divides it by the number of units produced for a specified time period.
Maintenance Cost Per Unit = Total Maintenance Cost / # of Units Produced
Overtime Rate – This metric compares the amount of overtime worked by employees to the amount of standard hours. It helps to identify inefficiencies in scheduling and/or staffing.
Overtime Rate (Percentage) = (Overtime Hours * 100) / Regular Hours
We have covered 20 different manufacturing KPI examples at this point, as well as what it takes to make your own. Now it is time to look at some data management best practices.
How to Keep Track of Your KPI Data
Quality control and process management are not the most exciting things going on at a manufacturing company, but they are the backbone of the operation. After companies start to implement their newly created KPIs and metrics, they often keep track of the collected data using Excel (hopefully, no one is still compiling data using a ledger book). However, there are a couple of things to take into consideration when managing your data:
Data protection and security are essential. Hackers stealing your KPI data is probably not a huge concern. However, it is critical that your data are backed up and can’t be deleted by accident.
Reduce the amount of duplicate data. Don’t keep multiple working copies of the same data. Have one working copy and one unaltered backup.
Ensure your KPI data are easily accessible to your team. There is nothing worse than not being able to do your work because you don’t have access to the information that you need.
All of these concerns can actually be remedied through the use of a reporting solution. Here at insight software, we build industry-leading reporting software solutions. Come and see how our KPI dashboards can help your company get ahead of the curve.
How to Compare KPI Reporting & BI Solutions
Streamline Your Reporting with Manufacturing Reporting Software
Regardless of whether your manufacturing company is large or small, using a manufacturing dashboard can help with the following reporting processes:
Managing large data dumps manually is an inefficient process. A manufacturing dashboard is able to automatically process collected data and turn the data into analytics and insights.
Consolidating the data into a central location can take a long time. Manufacturing reporting software allows companies to input all of their information into a single centralized location.
Interface with other services. Manufacturing reporting solutions have developed over time to become powerful tools. Any good business intelligence software will be able to interface with your favorite ERP software.
Instant updates at your fingertips. Gone are the days of asking someone to bring you weekly data updates from different segments of the company. Everything you need is just one click away. With a centralized database, manufacturing dashboards can immediately generate reports on performance, as well as send you alerts when a KPI starts to underperform.
Having a manufacturing reporting solution is a crucial aspect of operating a company in the industry. Centralized data with real-time reporting will give any company the potential edge required to stay ahead of its competitors. However, it is important to remember that KPIs aren’t a one-time set and forget. They will require updating as your business grows and expands. Sometimes there are metrics that you don’t think of when someone says manufacturing.
More Examples of KPIs Used in Manufacturing
Here are 10 additional manufacturing KPI metrics that might take you by surprise:
On-Time Delivery – This is less of a production performance metric but a very important KPI in the manufacturing sector nonetheless. You can have the most efficient production line in the world, but if you can’t deliver on time, clients are not going to want to work with you. This metric measures the percentage of products delivered on time to clients.
On-Time Delivery = (# Units Delivered On-Time * 100) / # Units Delivered
Health and Safety Incidence Rate – In an ideal world, this manufacturing metric would not even exist because it would be zero. Unfortunately, the reality of the matter is that workplace accident and near misses do occur. This metric monitor the number of incidents or near misses over a given period of time (normally per annum).
Health and Safety Incidence Rate = (Number of Incidences * 200,000) / # hours worked by all employees
Similar ProductsOther customers were also interested in...


 Bassem Mneimne
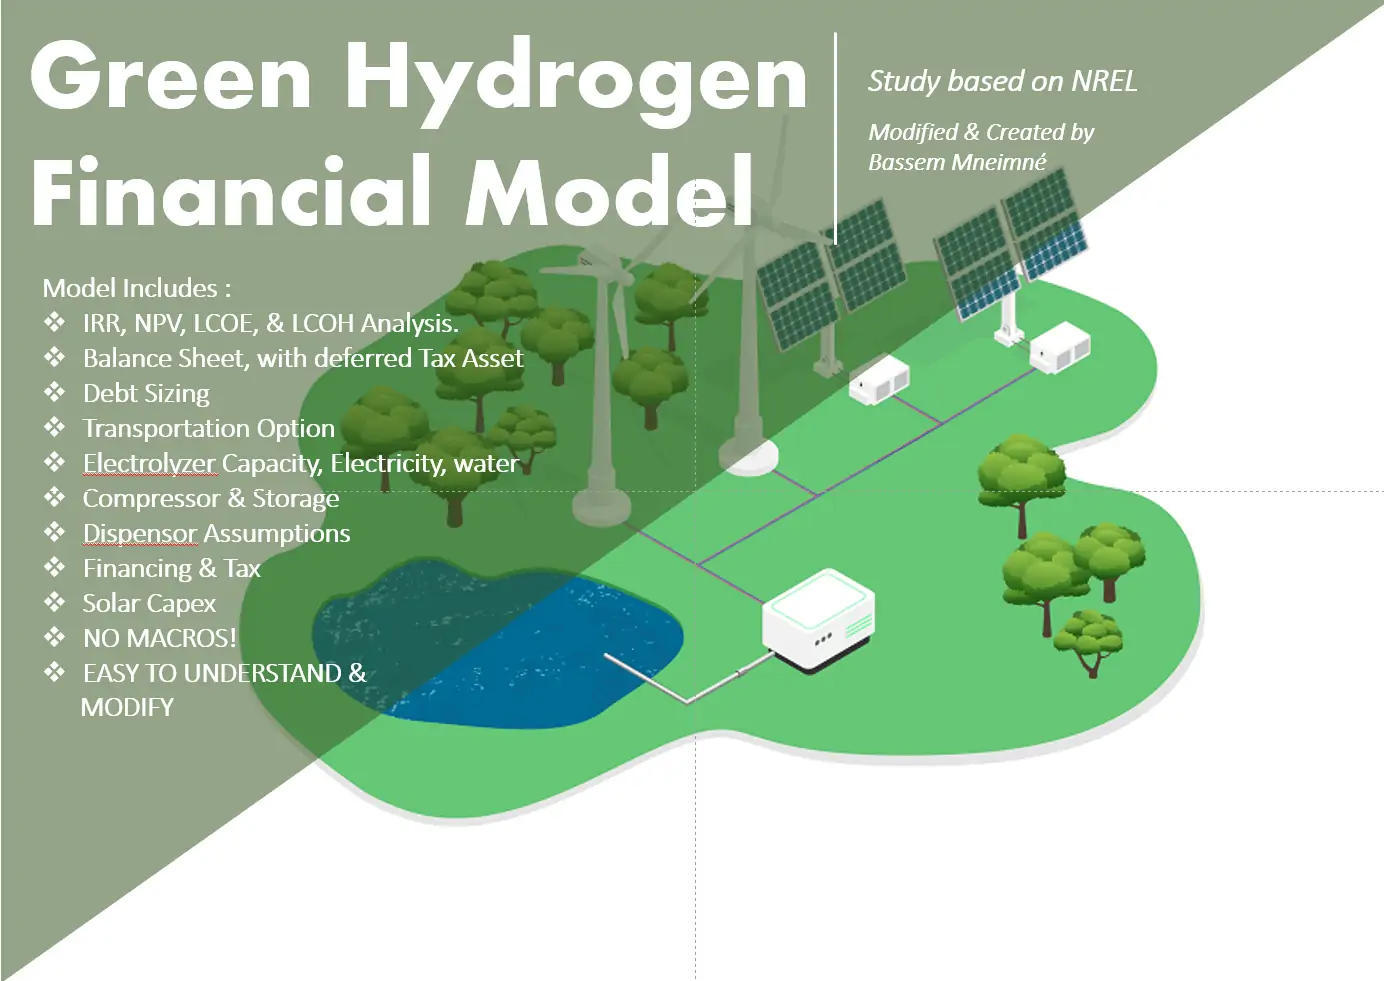
Green Hydrogen (Simple Electrolysis Financial Mode...
The Model Incorporates data provided by different available sources to Model an Electrolysis financi... Read more

 Giorgos
Manufacturing Company – 10 Year Financial Mo...
Financial Model providing a dynamic up to 10-year financial forecast for a startup Manufacturing Com... Read more

 eFinancialModels
Liquor Distillery Financial Plan Template
Distilleries, with their rich history of crafting spirits, have experienced a resurgence in populari... Read more
 David
David
Manufacturing Startup/Existing Business Financial ...
3 statement 5 year rolling financial projection Excel model for a startup /existing manufacturing bu... Read more
Prefabricated Buildings Manufacturer – 10 Ye...
Financial model presenting a development scenario of a Prefabricated Buildings Factory including con... Read more

Fashion Designer (Independent) – 5 Year Financia...
Financial Model providing a highly sophisticated 5-year financial plan for a startup Independent Fas... Read more

Waste Management Company – Dynamic 10 Year Finan...
Financial model presenting a business scenario of a Waste Management Company collecting Solid Waste ... Read more

Recycling Company Financial Model – Dynamic 10 Y...
Recycling is the process of converting waste materials into new materials and objects. The recovery ... Read more

Clothing Manufacturing – 10 Year Financial Model
Financial Model providing a dynamic up to 10-year financial forecast for a startup Clothing Manufact... Read more
Furniture Manufacturing – 10 Year Financial ...
Financial Model providing a dynamic up to 10-year financial forecast for a startup Furniture Manufac... Read more
Reviews
 Free Demo
nice pdf demo for KPI
#KPI
KEEP PERFORMANCE INDECADOR.
you can try it now for free
202 of 391 people found this review helpful.
Help other customers find the most helpful reviews
Did you find this review helpful?
You must log in to submit a review.