
0 ITEMS

Biodiesel Manufacturing Business Financial Model Excel Template
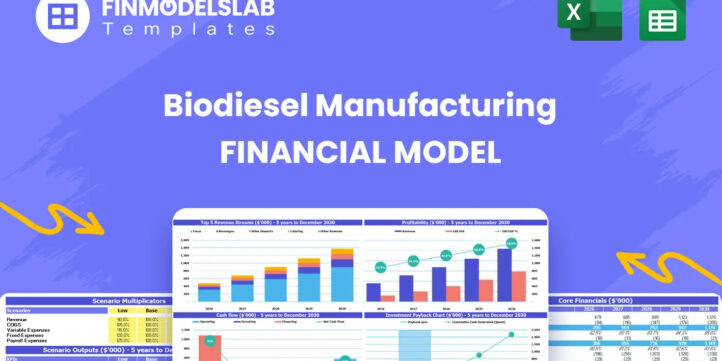
The Biodiesel Manufacturing Financial Model helps entrepreneurs, founders, business owners, consultants, and analysts build a structured financial forecast for a biodiesel production venture without starting from a blank spreadsheet. It is designed to translate the core economics of a biodiesel plant into a practical planning tool, including revenue assumptions for biodiesel blends, byproduct sales, renewable fuel credits, startup costs, operating expenses, payroll, profitability, and cash flow. Whether you are preparing a business plan, assessing a new facility, validating expansion economics, or organizing numbers for potential lenders and investors, this template gives you a clear framework for understanding how the business could perform over time. The model is especially useful for users who need to evaluate the relationship between production volume, pricing, feedstock costs, plant expenses, staffing, and capital investment. Biodiesel manufacturing can be highly sensitive to input costs, processing efficiency, market pricing, regulatory incentives, and utilization rates, so a generic forecast often misses the details that matter. This template provides editable assumptions and connected outputs so you can test your own production strategy, adjust pricing, review startup cost requirements, estimate payroll needs, and understand how operating decisions affect margins and cash flow. Built for financial planning, funding preparation, and internal decision-making, the Biodiesel Manufacturing Financial Model helps users estimate revenue potential, forecast cost of goods sold, review fixed and variable expenses, and evaluate profitability over a multi-year period. It also supports break-even analysis, allowing you to see when the operation may begin covering its costs and generating positive returns. With organized financial statements and visual outputs, the template can help turn complex production economics into a clearer financial story for stakeholders, partners, banks, and investors. Instead of spending days building formulas, formatting reports, and linking assumptions manually, users can work from a ready-made financial model template that is fully editable and compatible with Excel and Google Sheets. You can modify production volumes, biodiesel pricing, RIN credit assumptions, glycerin sales, feedstock costs, payroll, capital expenditures, financing needs, and other key drivers to reflect your specific project. The result is a practical, reusable model that supports better budgeting, more confident planning, and more informed decisions before launching or scaling a biodiesel manufacturing business.


Financial Model Overview
The Biodiesel Manufacturing Financial Model is a ready-to-use financial model template designed to help users evaluate the economics of a biodiesel production business with a structured, editable, and investor-ready forecasting framework. Biodiesel manufacturing involves multiple revenue drivers, significant startup investment, feedstock purchasing, plant operations, payroll planning, regulatory credit assumptions, byproduct sales, and ongoing cash flow management.
This template brings those moving parts together in one organized model so entrepreneurs, business owners, analysts, consultants, and founders can estimate financial performance before launching, expanding, or presenting the opportunity to stakeholders. Instead of relying on rough estimates or building a model from scratch, users can work from a pre-built structure that connects commercial assumptions to revenue, costs, profitability, cash flow, and funding requirements. The model is useful for business plans, lender discussions, investor presentations, internal budgeting, feasibility analysis, and decision-making around production scale, pricing, staffing, and capital investment.
All-in-One Dashboard
The all-in-one dashboard provides a central view of the most important inputs and outputs in the Biodiesel Manufacturing Financial Model. It is designed to help users quickly understand how core assumptions flow through the forecast and affect the overall financial outlook of the business. Key inputs may include production volume, sales pricing for biodiesel products, byproduct revenue, RIN credit assumptions, feedstock costs, staffing levels, fixed operating expenses, capital expenditures, and financing assumptions. The dashboard then connects these inputs to essential outputs such as total revenue, gross profit, EBITDA, net income, cash position, return metrics, and key operating ratios.
This component is useful because biodiesel manufacturing can be difficult to evaluate when information is spread across many separate sheets or calculations. A centralized dashboard gives decision-makers a faster way to review the business case, identify the most important financial drivers, and communicate the forecast clearly to partners, management teams, banks, and investors. It also supports ongoing planning because users can update assumptions and immediately see how changes affect the financial model.
Low, Base, and High Scenario Analysis
The low, base, and high scenario analysis component helps users test how the biodiesel manufacturing business may perform under different operating and market conditions. A biodiesel plant’s results can change significantly depending on feedstock pricing, biodiesel demand, blend pricing, plant utilization, RIN credit values, energy costs, logistics expenses, and production efficiency.
This section allows users to compare a conservative case, a central planning case, and an upside case within the same financial framework. Inputs may include lower or higher production volumes, adjusted sales prices, different credit values, changes in raw material costs, altered operating expenses, or revised capital investment assumptions. The outputs help users compare revenue, margins, cash flow, profitability, and financing needs across scenarios. This is valuable for planning because it shows whether the business remains viable if assumptions become less favorable and how attractive the opportunity may be if market conditions improve. It also strengthens funding discussions by showing investors and lenders that the project has been evaluated beyond a single optimistic forecast.
Professional Charts
The professional charts component turns the financial model’s key results into visual summaries that are easier to review, explain, and present. Biodiesel manufacturing forecasts often include many detailed assumptions, including product mix, unit sales, feedstock costs, payroll, capital expenditures, financing, and operating expenses. Charts help convert that detail into clear visual information, such as revenue growth, EBITDA trends, cash balance movement, gross margin development, expense composition, and profitability over time.
Inputs are drawn automatically from the connected assumptions and financial statements, so when users update production volumes, prices, costs, or staffing plans, the visual outputs can update along with the forecast. This component is useful for stakeholder communication because not every reader wants to inspect every formula or worksheet. Professional charts make the model more presentation-ready for business plans, investor decks, loan packages, management meetings, and strategic reviews. They also help users spot trends and issues quickly, such as declining margins, cash shortfalls, heavy reliance on one revenue stream, or periods when operating costs may need closer control.
ROE Components and DuPont Analysis
The ROE components and DuPont analysis section helps users evaluate the drivers behind return on equity rather than looking only at a single headline return figure. In a capital-intensive business such as biodiesel manufacturing, return metrics can be influenced by profit margins, asset utilization, leverage, working capital needs, and the scale of investment required to bring the facility online. This component breaks return on equity into more understandable drivers, helping users see whether returns are being generated primarily through operating profitability, efficient use of assets, or financial leverage.
Inputs may include net income, revenue, total assets, equity, debt assumptions, plant investment, and balance sheet forecasts. Outputs may include ROE, profit margin, asset turnover, equity multiplier, and related financial ratios. This section is useful for investors, lenders, and internal decision-makers because it provides a deeper view of financial performance and capital efficiency. For a biodiesel manufacturing plant, this can help users assess whether the business is truly generating strong operating value or whether returns depend heavily on leverage, aggressive assumptions, or unusually high utilization.
Revenue Inputs
The revenue inputs section provides the foundation for forecasting sales in the Biodiesel Manufacturing Financial Model. It allows users to define the assumptions that drive income, such as production volume, product mix, biodiesel blend pricing, B100 sales, B20 and B5 blend sales, glycerin byproduct sales, and Renewable Identification Number revenue. Because biodiesel plants may generate revenue from both fuel products and related credits or byproducts, the model needs a flexible structure that captures more than one stream of income.
Users can adjust unit volumes, prices, growth rates, timing assumptions, and credit values to reflect their own market, production capacity, and commercial strategy. The outputs flow into total revenue, gross margin, profitability, cash flow, and valuation-related metrics. This component is important because revenue quality directly affects the credibility of the forecast. By separating key sales assumptions and making them editable, the template helps users validate whether projected sales are realistic, compare different pricing strategies, and understand how much of the business depends on biodiesel sales versus byproduct or credit-related income.
Bank-Ready Reports
The bank-ready reports component organizes the financial outputs in a format that supports lender review, funding discussions, and formal business planning. Biodiesel manufacturing often requires meaningful upfront investment in equipment, processing systems, storage, working capital, compliance, and facility setup, so lenders and financing partners need to see more than a basic sales estimate. This section may include projected profit and loss statements, cash flow forecasts, balance sheet summaries, debt service assumptions, financing requirements, repayment capacity, and key financial ratios.
Inputs come from the connected operating forecast, including revenue assumptions, cost of goods sold, payroll, capital expenditures, taxes, financing terms, and operating expenses. Outputs help users present a clear picture of whether the business can generate enough cash to support operations and meet financing obligations. This component is useful because it helps convert the model from an internal planning spreadsheet into a more professional funding tool. It allows users to explain how much capital is needed, how the money may be used, when the business expects to generate cash, and whether projected performance can support loan repayment or investor expectations.
Revenue Breakdown
The revenue breakdown component provides a more detailed view of how total revenue is generated across the biodiesel manufacturing business. Instead of showing only one total sales line, it separates income by stream so users can understand the contribution of different products and revenue sources. This may include biodiesel B100 sales, blended biodiesel products such as B20 and B5, glycerin byproduct sales, renewable fuel credits, and other related income sources where applicable.
Inputs may include units sold, pricing by product type, growth assumptions, market share expectations, plant utilization rates, and timing of credit sales. Outputs may include revenue by category, percentage contribution by revenue stream, year-over-year growth, average selling price, and the relationship between product mix and gross margin. This component is useful for planning because a biodiesel operation may look profitable overall while relying heavily on one volatile revenue driver. A detailed revenue breakdown helps users evaluate diversification, identify which streams deserve commercial focus, and test whether the business can remain attractive if one product line, byproduct market, or credit value changes.
KPI Dashboard
The KPI dashboard component helps users monitor the key performance indicators that matter most for a biodiesel manufacturing business. While financial statements are essential, operating and financial KPIs provide a faster way to understand business health, efficiency, and progress against targets. This section may track metrics such as revenue growth, gross margin, EBITDA margin, cash balance, feedstock cost as a percentage of revenue, payroll as a percentage of revenue, plant utilization, production volume, return on equity, payback period, and other benchmark-style indicators.
Inputs are pulled from the forecast assumptions and financial statements, allowing the KPIs to update as users revise pricing, costs, staffing, production volumes, and financing plans. Outputs help users compare performance across years, evaluate whether assumptions are reasonable, and identify where the business may need operational improvement. This component is useful for founders, management teams, investors, and consultants because it summarizes complex model outputs into practical decision-making metrics. It can also support ongoing performance reviews after launch by giving the business a consistent framework for comparing actual results against the original plan.
Startup Cost and Capital Expenditure Planning
The startup cost and capital expenditure planning component helps users estimate the upfront investment required to launch or expand a biodiesel manufacturing facility. A biodiesel plant may require major spending on processing equipment, reactors, storage tanks, pumps, quality control systems, site preparation, installation, permits, safety systems, engineering support, utilities, vehicles, office setup, and initial working capital.
This section allows users to itemize these startup costs and separate one-time investment needs from ongoing operating expenses. Inputs may include equipment costs, construction or retrofit costs, deposits, licensing fees, pre-opening payroll, initial inventory, professional fees, contingency amounts, and required cash reserves. Outputs may include total startup funding required, capital expenditure timing, depreciation assumptions, opening cash needs, and the amount of financing required before the business reaches stable operations. This component is especially useful because biodiesel manufacturing is capital intensive and underestimating launch costs can create serious cash flow pressure. A structured startup cost section helps users prepare more credible funding requests, compare facility scale options, and understand how initial investment affects returns, debt needs, and payback timing.
Break-Even and Cash Flow Forecasting
The break-even and cash flow forecasting component helps users understand when the biodiesel manufacturing business may begin covering its costs and whether it can maintain enough liquidity during startup and growth. Break-even analysis evaluates the relationship between revenue, variable costs, fixed operating expenses, payroll, and gross margin to estimate the level of sales or production needed to reach profitability. Cash flow forecasting then extends the analysis by showing the timing of cash inflows and outflows, including customer receipts, feedstock purchases, payroll, rent, utilities, taxes, capital expenditures, loan payments, and working capital needs.
Inputs may include sales timing, payment terms, inventory assumptions, cost structure, startup funding, debt financing, and operating expense schedules. Outputs may include monthly cash balances, cash shortfalls, break-even timing, funding gaps, operating cash flow, and cumulative cash movement. This component is useful for decision-making because a business can appear profitable on paper while still running out of cash if expenses occur before revenue is collected. For biodiesel manufacturing, where feedstock purchases, equipment investment, and operating costs can be significant, break-even and cash flow forecasting help users plan financing, manage liquidity, and make more confident launch or expansion decisions.
File types:
Excel – Single-User: .xlsx
Excel – Multi-User: .xlsx
Similar ProductsOther customers were also interested in...



 Pushkar
Hydrogen Gas Sales & Tolling Business Plan an...
Hydrogen Gas Sales & Tolling Fee business plan and valuation model is an excellent tool to asses... Read more

 Finmodelhub
Comprehensive 3 – Statement Financial Model ...
This is a 6,000bpd financial model for refinery producing Diesel and Jet Fuel. The Model is flexible... Read more
 HenrySheykin
Solar Panel Manufacturing Plant Business Plan Fina...
The Solar Panel Manufacturing Financial Model helps users turn a solar factory concept into a struct... Read more

Coal Mining Financial Model Excel Template
The Coal Mining Financial Model helps users turn a mining project concept, expansion plan, or invest... Read more

Metal Mining Business Financial Model Excel Templa...
The Metal Mining Financial Model Financial Model Template helps users turn a mining project concept ... Read more
Food Production Financial Model Excel Template
The Food Manufacturing Financial Model helps entrepreneurs, founders, consultants, analysts, and bus... Read more
Clothing Line Business Financial Model Excel Templ...
The Clothing Line Financial Model helps founders, apparel entrepreneurs, consultants, analysts, and ... Read more
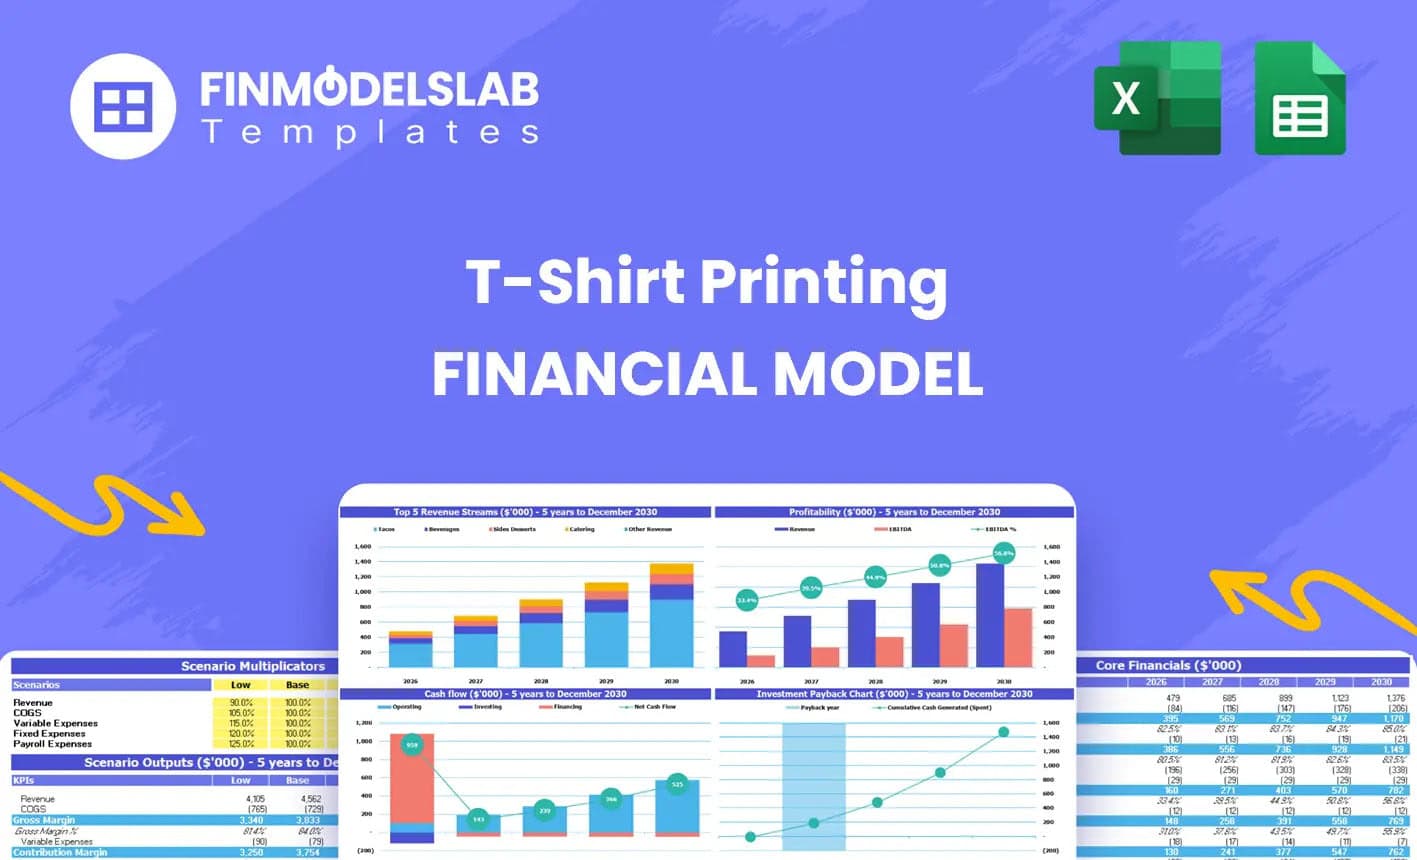
T-Shirt Printing Business Financial Model Excel Te...
The T-Shirt Printing Financial Model helps entrepreneurs, founders, business owners, consultants, an... Read more

Gold Mining Business Financial Model Excel Templat...
The Gold Mining Financial Model Financial Model Template helps users turn a gold mining project into... Read more
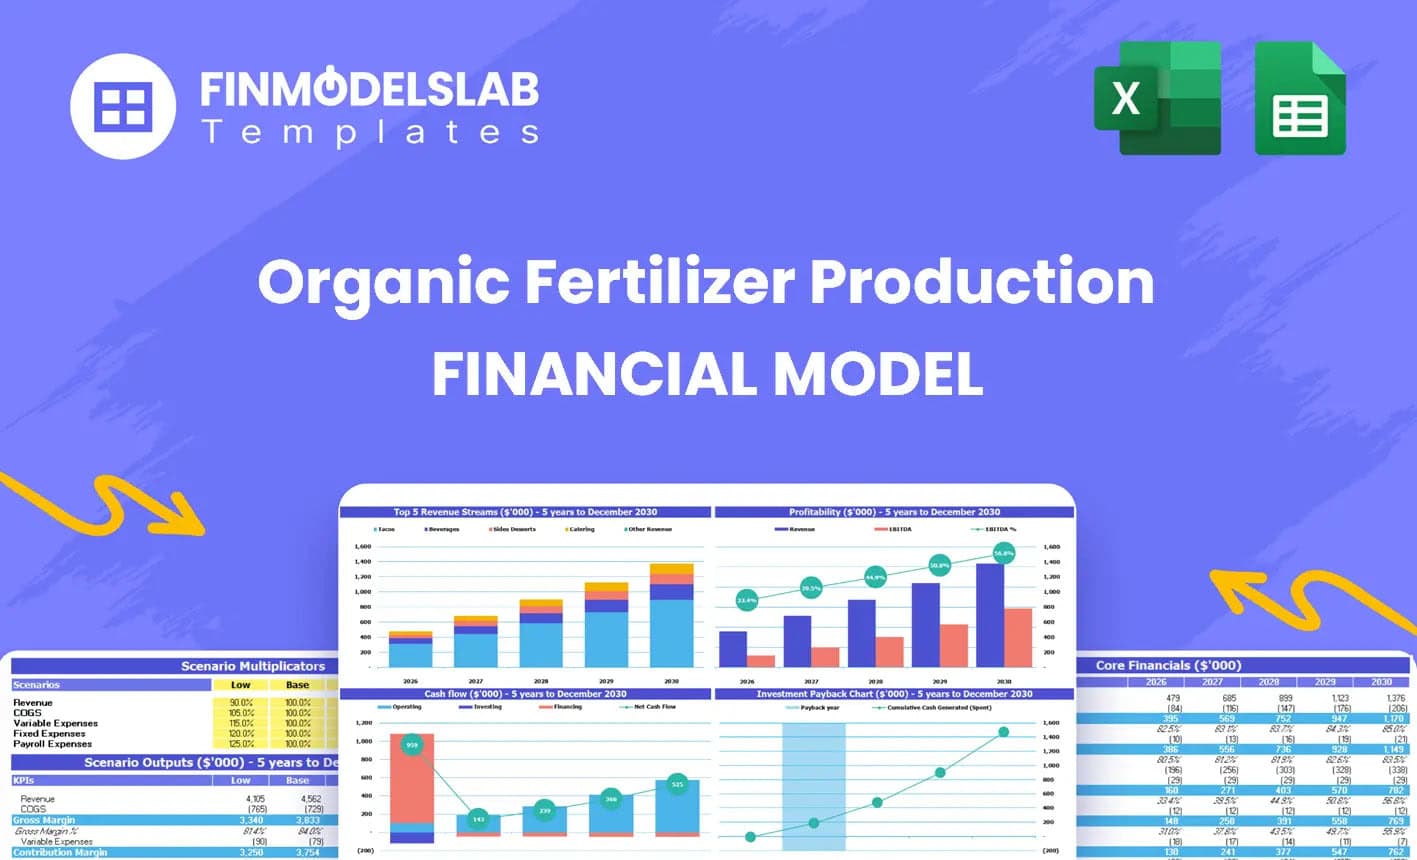
Organic Fertilizer Production Financial Model Exce...
The Organic Fertilizer Production Financial Model helps users turn a fertilizer plant concept into a... Read more
You must log in to submit a review.