
0 ITEMS

Skate Park Business Plan Financial Model Excel Template
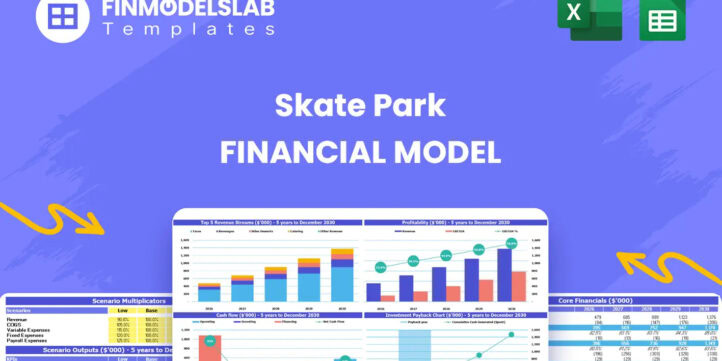
The Skate Park Financial Model helps entrepreneurs, founders, consultants, analysts, and business owners turn a skate park concept into a structured financial forecast. Instead of building a spreadsheet from scratch, users can start with a ready-to-use model designed around the key economics of an action sports facility, including daily pass sales, memberships, lessons, clinics, camps, events, pro shop activity, food and beverage revenue, startup investment, and ongoing operating costs. It gives buyers a practical way to organize assumptions, estimate financial performance, and prepare a more credible business plan or funding presentation. This financial model template is built for financial planning, investor discussions, lender review, internal budgeting, and day-to-day decision-making. Users can update revenue assumptions, pricing, visitor volume, membership levels, staffing needs, payroll, rent, utilities, insurance, marketing, maintenance, and other operating expenses to reflect their own location and business strategy. The model connects these assumptions to projected revenue, cost structure, cash flow, profitability, and long-term financial performance, helping users understand how each decision affects the overall economics of the skate park. The template is especially useful for evaluating whether a skate park can generate enough traffic, recurring membership revenue, and ancillary income to support fixed costs and growth plans. It helps users analyze startup costs, forecast monthly and annual cash flow, review profitability, estimate funding needs, and assess when the business may reach break-even. By viewing the business through multiple financial outputs, users can identify risks early, test planning assumptions, and make better decisions before committing capital, signing leases, hiring staff, or pitching investors. Designed to be editable and practical, the Skate Park Financial Model gives users a structured starting point while still allowing full customization. It can support new skate park launches, expansion planning, acquisition review, or consulting projects where a professional financial forecast is required. With organized assumptions, automated calculations, investor-ready outputs, and clear financial views, the template helps users save time, reduce guesswork, and communicate the financial potential of a skate park business with greater confidence.
| Entertainment, Financial Model, Online Businesses |
| 5-year Financial Projections, Excel, Financial Modeling, Pro-Forma, Startup Financial Models, Three Statement Model | Three Financial Statements |


Financial Model Overview
The Skate Park Financial Model is a ready-to-use financial model template built to help entrepreneurs, business owners, consultants, analysts, and founders evaluate the financial potential of a skate park business. A skate park has a unique mix of revenue drivers, including daily visitors, recurring memberships, lessons, camps, events, equipment rentals, retail sales, sponsorships, and food and beverage income, while also carrying meaningful startup costs, facility costs, staffing requirements, insurance, maintenance, and marketing expenses. This template brings those moving parts into one structured model so users can forecast revenue, costs, cash flow, profitability, funding needs, and long-term performance without starting from a blank spreadsheet. It is useful for business planning, investor presentations, lender discussions, internal budgeting, and strategic decision-making before launch or expansion.
All-in-one Dashboard
The all-in-one dashboard gives users a centralized view of the most important inputs and outputs in the Skate Park Financial Model. Instead of searching through multiple tabs to understand performance, users can review core assumptions, revenue expectations, major cost categories, cash flow indicators, profitability results, and key return metrics from one organized area. Inputs may include pricing, visitor volume, membership counts, operating expense assumptions, payroll levels, capital investment, and financing structure. Outputs may include revenue growth, EBITDA, net income, cash balance, margins, payback period, and other summary results that matter to founders, lenders, and investors. This component is useful because it turns a detailed financial model into a practical management tool, allowing users to quickly see whether the skate park is financially viable, where the biggest risks sit, and which assumptions deserve closer review before making operational or funding decisions.
Low, Base, and High Scenario Analysis
The low, base, and high scenario analysis component helps users test how the skate park may perform under different business conditions. A single forecast can create false confidence, especially for a recreational facility where revenue may depend on local demand, weather patterns, seasonality, membership conversion, event bookings, school schedules, and community engagement. This section allows users to compare a conservative case, a realistic planning case, and an optimistic growth case by adjusting assumptions such as daily pass traffic, membership adoption, lesson participation, event frequency, retail conversion, pricing, payroll efficiency, and expense growth. The outputs can show how each scenario affects revenue, profit margins, cash flow, break-even timing, and funding requirements. This is especially useful for decision-making because it helps users prepare contingency plans, set realistic operating targets, understand downside risk, and communicate a balanced financial story to investors or lenders rather than relying on only one version of the future.
Professional Charts
The professional charts component converts financial outputs into clear visual reports that are easier to understand and present. Skate park financial planning often involves many linked assumptions, and charts help summarize the model’s results for people who do not want to review every calculation line by line. This section may visualize revenue trends, expense behavior, profitability growth, cash flow movement, margin development, funding requirements, and performance by year. It can also help show the relationship between visitor growth, membership revenue, operating leverage, and profit improvement over time. These charts are useful for investor decks, lender meetings, internal planning sessions, and management reviews because they make the forecast easier to explain. Rather than presenting only rows of numbers, users can show how the business is expected to grow, where costs are concentrated, and when cash generation improves. This supports clearer communication and helps stakeholders focus on the financial story behind the model.
ROE Components and DuPont Analysis
The ROE components and DuPont analysis section helps users understand the drivers behind return on equity rather than looking at a single return figure in isolation. For a skate park business, return on equity can be affected by profitability, asset efficiency, and financial leverage, so this component breaks performance into more meaningful parts. Inputs and outputs may include net income, revenue, total assets, equity, margins, asset turnover, leverage ratios, and resulting return on equity. This analysis is useful because it helps founders and investors see whether returns are being driven by healthy operating profit, efficient use of facility assets, or reliance on financing structure. A skate park may require meaningful upfront investment in ramps, surfaces, rental equipment, fixtures, and buildout, so understanding how those assets generate revenue matters. This component supports better capital planning, investor discussions, and strategic decision-making by showing how operational improvements, pricing changes, asset utilization, and funding choices can influence shareholder returns over time.
Revenue Inputs
The revenue inputs section is where users define the commercial assumptions that drive the Skate Park Financial Model. A skate park can generate income from several sources, and this component allows users to update the assumptions that match their own operating plan. Inputs may include daily pass price, projected visitor volume, monthly or annual membership pricing, number of members, lesson and clinic participation, camp enrollment, private event bookings, pro shop sales, rental equipment income, food and beverage sales, sponsorship income, and seasonal growth patterns. These assumptions feed directly into the revenue forecast and help calculate monthly and annual sales projections. This section is useful because revenue is one of the most sensitive areas of the model. By changing traffic, pricing, conversion rates, or participation levels, users can immediately see how the business case changes. It also helps users move from broad market opportunity to practical revenue planning based on measurable operating drivers.
Bank-Ready Reports
The bank-ready reports component organizes the model’s outputs into professional financial statements and lender-friendly summaries. When seeking financing for a skate park, banks and other capital providers typically want to see structured forecasts, clear assumptions, projected profit and loss statements, cash flow projections, balance sheet outputs, debt capacity, and repayment ability. This section helps users present those outputs in a clean and understandable format. Inputs from the broader model, including revenue, operating expenses, payroll, capital expenditures, financing assumptions, and taxes, flow into reports that can support loan applications, investor packages, and business plan documentation. The value of this component is that it helps users move beyond informal estimates and present a more disciplined financial case. It can support discussions around startup funding, working capital, equipment financing, buildout costs, and long-term repayment capacity, making the Skate Park Financial Model more useful for real funding conversations.
Revenue Breakdown
The revenue breakdown component gives users a detailed view of each income stream inside the skate park business. Instead of showing only total revenue, it separates income by category so users can understand which activities contribute most to sales and profitability. Revenue streams may include daily admission, recurring memberships, lessons, clinics, youth camps, private events, birthday parties, competitions, retail merchandise, equipment rentals, food and beverage sales, sponsorships, and other ancillary services. This view is useful because a skate park’s financial performance often depends on more than visitor count alone. High-margin services such as memberships, lessons, events, or sponsorships may have a different impact than retail or food sales. By reviewing the revenue mix, users can identify which areas deserve more marketing attention, where pricing can be optimized, and how operational capacity should be allocated. This component also helps users explain the business model clearly to stakeholders and build a more defensible forecast.
KPI Dashboard
The KPI dashboard tracks performance metrics that help users evaluate whether the skate park is operating in line with plan. Key performance indicators may include total visitors, average revenue per visitor, membership count, membership conversion rate, lesson participation, event bookings, revenue per square foot, gross margin, EBITDA margin, payroll as a percentage of revenue, cash runway, and return metrics. Users can compare these indicators against their assumptions, targets, and available benchmarks to understand where the business is performing well and where adjustments may be needed. This component is useful for both pre-launch planning and ongoing management because it translates financial data into actionable operating measures. For example, if revenue is below forecast, the KPI view can help determine whether the issue is traffic, pricing, conversion, ancillary sales, or retention. For investors and lenders, the KPI dashboard also demonstrates that the business is being measured through practical performance drivers rather than only high-level accounting outputs.
Startup Costs and Capital Requirements
The startup costs and capital requirements section helps users estimate the initial investment needed to open or expand a skate park. This component may include ramp and obstacle construction, skate surface installation, facility buildout, safety equipment, rental gear, point-of-sale systems, pro shop inventory, furniture, signage, permits, licenses, deposits, pre-opening payroll, insurance, marketing launch costs, and opening working capital. These inputs help calculate how much funding may be required before the park begins generating revenue. The outputs can support fundraising targets, loan requests, investor contributions, and budget control during the pre-opening period. This section is important because skate parks can require substantial upfront investment, and underestimating buildout or equipment costs can create cash pressure before operations stabilize. By organizing startup costs in a structured format, the model helps users plan capital needs more accurately, compare funding options, prioritize spending, and avoid relying on vague estimates when preparing a business plan or funding proposal.
Break-Even Analysis
The break-even analysis component helps users identify the point at which the skate park can cover its fixed and variable costs and begin generating profit. Inputs may include pricing, visitor volume, membership revenue, average spending per customer, gross margin, payroll, rent, utilities, insurance, marketing, maintenance, and other operating expenses. The model can use these assumptions to estimate the level of revenue, visitor traffic, memberships, or monthly sales needed to reach break-even. This is especially valuable for a skate park because management needs to understand how many customers or recurring members are required to support the facility’s cost base. Break-even analysis supports pricing decisions, membership campaigns, marketing budgets, staffing plans, and launch targets. It also gives investors and lenders a practical way to evaluate risk by showing how much room exists between expected performance and the minimum required performance. With this component, users can make more informed decisions about launch timing, promotions, cost control, and growth priorities.
File types:
Excel – Single-User: .xlsx
Excel – Multi-User: .xlsx
Similar ProductsOther customers were also interested in...


 HenrySheykin
Theme Park Business Plan Financial Model Excel Tem...
The Theme Park Financial Model helps entrepreneurs, developers, operators, consultants, analysts, an... Read more

Arcade Business Plan Financial Model Excel Templat...
The Arcade Financial Model helps users turn an arcade, game room, or family entertainment center con... Read more

Online Clothing Store Financial Model Excel Templa...
The Online Clothing Store Financial Model helps founders, entrepreneurs, business owners, consultant... Read more
Monthly Recurring Revenue SaaS Financial Model Exc...
The SaaS Business Financial Model helps founders, entrepreneurs, consultants, analysts, and business... Read more
E-com Simple Financial Model Excel Template
The E-Commerce Business Financial Model Template helps founders, online store owners, consultants, a... Read more
SaaS Freemium Financial Model Excel Template
The SaaS Business Financial Model helps founders, entrepreneurs, consultants, analysts, and business... Read more
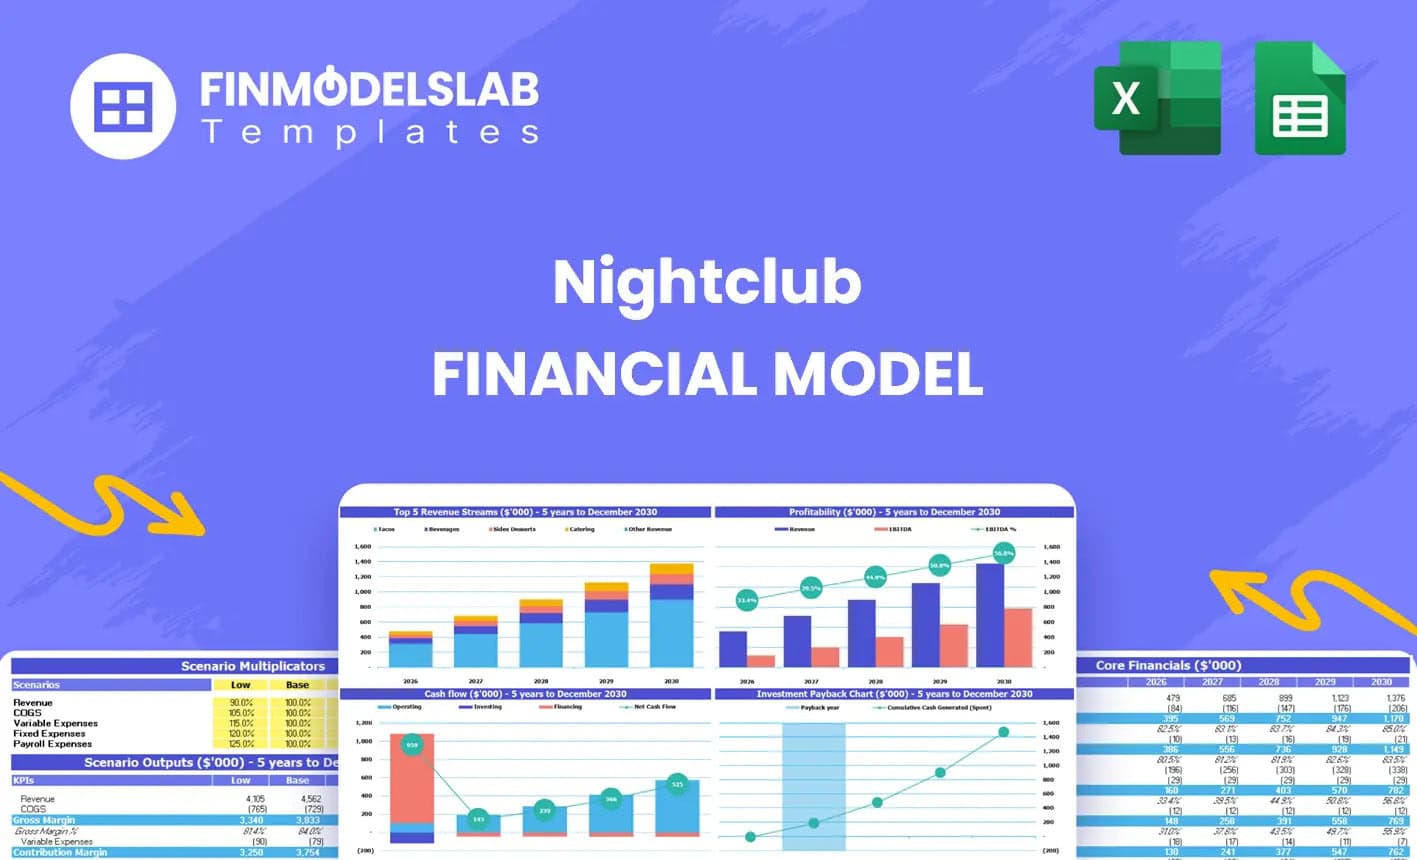
Nightclub Financial Model Excel Template
The Nightclub Financial Model helps users turn a nightlife business concept into a structured financ... Read more
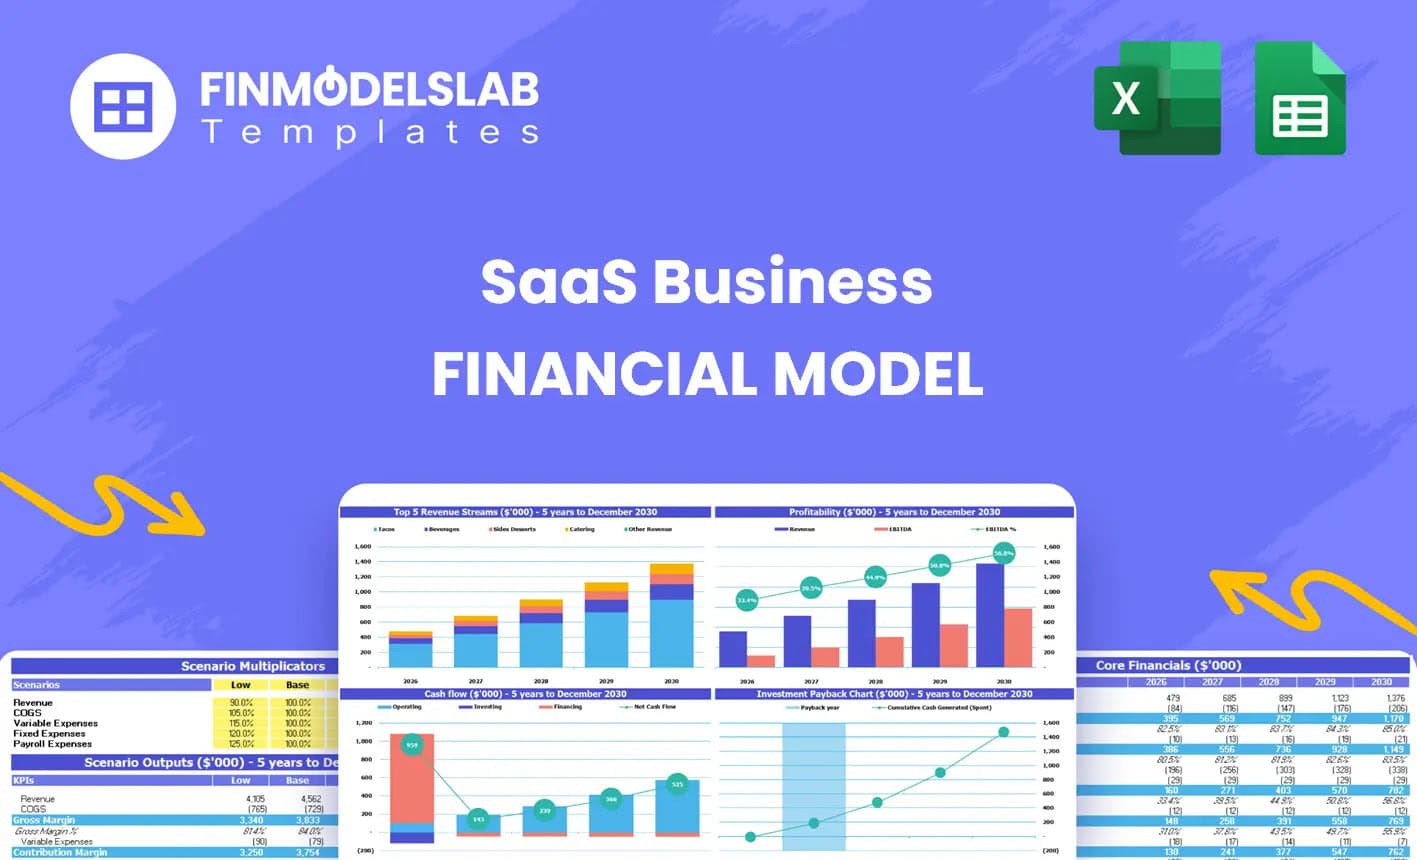
SaaS Actuals Opt-In Financial Model Excel Template
The SaaS Business Financial Model helps founders, entrepreneurs, consultants, analysts, and business... Read more
SaaS Application Freetrial Financial Model Excel T...
The SaaS Business Financial Model helps founders, entrepreneurs, consultants, analysts, and business... Read more

Medical Tourism Financial Model Excel Template
The Medical Tourism Financial Model Template helps users turn a cross-border healthcare business ide... Read more
You must log in to submit a review.