
0 ITEMS

Candle Making Business Plan Financial Model Excel Template
The Candle Making Business Financial Model helps entrepreneurs, founders, business owners, consultants, and analysts turn a candle brand concept into a structured five-year financial forecast. Instead of building a spreadsheet from scratch, users can work from a ready-to-use model designed around the economics of an artisan candle business, including product sales, pricing assumptions, raw material costs, operating expenses, payroll, cash flow, profitability, and funding needs. It gives users a practical way to organize assumptions, estimate startup costs, and understand whether the business can support its planned growth. This financial model template is useful for people launching a handmade candle company, expanding an existing home fragrance brand, preparing a business plan, or building investor and lender materials. It allows users to adjust revenue assumptions for different product lines, test pricing strategies, forecast production costs, and plan the level of staffing, marketing, inventory, and working capital required to operate effectively. By connecting sales volume, average pricing, cost of goods sold, payroll, and overhead in one model, it helps users see how individual decisions affect cash flow and profitability over time. The template is designed to support clear decision-making before and after launch. Users can review projected profit and loss, cash flow, financial statements, key performance indicators, charts, scenario analysis, return metrics, and break-even analysis in a format that is organized and presentation-ready. This makes it easier to understand how much initial capital may be required, when the business may become profitable, how cash balances may change month by month, and which assumptions have the greatest impact on financial performance. Built for Excel and Google Sheets, the Candle Making Business Financial Model is fully editable and suitable for both non-financial users and experienced planners. Entrepreneurs can use it to validate a new candle business idea, consultants can customize it for client projects, and founders can share outputs with investors, banks, partners, or internal teams. The result is a practical financial planning tool that helps replace guesswork with structured projections, allowing users to plan revenue, manage expenses, evaluate profitability, and make more confident business decisions.
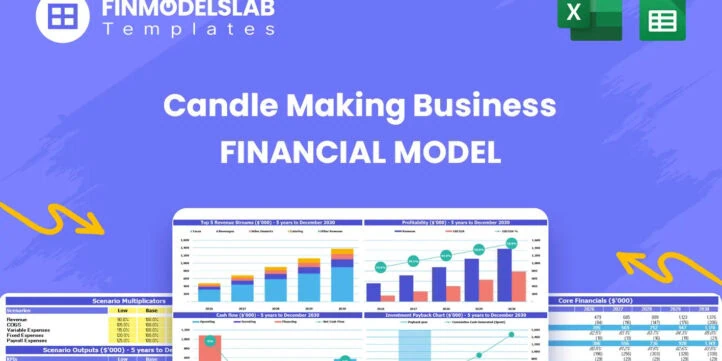


Financial Model Overview
The Candle Making Business Financial Model is a ready-to-use financial model template created for entrepreneurs, founders, consultants, analysts, and business owners planning or growing a candle making business. It gives users a structured way to forecast revenue, costs, cash flow, profit, and investment needs for an artisan candle brand, home fragrance company, or handmade product business. The model is designed around practical business drivers such as product lines, unit sales, pricing, material costs, staffing, operating expenses, and capital requirements. By bringing these assumptions into one connected forecast, the template helps users evaluate whether their candle business can reach sustainable profitability, maintain healthy cash flow, and support growth over a five-year planning period. It is especially useful for business plans, funding discussions, internal budgeting, investor presentations, bank submissions, and strategic decision-making because it turns raw assumptions into organized financial outputs that can be reviewed, edited, and shared.
All-in-One Dashboard
The all-in-one dashboard brings the core inputs and core outputs of the Candle Making Business Financial Model into one central view, giving users a quick way to understand the overall financial position of the business. This section typically connects high-level assumptions such as sales volume, pricing, product mix, expenses, startup investment, and financing with key outputs such as revenue, gross profit, EBITDA, net income, cash balance, return metrics, and major financial trends. For a candle making business, this is valuable because owners need to monitor multiple moving parts at once, including wax and fragrance costs, packaging, direct-to-consumer sales, wholesale demand, production capacity, and marketing spend. The dashboard helps users avoid getting lost in individual tabs by showing the overall story of the model in one place. It is useful for quick reviews before meetings, comparing changes after updating assumptions, and communicating the financial potential of the business to lenders, investors, advisors, or internal partners.
Low, Base, and High Scenario Analysis
The low, base, and high scenario analysis component helps users test how the candle making business may perform under different market conditions and operating assumptions. Instead of relying on a single forecast, users can compare conservative, expected, and optimistic outcomes by adjusting key drivers such as unit sales, average selling price, raw material costs, marketing efficiency, wholesale penetration, online conversion rates, or production volume. A low case may reflect slower sales growth, higher material costs, or weaker demand for seasonal collections, while a high case may reflect successful product launches, strong repeat purchases, improved margins, or expanded retail partnerships. The outputs help users understand how changes in assumptions affect revenue, cash flow, profitability, and funding requirements. This is especially important for business planning and risk management because a candle business may be affected by seasonality, consumer trends, supply costs, and marketing performance. Scenario analysis supports better decision-making by showing which assumptions are most important and how resilient the business may be under pressure.
Professional Charts
The professional charts component translates financial data into clear visual reports that are easier to understand and present. Instead of reviewing only rows of numbers, users can see revenue growth, expense trends, profit margins, cash flow movement, EBITDA, break-even timing, and other key financial outputs through charts and graphs. For a candle making business, visual reporting is helpful because the financial story often includes product-line growth, scaling production, improving margins, managing seasonal demand, and building brand momentum over time. Charts can make it easier to explain how revenue expands from core products such as classic soy candles into higher-margin collections, reed diffusers, room sprays, wax melts, or other home fragrance items. They are also valuable for investor decks, bank meetings, internal reviews, and business plan appendices because they simplify complex projections into presentation-ready visuals. This component helps users communicate trends, identify potential issues faster, and make financial performance more accessible to stakeholders who may not want to study a full spreadsheet in detail.
ROE Components and DuPont Analysis
The ROE components and DuPont analysis section helps users evaluate the drivers behind return on equity and overall financial efficiency. Rather than looking only at the final return figure, this component breaks performance into underlying factors such as profitability, asset efficiency, and leverage. For a candle making business, this can help users understand whether strong returns are being created by healthy margins, efficient use of equipment and working capital, effective inventory management, or the way the business is financed. Inputs may include net income, equity, assets, sales, cost structure, and balance sheet assumptions, while outputs may include return on equity, margin ratios, turnover measures, and leverage-related insights. This section is particularly useful for founders and investors who want to evaluate how effectively the business converts capital into value. It also supports strategic planning by showing whether improvements should come from raising prices, reducing production waste, improving inventory turns, increasing direct-to-consumer sales, or changing the capital structure.
Revenue Inputs
The revenue inputs section allows users to define the commercial assumptions that drive the sales forecast for the candle making business. This component may include product categories, unit sales, pricing, annual growth rates, seasonal patterns, sales channels, and assumptions for different product lines such as classic soy candles, premium collections, reed diffusers, room sprays, and wax melt sets. By entering realistic volume and price assumptions, users can estimate total revenue by month and year, test the impact of slight annual price increases, and understand how the business grows as customer demand expands. This section is one of the most important parts of the financial model because revenue assumptions affect nearly every other output, including cost of goods sold, gross margin, payroll needs, inventory planning, cash flow, and profitability. It is useful for founders refining their product strategy, consultants preparing a forecast for a client, and business owners deciding whether to focus on direct online sales, markets, wholesale accounts, subscription boxes, or premium collections.
Bank-Ready Reports
The bank-ready reports component organizes the financial outputs into lender-friendly statements and summaries that can support funding applications, loan discussions, and professional business planning. This section may include projected profit and loss statements, cash flow statements, balance sheets, revenue summaries, expense summaries, profitability metrics, funding needs, and other standard outputs that banks and investors typically expect to review. For a candle making business, these reports help show whether the company can generate enough sales, maintain adequate margins, cover operating expenses, repay debt, and preserve a stable cash position. The value of this component is that it converts assumptions into a format that is easier for external stakeholders to evaluate. A founder can use it to support a small business loan request, equipment financing application, working capital facility, or investor conversation. Because the reports are connected to the rest of the model, changes to assumptions such as pricing, staffing, material costs, or sales volume automatically flow through to the financial statements, saving time and reducing manual errors.
Revenue Breakdown
The revenue breakdown component provides a detailed view of how different products and revenue streams contribute to total sales. For a candle making business, this may separate revenue from classic candle lines, premium scented collections, reed diffusers, room sprays, wax melts, gift sets, wholesale orders, online sales, pop-up markets, or other channels depending on how the user customizes the model. This section helps users see which products generate the largest share of revenue, which lines may carry stronger margins, and how the business could evolve as it expands beyond its initial core offering. Inputs may include unit volumes, average prices, product launch timing, channel mix, and growth rates, while outputs may include product-level sales, revenue share, year-over-year growth, and total forecasted income. This is useful for decision-making because not all candle products perform the same financially. A premium collection may sell fewer units but generate stronger margins, while a lower-priced product may create higher volume and brand awareness. The revenue breakdown helps users plan inventory, marketing priorities, product development, and sales strategy with greater clarity.
KPI Dashboard
The KPI dashboard focuses on performance metrics and benchmarks that help users monitor the health of the candle making business over time. This component may track metrics such as revenue growth, gross margin, EBITDA margin, net profit margin, cash balance, customer or order-related assumptions, cost of goods sold percentage, payroll as a percentage of revenue, operating expense ratios, return metrics, and other indicators relevant to the model. For a handmade candle company, KPI tracking is important because profitability depends on managing material costs, pricing correctly, scaling production efficiently, and controlling overhead while building demand. The dashboard allows users to compare projected performance against internal goals or industry benchmarks and identify areas that may need attention. If margins decline, users can revisit wax, fragrance oil, packaging, labor, or shipping assumptions. If revenue growth is strong but cash flow is weak, they can examine inventory, payment timing, or working capital needs. This section supports ongoing planning, performance review, and stakeholder communication by summarizing the financial model into practical measures that guide action.
Startup Cost Breakdown
The startup cost breakdown section helps users estimate the initial investment required to launch or prepare the candle making business for operations. This component may include wax melters, pouring equipment, molds, thermometers, scales, storage racks, fragrance testing supplies, safety equipment, initial raw materials, packaging, labels, brand design, e-commerce website development, workshop setup, leasehold improvements, deposits, licenses, launch marketing, photography, and beginning working capital. Separating one-time startup costs from ongoing operating expenses is essential because it helps users understand how much funding is needed before the business can begin generating consistent revenue. The outputs may include total launch investment, category-level cost summaries, required owner contribution, financing needs, and early cash requirements. This section is useful for entrepreneurs preparing a budget, lenders evaluating a loan request, or founders deciding whether to start from a home studio, small workshop, or larger production space. It also helps users avoid underestimating the cash needed to buy equipment, build inventory, set up sales channels, and support operations during the first months of trading.
Break-Even Analysis
The break-even analysis section helps users identify when the candle making business may become profitable and what level of sales is required to cover costs. This component typically uses assumptions such as average selling price, gross margin, variable production costs, fixed operating expenses, payroll, rent, marketing, and other overhead to estimate the point where revenue equals total costs. For a candle business, this is especially useful because owners need to understand how many units must be sold each month to cover wax, fragrance oils, vessels, packaging, labor, website costs, rent, marketing, and administrative expenses. The outputs may show break-even timing, break-even revenue, break-even unit volume, margin of safety, and the effect of changes in pricing or costs. This helps users make practical decisions about pricing, product mix, launch volume, staffing, and promotional strategy. It is also valuable for investor and lender discussions because it shows whether the business has a clear path to profitability and how quickly initial costs may be recovered under the forecast assumptions.
File types:
Excel – Single-User: .xlsx
Excel – Multi-User: .xlsx
Free Demo – .xlsx
Similar ProductsOther customers were also interested in...



 HenrySheykin
Clothing Line Business Financial Model Excel Templ...
The Clothing Line Financial Model helps founders, apparel entrepreneurs, consultants, analysts, and ... Read more
Clothing Manufacturing Business Plan Financial Mod...
The Clothing Manufacturing Financial Model helps users turn a garment production concept into a stru... Read more
 Giorgos
Fashion Designer (Independent) – 5 Year Financia...
Financial Model providing a highly sophisticated 5-year financial plan for a startup Independent Fas... Read more
 Peter Graf
Product Dealer Startup – The Customer Centri...
With this financial model, you can create a financial plan for the startup of your product dealershi... Read more
 anthony
Bundle – Business Financial Forecasting Mode...
The purpose of this Bundle of Business Forecasting and Financial Models is to assist Business Owners... Read more
 JILL LIU
Ultra Fashion Revenue and DCF Valuation Model
In this model, we presented a completed revenue and DCF valuation model for an Ultra-Fashion project... Read more
 Excel Business Resou...
CBD Personal Care Financial Model and Valuation Te...
CBD Personal Care Financial Model and Valuation Template, a comprehensive solution tailored for entr... Read more
Grocery Store Financial Model Excel Template
The Grocery Store Financial Model helps entrepreneurs, founders, consultants, analysts, and retail b... Read more
Coffee Shop Financial Model Excel Template
The Coffee Shop Financial Model helps entrepreneurs, founders, business owners, consultants, and ana... Read more
You must log in to submit a review.