
0 ITEMS

Waterpark Business Plan Financial Model Excel Template
The Water Park Financial Model helps entrepreneurs, founders, consultants, analysts, and business owners turn a complex leisure and recreation concept into a structured financial forecast. Instead of starting with a blank spreadsheet, users get a ready-to-use financial model template designed around the economics of a water park, including ticket sales, season passes, group bookings, food and beverage, merchandise, rentals, staffing, utilities, maintenance, capital investment, and operating expenses. It supports financial planning for new developments, expansion projects, investor presentations, bank discussions, feasibility studies, and internal decision-making. This template is built to help users understand how revenue assumptions, customer volume, pricing, startup costs, payroll, and operating costs affect long-term performance. Water parks are capital-intensive businesses with seasonal demand patterns, large construction requirements, and multiple revenue streams, so a structured model is essential for testing whether the project can generate sufficient cash flow and profitability. The model allows users to adjust assumptions, compare scenarios, review revenue potential, estimate cost behavior, evaluate margins, and understand the timing of cash inflows and outflows before committing major resources. The Water Park Financial Model is also useful for preparing business plans and funding documents because it organizes the core financial logic investors and lenders expect to see. Users can review five-year projections, break-even analysis, profitability trends, return metrics, and cash flow needs in a professional format. The model helps clarify how much capital may be required, when the business may become operationally profitable, and which assumptions have the biggest impact on financial outcomes. This makes it easier to communicate the opportunity, support funding requests, and make more informed strategic decisions. Because the template is editable and compatible with Microsoft Excel and Google Sheets, it can be adapted to different park sizes, pricing strategies, attendance forecasts, construction budgets, staffing plans, and market conditions. Whether you are planning a standalone water park, an attraction within a larger resort, or an expansion of an existing recreation facility, the model provides a practical framework for forecasting revenue, controlling expenses, monitoring cash flow, and evaluating sustainable profitability.
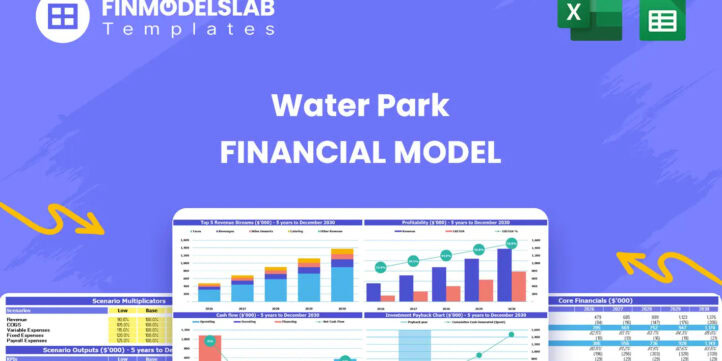


Financial Model Overview
The Water Park Financial Model is a ready-to-use financial model template created for planning, evaluating, and presenting the financial outlook of a water park business. A water park requires careful financial planning because the business usually combines high upfront capital investment, multiple revenue streams, seasonal demand, substantial staffing needs, utilities, maintenance, insurance, and ongoing reinvestment in attractions and guest experience. This template brings those moving parts into one structured model so entrepreneurs, business owners, consultants, analysts, and founders can build a more credible forecast without creating a complex workbook from scratch. Users can customize assumptions for visitor volume, ticket pricing, season passes, group bookings, food and beverage sales, merchandise, rentals, payroll, operating expenses, startup costs, and financing needs. The model is useful for business plans, investor presentations, lender discussions, feasibility studies, expansion planning, and internal decision-making because it connects the operational assumptions of a water park with projected revenue, profit, cash flow, break-even timing, and return metrics over a multi-year period.
All-in-One Dashboard
The all-in-one dashboard gives users a centralized view of the most important inputs and outputs in the Water Park Financial Model. Instead of moving through separate tabs to understand the business outlook, users can quickly review the key assumptions driving the forecast and see how those assumptions affect projected revenue, expenses, profitability, cash flow, and investment performance. This component may include editable inputs such as opening timeline, visitor counts, ticket prices, season pass assumptions, group booking volumes, ancillary spending, operating cost percentages, payroll assumptions, and capital investment timing. It then summarizes the outputs that matter most to stakeholders, including total revenue, EBITDA, net income, cash balance, funding needs, margins, and return indicators. For a water park project, this dashboard is especially useful because decision-makers need to understand the relationship between large startup costs and future operating performance. It supports faster planning conversations, helps users identify assumptions that require more research, and provides a professional summary for founders, investors, lenders, and internal teams.
Low, Base, and High Scenario Analysis
The low, base, and high scenario analysis component helps users stress-test the Water Park Financial Model under different operating and market conditions. A water park forecast can change significantly based on visitor volume, weather conditions, tourism demand, local competition, pricing power, construction costs, utility inflation, and staffing requirements. This section allows users to compare a conservative case, a realistic planning case, and an upside case by adjusting the most important drivers of performance. Inputs may include attendance growth, average ticket price, season pass adoption, group booking demand, guest spending on food and beverage, merchandise sales, rental income, cost inflation, labor costs, and capital expenditure levels. The outputs help show how each scenario affects total revenue, operating profit, cash flow, break-even timing, and investor returns. This component is useful for planning because it makes risk more visible and gives users a practical way to prepare contingency plans. It also strengthens investor and lender presentations by showing that management has considered downside risk, base-case execution, and upside potential rather than relying on a single forecast.
Professional Charts
The professional charts component translates the financial forecast into clear visual reports that are easier to interpret and present. Water park financial projections often include many detailed assumptions, but investors, lenders, and management teams usually need quick visual summaries to understand trends and compare outcomes. This section may include charts for revenue growth, revenue by stream, EBITDA progression, net profit, cash balance, expense structure, funding needs, visitor volume, margin development, and scenario comparisons. The inputs are drawn from the model’s forecast assumptions and financial statements, while the outputs are presentation-ready visuals that summarize the story behind the numbers. For a water park business plan, these charts are valuable because they help explain how ticket revenue, season pass sales, group bookings, food and beverage, merchandise, and rentals contribute to growth over time. They also help communicate whether the business can absorb high construction costs, manage operating expenses, and move toward sustainable profitability. This component supports pitch decks, lender packages, board updates, feasibility reviews, and internal strategy sessions by making complex financial data more accessible.
ROE Components and DuPont Analysis
The ROE components and DuPont analysis section helps users evaluate the drivers behind return on equity rather than looking at a single return figure in isolation. For a capital-intensive water park project, return metrics are important because investors want to know whether the business can generate enough profit relative to the equity invested. This component breaks return on equity into underlying factors such as profit margin, asset utilization, and financial leverage, helping users understand whether performance is being driven by operating profitability, efficient use of assets, or financing structure. Inputs may include net income, revenue, total assets, equity, debt levels, interest expense, and balance sheet assumptions. Outputs may include return on equity, net profit margin, asset turnover, equity multiplier, and related performance ratios. This section is useful because a water park may show strong operating profit while still requiring a long payback period due to large land, construction, attraction, pool, and filtration system costs. By showing the components of return, the model helps users make better decisions about pricing, operating efficiency, capital allocation, financing mix, and investor expectations.
Revenue Inputs
The revenue inputs section is where users define the commercial assumptions that drive the Water Park Financial Model. A water park usually earns income from several connected sources, and each source depends on different planning assumptions. This component may include inputs for day pass visitors, season pass holders, group and corporate bookings, average ticket price, discounts, attendance growth, operating season, visitor mix, food and beverage spending per guest, merchandise sales, locker or cabana rentals, equipment rentals, event income, and other ancillary revenue categories. The outputs generated from these assumptions feed directly into the revenue forecast, monthly sales projections, annual income summaries, cash flow planning, and profitability analysis. This section is useful because small changes in attendance, pricing, or in-park spending can materially change the financial outlook of a water park. By organizing the assumptions in one place, the model gives users a practical way to test pricing strategies, evaluate marketing targets, plan capacity utilization, estimate peak-season revenue, and compare different revenue models. It also helps ensure that the forecast is based on visible business drivers rather than unsupported top-line estimates.
Bank-Ready Reports
The bank-ready reports component organizes the financial model into lender-friendly outputs that can support funding discussions, loan applications, and credit review processes. Water park projects often require substantial financing for land acquisition, construction, water slides, pools, filtration systems, safety infrastructure, facilities, pre-opening expenses, and working capital. Lenders need to see whether the business can generate enough cash flow to service debt while maintaining adequate liquidity. This component may include projected profit and loss statements, cash flow forecasts, balance sheets, debt schedules, interest expense calculations, repayment assumptions, funding requirements, and summary financial metrics. The outputs help show revenue growth, operating expenses, EBITDA, net income, cash balances, debt repayment capacity, and financial stability over time. For users preparing a water park business plan, this section is valuable because it presents the forecast in a structured format that is easier for banks, credit committees, and financial partners to review. It also helps users identify funding gaps, understand the timing of capital requirements, and prepare a more disciplined financing strategy before approaching lenders.
Revenue Breakdown
The revenue breakdown section gives users a detailed view of how each income stream contributes to total water park revenue. Rather than showing only one total sales number, this component separates revenue into categories such as day pass sales, season pass sales, group and corporate bookings, food and beverage, merchandise, rentals, events, premium seating, cabanas, lockers, or other park-specific revenue lines. Inputs may include visitor counts, conversion rates, average spend per guest, ticket prices, usage rates, seasonal assumptions, and growth rates. Outputs may include revenue by stream, percentage contribution to total revenue, monthly and annual revenue summaries, and comparisons across forecast years. This level of detail is important because water parks often depend on both admission revenue and ancillary in-park spending to achieve attractive margins. The section helps users understand which revenue streams are most important, which areas may need stronger marketing, and where operational improvements could increase profitability. It also supports investor and management discussions by showing the logic behind the sales forecast and helping users evaluate whether revenue expectations are realistic based on attendance, pricing, and guest behavior.
KPI Dashboard
The KPI dashboard component tracks the financial and operational performance metrics that matter most for a water park business. While financial statements are essential, key performance indicators help users understand whether the underlying business is operating efficiently. This section may include metrics such as total visitors, revenue per visitor, average ticket price, ancillary spend per visitor, EBITDA margin, gross margin, operating expense ratio, payroll as a percentage of revenue, utilities as a percentage of revenue, maintenance costs, cash balance, return on equity, and other benchmark-oriented ratios. Inputs are pulled from the model’s revenue, expense, staffing, and financial statement assumptions, while outputs provide a concise view of business health and performance trends. This component is useful for planning because it helps users compare projected results against internal targets or industry benchmarks. For example, if revenue grows but revenue per visitor declines, the user can investigate pricing, mix, or ancillary spending assumptions. If EBITDA margin weakens, the user can review staffing, utilities, maintenance, or marketing costs. The KPI dashboard helps turn the model into a management tool, not just a one-time funding document.
Break-Even Analysis
The break-even analysis section helps users identify when the water park can cover its operating costs and begin generating profit under the assumptions in the model. For a business with high fixed expenses, seasonal demand, and significant pre-opening investment, break-even timing is one of the most important planning questions. This component may use inputs such as fixed operating expenses, variable costs, payroll, utilities, maintenance, insurance, marketing, ticket revenue, ancillary revenue, average revenue per visitor, and contribution margin. The outputs may include break-even month, required visitor volume, required revenue level, margin of safety, and comparisons between low, base, and high scenarios. This section is useful because it helps users determine whether the park’s attendance targets and pricing strategy are sufficient to support the cost structure. It also helps management evaluate ways to reach break-even sooner, such as improving pre-opening sales, increasing group bookings, optimizing staffing, raising ancillary spending, or controlling variable costs. For investors and lenders, break-even analysis provides a clear view of execution risk and shows how quickly the business may become self-supporting after launch.
Startup Costs and Funding Requirements
The startup costs and funding requirements section helps users estimate the initial capital needed to develop, launch, and stabilize the water park. This is a critical component because water parks typically require major investment before revenue begins, including land, site preparation, construction, water slides, pools, filtration systems, buildings, food service areas, ticketing systems, lockers, safety equipment, furniture, signage, technology, permits, design fees, professional services, pre-opening payroll, launch marketing, contingency, and working capital. Inputs may include itemized capital expenditures, payment timing, contractor costs, equipment costs, deposit requirements, financing assumptions, equity contributions, loan proceeds, and opening cash reserve targets. Outputs may include total project cost, use of funds, capital expenditure schedule, funding gap, minimum cash requirement, and required financing by period. This section is useful for business planning and funding preparation because it helps users understand how much money is needed before the park can operate safely and professionally. It also supports investor and lender conversations by clearly showing where funds will be used, when they are needed, and how the initial investment connects to long-term revenue, cash flow, and profitability.
File types:
Excel – Single-User: .xlsx
Excel – Multi-User: .xlsx
Similar ProductsOther customers were also interested in...



 HenrySheykin
Casino Hotel Financial Model Excel Template
The Casino Hotel Financial Model helps users build a structured five-year forecast for an integrated... Read more

Golf Course Financial Model Excel Template
The Golf Course Financial Model Financial Model Template helps entrepreneurs, owners, consultants, a... Read more
Trampoline Park Business Financial Model Excel Tem...
The Trampoline Park Financial Model helps entrepreneurs, founders, consultants, analysts, and busine... Read more
Art Gallery Business Plan Financial Model Excel Te...
The Art Gallery Financial Model Financial Model Template helps turn an art gallery concept into a st... Read more
Museum Business Plan Financial Model Excel Templat...
The Museum Financial Model helps users turn a museum concept, expansion plan, or funding proposal in... Read more

 Giorgos
Scuba Diving Center – 5 Year Financial Model
Scuba diving affords an unparalleled experience with the underwater world. However, safe diving requ... Read more

Sky Diving Center – 5 Year Financial Model
Skydiving is the sport of jumping from an aircraft and performing acrobatic maneuvers in the air dur... Read more

Theme Park & Hotel Financial Model (Construct...
Financial model presenting a development scenario for a Theme Park & Hotel project including con... Read more

Golf & Entertainment Center – 5 Year Financi...
Financial Model providing an advanced 5-year financial plan for a startup or operating Golf & En... Read more

 City Finance
Indoor Golf Centre Finance Model
A comprehensive editable, MS Excel spreadsheet for tracking Indoor Golf Centre finances, integrates ... Read more
You must log in to submit a review.