
0 ITEMS

Dance Studio Financial Model Excel Template
The Dance Studio Financial Model Financial Model Template helps entrepreneurs, studio owners, consultants, analysts, and business plan writers turn a dance studio concept into a structured financial forecast. Instead of relying on a generic spreadsheet, the template is built around the way a dance studio actually earns and spends money, including class enrollments, monthly memberships, youth and teen programs, adult classes, private lesson opportunities, studio rentals, staffing, facility costs, and launch investments. It gives users a practical framework for financial planning before opening a new studio, expanding an existing location, or preparing materials for lenders, investors, or internal decision-making. This template is designed to help users organize revenue assumptions, startup costs, operating expenses, payroll, cash flow, profitability, and break-even analysis in one connected model. Buyers can adjust pricing, enrollment levels, capacity, occupancy rates, instructor costs, rent, utilities, marketing expenses, and other assumptions to reflect their own market and business strategy. The model then helps translate those assumptions into revenue forecasts, profit and loss projections, cash flow expectations, and key financial outputs that support smarter budgeting and planning. For founders preparing a business plan, the Dance Studio Financial Model provides a ready-to-use foundation for explaining how the business can generate revenue, manage costs, and reach sustainable profitability. For existing studio owners, it can support decisions about adding classes, increasing membership prices, hiring instructors, investing in equipment, improving facility utilization, or expanding into new programs. For consultants and financial analysts, it provides a customizable structure that saves time while still allowing detailed adjustments based on client-specific assumptions. The template is useful for both strategic planning and funding preparation because it connects operational decisions with financial outcomes. Users can see how changes in occupancy, pricing, payroll, rent, or marketing spend may affect profit, cash flow, and break-even timing. With editable inputs, presentation-ready outputs, scenario planning, visual dashboards, and financial statements, the model helps buyers move beyond guesswork and evaluate whether a dance studio plan is financially viable, scalable, and ready to present to stakeholders.


Financial Model Overview
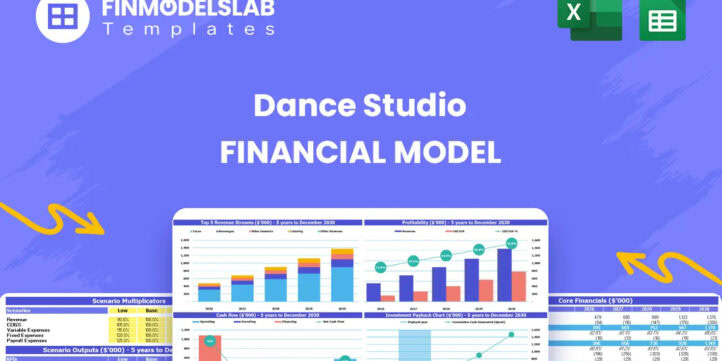
The Dance Studio Financial Model Financial Model Template is a ready-to-use planning tool designed specifically for the economics of a dance studio, where revenue depends on class enrollment, recurring memberships, pricing by age group, studio utilization, lessons, rentals, and the ability to manage fixed facility costs. It helps entrepreneurs, studio owners, consultants, analysts, and business plan writers build a structured forecast without starting from a blank spreadsheet. Users can customize assumptions for adult, youth, and teen classes, monthly fees, occupancy rates, instructor scheduling, rent, utilities, marketing, payroll, startup investments, and other key drivers. The model connects these assumptions to projected revenue, expenses, profitability, cash flow, investor metrics, and financial statements, making it useful for launch planning, funding discussions, expansion analysis, and ongoing management. It is built to be practical, editable, and presentation-ready, giving users a clearer view of what it may take to open, operate, and grow a financially sustainable dance studio.
All-in-One Dashboard
The all-in-one dashboard gives users a central view of the most important inputs and outputs in the Dance Studio Financial Model. Instead of searching through multiple worksheets to understand performance, users can review the core assumptions and results in one organized location. This component may include key inputs such as membership pricing, class capacity, occupancy rates, enrollment growth, studio rental income, payroll assumptions, operating expenses, and startup cost estimates. It then summarizes outputs such as total revenue, EBITDA, net profit, cash position, margins, payback timing, and other high-level indicators. For a dance studio, this is especially useful because small changes in class fill rates, instructor costs, or monthly fees can materially affect profitability. The dashboard helps users quickly understand whether the model is producing a realistic financial picture and whether the business plan supports the owner’s goals. It is also useful for meetings with investors, lenders, partners, or internal decision-makers because it turns a detailed forecast into a clear management summary.
Low, Base, and High Scenario Analysis
The low, base, and high scenario analysis component helps users test how the dance studio may perform under different market conditions. A base case can represent the most realistic forecast, while a low case may assume slower enrollment growth, lower occupancy, higher marketing costs, or delayed class ramp-up. A high case may reflect stronger demand, premium pricing, better studio utilization, or faster membership growth. Inputs may include monthly class capacity, occupancy percentages, membership fees, private lesson volume, studio rental revenue, instructor costs, rent increases, and marketing spend. The outputs show how these assumptions affect revenue, profit, cash flow, and overall financial resilience. This is valuable for planning because a dance studio’s performance can vary depending on local competition, seasonality, class popularity, instructor availability, and community awareness. Scenario analysis helps users avoid relying on a single optimistic forecast and instead prepare for multiple outcomes. It supports better decision-making by showing which assumptions have the biggest impact and where contingency plans may be needed before launch or expansion.
Professional Charts
The professional charts component turns financial projections into visual reports that are easier to understand, present, and discuss. The model can translate projected revenue, operating expenses, cash flow, profit margins, EBITDA, occupancy growth, and other key outputs into presentation-ready charts. This helps users communicate the business case for a dance studio more clearly than raw spreadsheet rows alone. Inputs come from the connected forecast assumptions, including pricing, enrollment, expense categories, payroll, and investment needs, while the outputs provide visual summaries of trends over time. For example, users may be able to see how total revenue grows as class occupancy increases, how expenses behave relative to income, and whether margins improve as fixed costs are spread across more students. These charts are useful for business plans, pitch decks, lender meetings, internal reviews, and management updates. They also help non-financial stakeholders understand the forecast quickly, making it easier to evaluate strategy, identify risks, and explain why certain decisions, such as increasing class capacity or investing in marketing, may be financially justified.
ROE Components and DuPont Analysis
The ROE components and DuPont analysis section helps users evaluate return on equity by breaking profitability into more meaningful drivers. Instead of only showing a single return percentage, this component can help explain how margins, asset efficiency, and leverage contribute to overall return. For a dance studio, this is useful because the business may require upfront investment in flooring, mirrors, barres, sound systems, front desk setup, leasehold improvements, and working capital, while returns depend on how efficiently the studio converts that investment into recurring revenue and profit. Inputs may include net income, equity investment, total assets, revenue, expenses, and financing assumptions. Outputs may include return on equity, profit margin, asset turnover, equity multiplier, and related performance indicators. This component is especially valuable when preparing information for investors or partners who want to understand not only whether the studio is profitable, but why it is profitable and how sustainable those returns may be. It also helps owners compare strategic options, such as investing in a larger facility, using outside financing, or growing within an existing space.
Revenue Inputs
The revenue inputs component is where users define the assumptions that drive the studio’s sales forecast. Because a dance studio’s revenue is typically built from multiple streams, this section may include adult unlimited memberships, youth classes, teen classes, private lessons, workshops, summer programs, studio rentals, event income, and other offerings. Users can enter assumptions such as monthly pricing, number of available spots, occupancy rates, enrollment growth, class frequency, rental rates, and expected utilization. The model then uses these inputs to calculate projected monthly and annual revenue. This is important because revenue in a dance studio is not simply a single sales number; it is the result of capacity, pricing, scheduling, demand, and retention. By separating revenue drivers, users can test practical questions such as whether increasing adult membership pricing is more effective than expanding youth enrollment, whether studio rental income meaningfully improves margins, or whether additional classes justify hiring more instructors. This section gives the model its operational logic and helps users create a forecast that reflects how the studio will actually generate income.
Bank-Ready Reports
The bank-ready reports component organizes the model’s financial outputs into formats that can support funding applications, lender conversations, investor reviews, and business plan submissions. A dance studio may need outside funding for startup improvements, specialized flooring, mirrors, barres, sound systems, deposits, furniture, marketing, initial payroll, or working capital, and lenders typically want clear financial statements rather than informal estimates. This section may include projected profit and loss statements, cash flow statements, balance sheet summaries, revenue schedules, expense summaries, and key financial metrics. Inputs flow from the assumptions already entered into the model, while outputs are presented in a structured and professional format that helps stakeholders understand how the business expects to repay financing and remain solvent. Bank-ready reporting is useful because it strengthens credibility and reduces the time needed to prepare external documents. It also helps users identify weaknesses before presenting the plan, such as insufficient cash reserves, unrealistic revenue growth, or expenses that are too high relative to projected enrollment.
Revenue Breakdown
The revenue breakdown component provides a detailed view of how each revenue stream contributes to total studio income. Rather than showing only one combined revenue figure, it separates income by category, such as adult unlimited memberships, youth monthly classes, teen monthly classes, private lessons, workshops, studio space rentals, events, or other services. Inputs may include pricing, student count, class capacity, occupancy, rental frequency, session volume, and seasonal changes. Outputs may show revenue by stream, percentage contribution, monthly trends, annual totals, and growth over time. This is highly useful for a dance studio because different programs may have different margins, scheduling requirements, instructor needs, and growth potential. For example, youth classes may support predictable recurring revenue, adult memberships may improve utilization during certain time slots, and rentals may monetize unused studio hours. The revenue breakdown helps users evaluate which offerings drive the business, which programs may need marketing support, and which streams may deserve expansion. It also helps make the financial story more transparent for lenders, investors, and business partners.
KPI Dashboard
The KPI dashboard component focuses on the performance metrics that help users monitor the health of the dance studio over time. While financial statements show accounting results, key performance indicators help explain the operational drivers behind those results. Relevant metrics may include class occupancy, membership growth, average revenue per student, revenue per class, instructor cost as a percentage of revenue, EBITDA margin, net profit margin, cash balance, break-even progress, payback period, and return metrics. Inputs are drawn from the revenue, expense, staffing, and cash flow assumptions, while outputs present concise measures that can be compared across months, years, or scenarios. This is useful for both planning and management because a dance studio owner needs to understand more than total revenue; they need to know whether the space is being used efficiently, whether pricing supports instructor costs, and whether growth is improving margins. The KPI dashboard can also support benchmarking against industry expectations, helping users validate whether their assumptions and performance targets are reasonable. It gives founders and operators a practical way to manage the business using measurable indicators.
Startup Cost Breakdown
The startup cost breakdown component helps users estimate the initial investment required before the dance studio can open or expand. This section may include specialized dance flooring, mirrors and barres, sound system installation, front desk and lounge furniture, lease deposits, permits, insurance, signage, website setup, booking software, launch marketing, instructor recruitment, initial supplies, and working capital. Users can customize each cost line to reflect their local market, facility size, studio concept, and quality standards. The outputs help calculate total funding required, initial cash need, and the amount of capital that must be available before revenue begins. This is especially important for a dance studio because many costs are incurred before the first tuition payment is collected, and underestimating setup costs can create cash pressure during launch. A detailed startup cost schedule also helps users separate one-time investments from ongoing operating expenses, which improves the accuracy of the profit and loss forecast. For funding preparation, it gives lenders and investors a clearer view of how capital will be used and why the requested amount is reasonable.
Break-Even Analysis
The break-even analysis component helps users understand when the dance studio is expected to cover its costs and begin generating profit. This section can use assumptions such as fixed monthly expenses, rent, payroll, utilities, insurance, marketing, software, instructor costs, class pricing, membership fees, occupancy rates, and variable costs to estimate the level of revenue or enrollment required to reach break-even. Outputs may include the projected break-even month, required monthly sales, required number of students, contribution margin, and the relationship between pricing, capacity, and cost structure. For a dance studio, this is a crucial planning tool because fixed costs such as facility rent and staffing can be significant, while revenue depends on building enrollment quickly enough to cover those obligations. Break-even analysis helps users answer practical questions such as how many members are needed to support the lease, whether introductory pricing delays profitability, or whether additional classes improve financial performance. It is also valuable for decision-making because it shows the margin of safety between expected performance and the minimum level needed to remain financially viable.
File types:
Excel – Single-User: .xlsx
Excel – Multi-User: .xlsx
Similar ProductsOther customers were also interested in...


 HenrySheykin
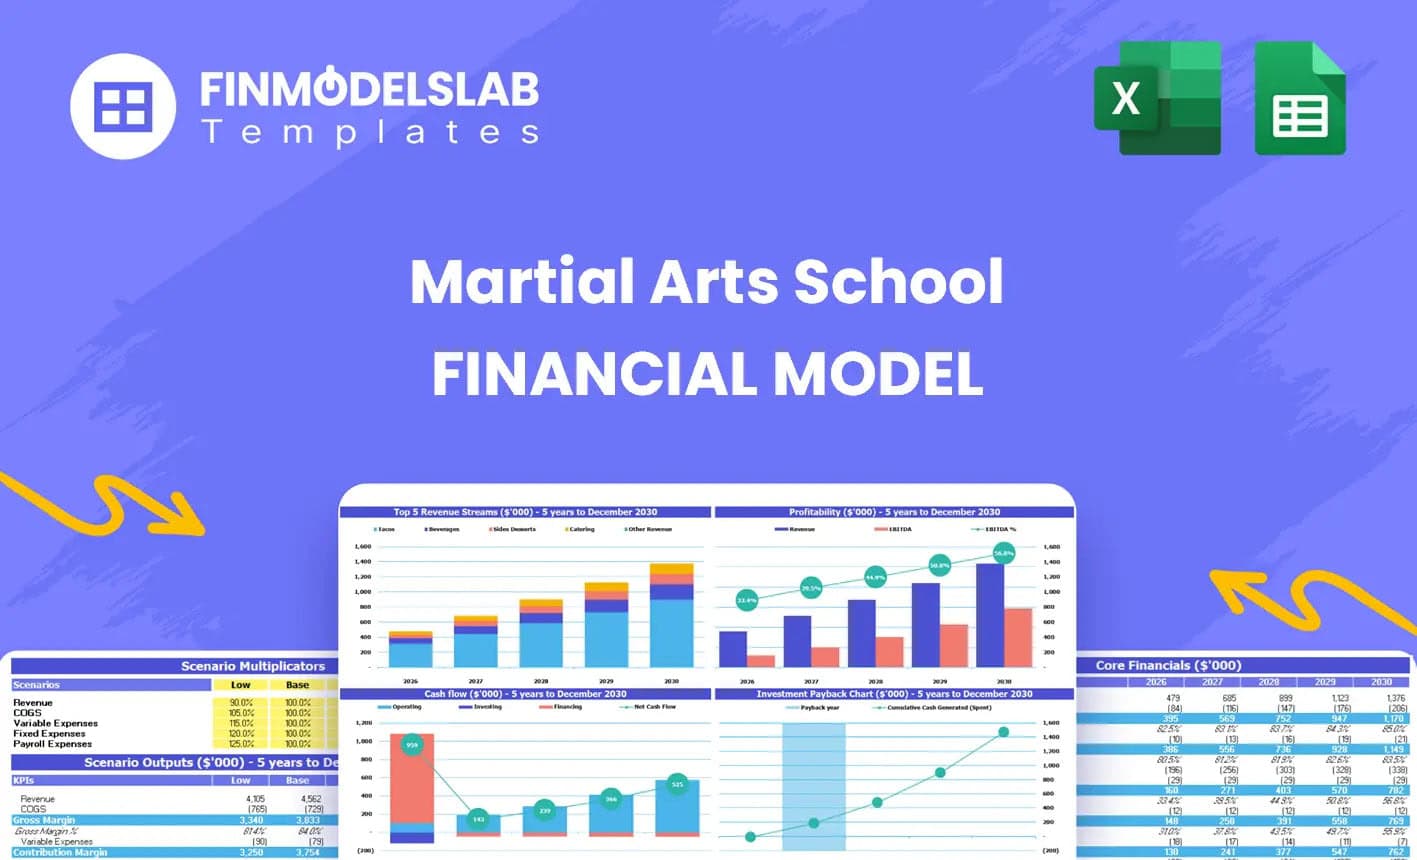
Martial Arts School Financial Model Excel Template
The Martial Arts School Financial Model helps founders, school owners, consultants, and business pla... Read more

Sports Therapy Financial Model Excel Template
The Sports Medicine Clinic Financial Model helps users turn a clinic concept, launch plan, or expans... Read more
Tai Chi Center Financial Model Excel Template
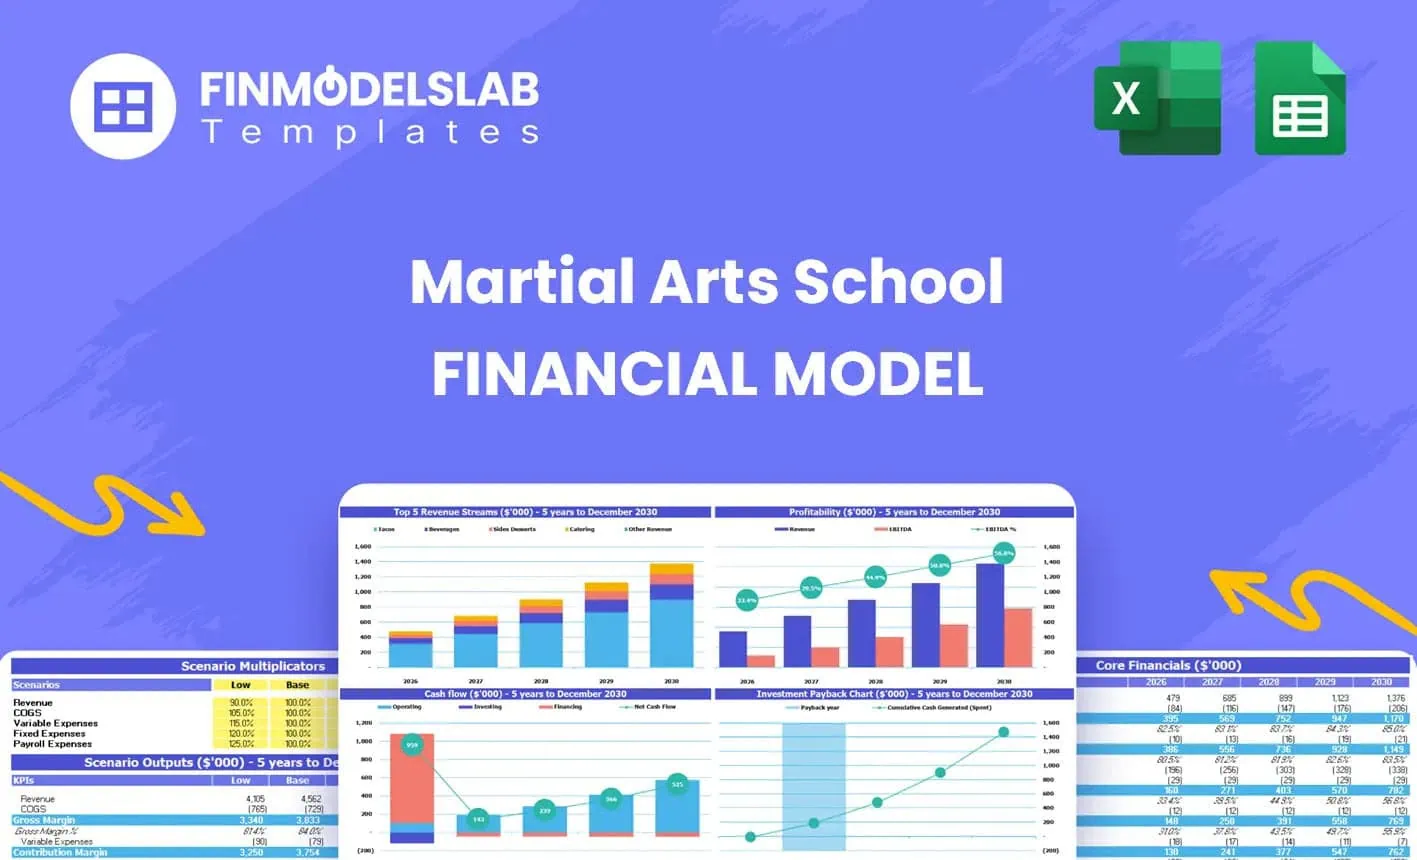
The Martial Arts School Financial Model helps founders, school owners, consultants, and business pla... Read more

Personal Training Service Financial Model Excel Te...
The Personal Training Financial Model helps entrepreneurs, fitness studio owners, consultants, analy... Read more

Personal Training Financial Model Excel Template
The Personal Training Financial Model helps entrepreneurs, fitness studio owners, consultants, analy... Read more

 Giorgos
Pilates & Yoga Studio Financial Model – 5 Ye...
Financial Model provides an advanced 5-year financial plan for a startup or operating Pilates & ... Read more

Dance Studio Financial Model – 5 Year Financial ...
Provides an advanced 5-year financial plan for a startup or operating Dance Studio and is a flexible... Read more

 anthony
Racket Sports Financial Model Bundle
This bundle of financial model templates tailored to racket sports businesses aims to provide a soph... Read more

 David
Sports Club / Sports Complex 5-Year 3 Statement Fi...
3 statement 5 year rolling financial projection Excel model for a sports club / sports complex busin... Read more

Baby Swimming School – Dynamic 10 Year Financial...
Financial model providing a dynamic 10-Year Financial Plan for a Baby Swimming School for children u... Read more
You must log in to submit a review.