
0 ITEMS

Alcohol Treatment Center Financial Model Excel Template
The Drug and Alcohol Rehab Center Financial Model helps users turn a treatment facility concept into a structured financial forecast that can support business planning, funding discussions, and operational decision-making. Instead of building a rehab center forecast from scratch, users can work from a ready-to-use model designed around the economics of substance abuse treatment services, including residential care, detoxification, counseling, therapy sessions, medical consultations, and related revenue streams. The template brings together revenue assumptions, startup costs, operating expenses, payroll, cash flow, profitability, and break-even analysis in one organized planning file. This financial model template is built for entrepreneurs, founders, rehab center owners, consultants, analysts, and business plan writers who need to evaluate the financial viability of a drug and alcohol rehab center. It is especially useful for users preparing investor presentations, bank loan applications, internal budgets, or expansion plans. The model provides a practical framework for estimating how practitioner capacity, patient volume, utilization rates, pricing, staffing levels, and expense assumptions affect revenue, margins, cash needs, and long-term profitability. The template is fully editable, allowing users to adjust assumptions for their own facility size, service mix, reimbursement environment, payroll structure, capital investment, and operating strategy. Users can review low, base, and high scenarios, analyze revenue drivers, evaluate monthly and annual cash flow, and understand how changes in utilization, pricing, staffing, or costs influence results. This makes it easier to test assumptions before committing capital, hiring staff, leasing or renovating space, purchasing medical equipment, or presenting projections to stakeholders. With pre-built formulas, professional financial outputs, charts, dashboards, and investor-ready reports, the Drug and Alcohol Rehab Center Financial Model gives users a faster and more consistent way to plan a behavioral health facility. It helps identify funding needs, monitor profitability, evaluate return on investment, and determine when the business may reach break-even. Whether used for a new startup, a proposed expansion, or a financial feasibility study, the template supports more informed decisions by connecting the operational realities of a rehab center with clear financial projections.
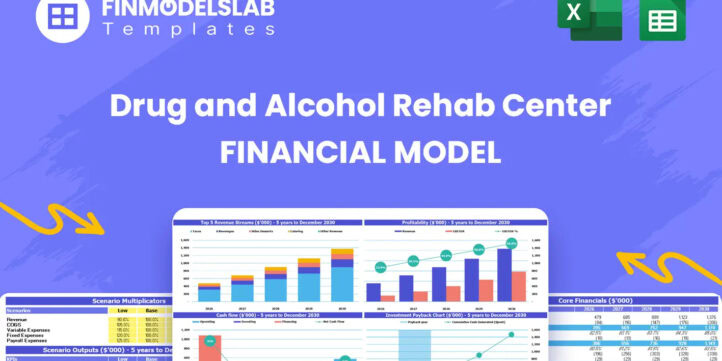


Financial Model Overview
The Drug and Alcohol Rehab Center Financial Model is a ready-to-use financial model template designed to help entrepreneurs, operators, consultants, analysts, and business plan writers evaluate the financial performance of a substance abuse treatment facility. A rehab center has a complex operating structure because revenue depends on service mix, practitioner capacity, patient utilization, treatment pricing, reimbursement assumptions, staffing requirements, facility costs, medical supplies, marketing, and working capital timing. This template brings those drivers into one structured model so users can forecast revenue, expenses, profit, cash flow, funding needs, and long-term sustainability without starting from a blank spreadsheet. It is useful for planning a new addiction treatment center, expanding an existing behavioral health operation, preparing a lender package, building investor materials, or testing whether a proposed facility can support its staffing plan and capital investment. The model is editable, presentation-ready, and structured to support up to five years of financial projections.
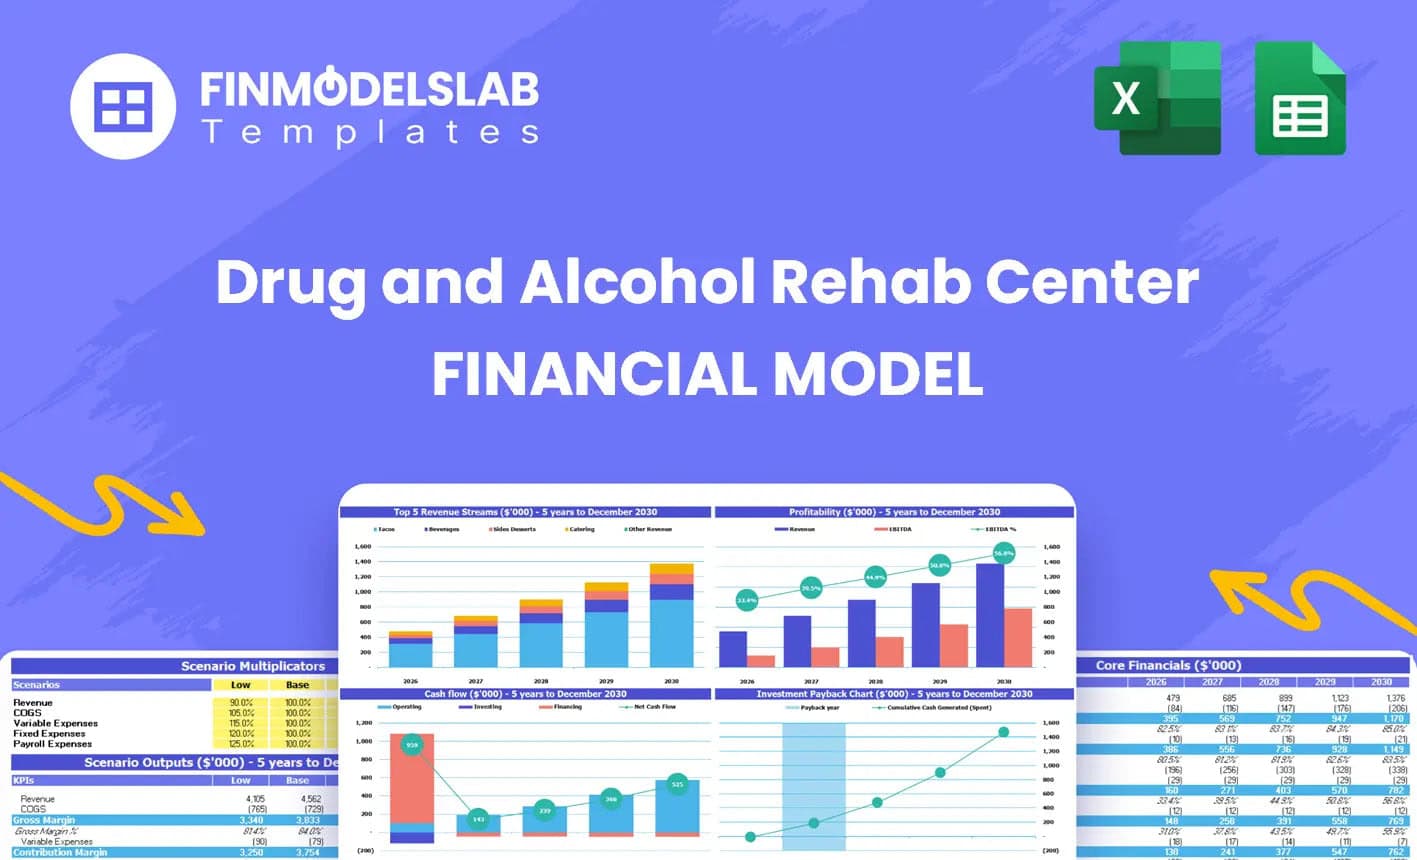
All-in-One Dashboard
The all-in-one dashboard gives users a centralized view of the core inputs and core outputs that drive the Drug and Alcohol Rehab Center Financial Model. This section is designed to make the model easier to navigate by summarizing the most important assumptions, such as treatment pricing, service capacity, utilization rates, cost assumptions, payroll inputs, capital requirements, and financing assumptions, alongside key outputs such as revenue, EBITDA, net income, cash balance, return metrics, and break-even timing. For a rehab center, this is especially valuable because management needs to understand how patient census, practitioner availability, service mix, and expense levels work together. The dashboard helps users quickly review whether the facility is financially balanced, whether margins are improving, and whether the cash position is strong enough to support operations. It is also useful in stakeholder meetings because it condenses a detailed forecast into an accessible summary that can be reviewed before moving into supporting schedules and detailed financial statements.
Low, Base, and High Scenario Analysis
The low, base, and high scenario analysis section helps users test how the rehab center may perform under different operating conditions. Instead of relying on a single forecast, the model allows users to compare conservative, expected, and optimistic cases by adjusting assumptions such as patient volume, facility utilization, service pricing, reimbursement rates, practitioner productivity, marketing effectiveness, payroll levels, and variable cost percentages. This is important for a drug and alcohol rehab center because real-world performance can vary significantly depending on referral sources, local competition, insurance collections, regulatory requirements, staff availability, and occupancy levels. The scenario analysis helps users understand downside risk, upside potential, and the financial sensitivity of the business model. It can show how a slower ramp-up may affect cash flow, how higher utilization can improve profitability, or how increased staffing costs may reduce margins. For lenders and investors, this section demonstrates that the business plan has been stress-tested rather than built around only one ideal outcome.
Professional Charts and Visual Reports
The professional charts and visual reports section turns the financial projections into clear visual outputs that are easier to interpret and present. A rehab center forecast can include many detailed assumptions and schedules, so charts help translate those numbers into meaningful trends such as revenue growth, expense structure, EBITDA development, cash balance movement, profitability by year, and changes in key financial metrics. These visuals are useful for founders and operators who need to communicate the plan to partners, advisors, lenders, investors, or internal leadership teams. Instead of requiring stakeholders to read through rows of spreadsheet data, the model provides presentation-ready views that highlight the most important financial story. Users can use these charts to explain how the facility scales, how operating leverage improves over time, how startup investment converts into revenue-generating capacity, and how cash flow supports ongoing growth. The section is also useful for decision-making because visual trends often make it easier to identify potential problems, such as margin pressure, cash dips, or expense categories growing faster than revenue.
ROE Components and DuPont Analysis
The ROE components section uses a DuPont-style analysis to help users understand what is driving return on equity in the rehab center financial model. Rather than showing return metrics as a single number, this component breaks performance into underlying drivers such as profitability, asset efficiency, and financial leverage. For a drug and alcohol rehab center, this can help users see whether strong returns are coming from high operating margins, efficient use of capital assets, effective revenue generation from facility capacity, or the financing structure used to support the business. Inputs may include net income, revenue, total assets, equity, debt assumptions, and balance sheet projections, while outputs may include return on equity, profit margin, asset turnover, and leverage indicators. This section is useful for investors because it helps explain the quality of projected returns, not just their size. It also helps owners and managers identify practical ways to improve returns, such as increasing utilization, managing costs, improving collections, optimizing capital expenditures, or adjusting the mix between debt and equity financing.
Revenue Inputs
The revenue inputs section is one of the most important parts of the Drug and Alcohol Rehab Center Financial Model because it defines how the facility earns income. It allows users to enter and adjust the core revenue assumptions behind the forecast, including the number of practitioners, monthly treatment capacity, utilization rates, service pricing, expected patient volume, and the mix of services offered. Relevant revenue streams may include detoxification services, residential counseling programs, individual therapy sessions, family counseling sessions, medical consultations, and other treatment-related services. For each service line, the model can connect operational assumptions to projected monthly and annual revenue, helping users see exactly how a change in capacity, price, or utilization affects the financial outlook. This is valuable for business planning because rehab center revenue is not simply based on a single product price; it depends on clinical staffing, treatment programs, available beds or appointments, demand generation, and reimbursement patterns. By organizing these assumptions clearly, the template helps users build a more credible forecast and identify which services have the greatest impact on growth and profitability.
Bank-Ready Reports
The bank-ready reports section provides lender-friendly financial outputs that can support loan applications, financing discussions, and stakeholder review. Rehab centers often require significant upfront investment for facility renovation, medical equipment, therapy room furnishings, licensing preparation, technology, vehicles, working capital, and pre-opening expenses. Because of this, lenders typically want to see structured financial projections, clear repayment capacity, realistic assumptions, and evidence that the business can maintain sufficient cash flow. This component helps present the forecast in a professional format by summarizing income statement projections, cash flow expectations, balance sheet results, debt service ability, profitability metrics, and key operating assumptions. It allows users to explain how borrowed funds may be used, how the business is expected to generate revenue, and whether projected cash flow can support ongoing obligations. For consultants and founders preparing funding documents, this section reduces the time required to organize outputs and helps ensure that the financial model addresses the questions lenders are likely to ask.
Revenue Breakdown
The revenue breakdown section provides a detailed view of projected income by service stream, helping users understand which parts of the rehab center are expected to generate the most revenue. Instead of showing only total sales, this component separates revenue across services such as detoxification, residential care, individual counseling, family counseling, outpatient programs, medical consultations, or other treatment offerings included in the business model. Inputs may include pricing, monthly capacity, patient utilization, number of providers, appointment or treatment volume, and service launch timing. Outputs may include revenue by month, revenue by year, percentage contribution by service line, and growth trends across the forecast period. This is useful because different rehab services can have different pricing models, staffing needs, margins, and scalability. A detailed revenue breakdown helps users identify the most important growth drivers, evaluate whether the service mix is balanced, and adjust strategy if the forecast relies too heavily on one revenue source. It also strengthens investor and lender presentations by showing the logic behind total revenue rather than presenting it as a single unexplained figure.
KPI Dashboard and Performance Benchmarks
The KPI dashboard and performance benchmarks section helps users track the operational and financial metrics that matter most for a rehab center. Key performance indicators may include revenue growth, EBITDA margin, cash balance, utilization rate, revenue per practitioner, service line contribution, operating expense ratios, payroll as a percentage of revenue, marketing efficiency, return on equity, and other performance measures relevant to addiction treatment operations. The dashboard can also support comparison against internal targets or industry benchmarks, helping users determine whether assumptions are realistic and whether the facility is operating efficiently. This is valuable because rehab center success depends on more than total revenue; it depends on how effectively the business converts clinical capacity into profitable services while maintaining adequate staffing, compliance, quality of care, and cash flow. The KPI dashboard gives founders, managers, and stakeholders an at-a-glance way to monitor progress, spot underperformance, and support faster decisions. It can also be used in board updates, investor communications, or monthly management reviews to keep attention focused on the metrics that drive sustainability.
Startup Costs and Capital Investment
The startup costs and capital investment section helps users estimate the initial funding required to prepare a drug and alcohol rehab center for operations. This component organizes one-time costs such as facility renovation, medical equipment, therapy room furnishings, initial vehicle purchases, licensing preparation, deposits, technology setup, furniture, pre-opening payroll, launch marketing, insurance, professional fees, and working capital reserves. For a rehab center, underestimating startup costs can create serious pressure because the business may need to invest heavily before receiving its first patient payments or insurance reimbursements. The model allows users to separate capital expenditures from operating expenses and understand how each category affects cash needs, depreciation, financing requirements, and the balance sheet. Outputs may include total startup investment, timing of cash outflows, funding gap analysis, and the relationship between initial capital and future operating capacity. This section is useful for founders preparing to raise equity, apply for debt financing, or determine whether the launch budget is realistic. It also helps users compare different launch strategies, such as opening with a smaller facility, phasing renovations, leasing equipment, or delaying certain expansion costs.
Break-Even Analysis
The break-even analysis section helps users determine when the rehab center may generate enough revenue to cover its fixed and variable costs. This component connects pricing, patient volume, service utilization, payroll, rent, medical supplies, marketing, administrative expenses, and other operating costs to calculate the point at which the business moves from loss to profitability. For a drug and alcohol rehab center, break-even timing is a critical planning measure because fixed costs can be substantial, especially when the facility requires licensed staff, clinical oversight, compliance systems, insurance, and a physical location before reaching full capacity. The model can show the monthly break-even point, the revenue required to cover costs, and the level of utilization needed to support sustainable operations. This information is useful for budgeting, hiring plans, marketing strategy, and funding discussions because it helps users understand how much runway may be needed before the business becomes self-supporting. It also allows management to test how changes in pricing, census growth, staffing levels, or expense controls may accelerate or delay profitability.
File types:
Excel – Single-User: .xlsx
Excel – Multi-User: .xlsx
Similar ProductsOther customers were also interested in...


 HenrySheykin
Drug Rehab Clinic Financial Model Excel Template
The Drug and Alcohol Rehab Center Financial Model helps users turn a treatment facility concept into... Read more

Health Clinic Financial Model Excel Template
The Health Clinic Financial Model helps users build a structured financial forecast for a medical cl... Read more

Ayurveda Center Financial Model Excel Template
The Ayurvedic Consultation Service Financial Model helps entrepreneurs, practitioners, wellness foun... Read more

Acupuncture Center Financial Model Excel Template
The Acupuncture Clinic Financial Model helps users turn an acupuncture practice concept into a struc... Read more

Occupational Therapy Financial Model Excel Templat...
The Occupational Therapy Financial Model helps users build a structured forecast for an OT clinic or... Read more

 Giorgos
Speech Therapy Center – 5 Year Financial Model
Financial Model providing an advanced 5-year financial plan for a startup or operating Speech Therap... Read more
Medical Practice Financial Model Excel Template
The Medical Practice Financial Model helps users turn a clinic concept, expansion plan, or healthcar... Read more
Dental Practice Financial Model Excel Template
The Dental Clinic Financial Model helps users turn a dental practice concept, launch plan, or expans... Read more

Ambulatory Surgical Center Financial Model Excel T...
The Ambulatory Surgery Center Financial Model helps founders, healthcare operators, consultants, ana... Read more
Clinic Financial Model Excel Template
The Healthcare Clinic Financial Model helps founders, clinic owners, consultants, analysts, and busi... Read more
You must log in to submit a review.