
0 ITEMS

Coffeehouse Financial Model Excel Template
The Coffee Shop Financial Model helps entrepreneurs, founders, business owners, consultants, and analysts turn a cafe concept into a structured financial plan. Instead of relying on rough estimates, users can build a clear forecast around customer traffic, average order value, product mix, startup costs, operating expenses, payroll, cash flow, profitability, and funding requirements. The template is designed for coffee shops, cafes, bakery cafes, beverage concepts, and small food service businesses that need a practical way to evaluate whether the business can launch, grow, and reach sustainable profitability. Built for business planning, lender discussions, investor preparation, and internal decision-making, this financial model template connects key assumptions with financial outputs in one editable file. Users can adjust weekday and weekend customer volume, average check size, menu category sales, ingredient costs, staffing levels, rent, marketing, utilities, and other cafe operating expenses. The model then helps translate those assumptions into projected revenue, cost of goods sold, EBITDA, profit, cash flow, and performance metrics over a multi-year forecast period. The template is especially useful for people preparing a coffee shop business plan, loan application, pitch deck, budget, or expansion proposal. It gives users a more organized way to explain how the business will make money, how much capital is needed before opening, what monthly expenses must be covered, and when the cafe may break even. With scenario analysis, users can compare conservative, base, and optimistic cases to understand how changes in traffic, pricing, or costs may affect cash flow and profitability. Because the Coffee Shop Financial Model is fully customizable, it can be adapted to a new independent cafe, a specialty coffee bar, a donut and pastry shop, a bakery cafe, or an existing coffee business planning a second location. The ready-made structure saves time while still allowing users to personalize every major assumption. It supports better financial planning, clearer stakeholder communication, and more confident decision-making by showing how revenue assumptions, startup investments, operating costs, payroll, break-even analysis, and cash flow work together in a complete forecast.
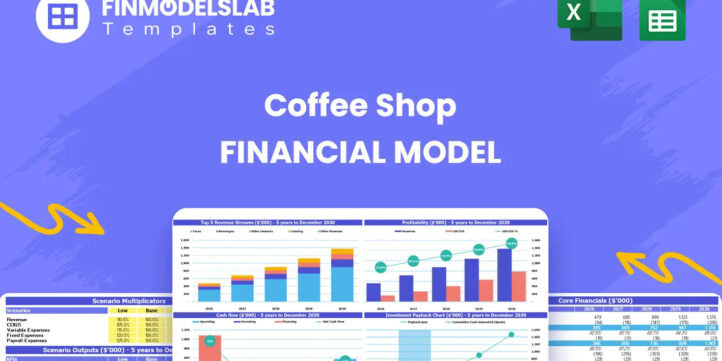


Financial Model Overview
The Coffee Shop Financial Model is a ready-to-use financial model template built to help cafe founders, coffee shop owners, consultants, analysts, and business plan writers evaluate the financial potential of a coffee shop before launch, funding, or expansion. It brings together the major drivers of a cafe business, including customer traffic, average order value, product mix, cost of goods sold, payroll, fixed overhead, startup investment, cash flow, profitability, and investor return metrics. For a coffee shop, small differences in daily covers, weekend demand, staffing schedules, ingredient costs, and rent can have a major impact on profit, so this template gives users a structured way to test assumptions instead of relying on guesswork. The model is designed for practical planning as well as professional presentation, helping users prepare lender-friendly projections, investor discussions, internal budgets, and business plan financials. With editable inputs, automated calculations, five-year projections, scenario analysis, and visual outputs, the Coffee Shop Financial Model helps users understand how the business may perform under realistic operating conditions and what decisions may improve financial outcomes.
All-in-one Dashboard
The all-in-one dashboard gives users a central place to view the most important inputs and outputs of the Coffee Shop Financial Model without having to search through multiple worksheets. This section is designed to summarize the financial story of the cafe by connecting assumptions such as customer volume, average check size, revenue growth, cost percentages, payroll levels, rent, startup investment, and funding needs with outputs such as revenue, gross profit, EBITDA, net income, cash balance, payback period, and break-even timing. For a coffee shop owner or founder, this dashboard is useful because it turns a complex forecast into a quick management view that can be reviewed before a meeting with a bank, investor, partner, landlord, or internal team. It helps users see whether the business is generating enough revenue to cover ingredient costs, labor, rent, utilities, marketing, and other fixed expenses. It can also highlight whether the cash position remains healthy during the early months when startup spending is high and revenue is still ramping up. By placing core assumptions and core outputs in one accessible area, the dashboard supports faster decision-making, easier financial planning, and clearer communication with stakeholders who need to understand the business model quickly.
Low, Base, and High Scenario Analysis
The Low, Base, and High scenario analysis section helps users compare how the coffee shop may perform under different operating conditions. Instead of building only one forecast, users can create conservative, expected, and optimistic cases by adjusting key assumptions such as daily customer traffic, weekday and weekend sales patterns, average order value, menu mix, growth rates, ingredient costs, payroll intensity, rent, and marketing spend. The outputs show how each scenario affects revenue, margins, EBITDA, cash flow, profitability, and potentially the timing of break-even or payback. This is especially valuable for a coffee shop because early performance can vary depending on location quality, foot traffic, local competition, seasonality, customer loyalty, and opening marketing success. A conservative scenario may show what happens if customer volume is slower than expected, while a high case can help plan for the operational pressure of faster growth. The base case can serve as the main business plan forecast. For lenders and investors, scenario analysis demonstrates that the user has considered risk and uncertainty rather than presenting a single overly optimistic projection. For owners and operators, it supports contingency planning, pricing decisions, staffing decisions, and cash reserve planning before problems appear.
Professional Charts
The professional charts section converts the financial forecast into clear visual reports that can be used in presentations, business plans, funding discussions, or internal reviews. Rather than relying only on spreadsheet rows and columns, the Coffee Shop Financial Model uses charts to show trends in revenue, expenses, profitability, cash flow, margins, and other important measures over time. These visuals make it easier to explain whether sales are growing, whether the cost structure is improving, whether margins are stable, and whether the business can maintain a positive cash position after the initial launch period. For a coffee shop, charts are particularly useful because they can show the relationship between revenue growth and fixed costs, helping users understand how higher customer traffic improves operating leverage once rent, management salaries, and baseline overhead are covered. They can also support stakeholder conversations by making the forecast easier to absorb for people who may not want to review detailed worksheet formulas. Consultants can use the charts to present findings to clients, founders can include them in pitch materials, and owners can use them to monitor progress against the original plan. A visual forecast improves communication and helps users turn financial data into a more persuasive business story.
ROE Components
The ROE components section uses a DuPont-style analysis to help users understand what is driving return on equity within the coffee shop business. Instead of looking at return on equity as one isolated number, this section breaks performance into underlying drivers such as profitability, asset efficiency, and financial leverage. Inputs and outputs may include net profit margin, revenue, net income, total assets, equity, and related performance measures that show how effectively the cafe converts sales into profit and how efficiently it uses capital invested in equipment, build-out, working capital, and other assets. For a coffee shop, this analysis is helpful because the business often requires meaningful upfront investment in leasehold improvements, espresso machines, grinders, ovens, refrigeration, seating, signage, and point-of-sale systems. The ROE view helps users evaluate whether that investment is producing an acceptable return over time. It can also support investor discussions by showing whether improved pricing, better cost control, faster sales growth, or more efficient asset utilization would increase owner returns. By connecting profitability and capital structure, this section gives users a deeper understanding of financial performance beyond simple sales growth. It helps founders, lenders, and stakeholders assess whether the business is simply busy or actually creating value.
Revenue Inputs
The revenue inputs section is where users define the commercial engine of the coffee shop. It allows the forecast to be built around practical cafe assumptions such as daily customer volume, weekday and weekend traffic patterns, average order value, product category mix, seasonal changes, annual growth, and revenue contribution from different streams. For a coffee shop, revenue may come from coffee and beverages, pastries, donuts, breakfast items, snacks, catering, bulk orders, merchandise, or other add-on sales, and this section gives users a structured way to reflect those channels in the model. The inputs can be edited to match a specific location, concept, opening schedule, customer base, menu strategy, and pricing plan. Outputs generated from these assumptions flow into the revenue forecast, gross margin calculations, profit and loss statement, cash flow forecast, and investor metrics. This section is useful because revenue is one of the most sensitive parts of a cafe model. A small change in average check size or customer traffic can significantly change monthly sales and profitability. By making revenue assumptions explicit, the model helps users test whether the planned traffic levels are realistic, whether pricing supports the cost structure, and whether the business can generate enough sales to cover payroll, rent, ingredients, and startup investment recovery.
Bank-Ready Reports
The bank-ready reports section organizes the financial outputs in a format that is easier for lenders, investors, advisors, and other stakeholders to review. A coffee shop loan application or funding discussion usually requires more than a simple sales estimate, so this part of the Coffee Shop Financial Model can help present projected income statements, cash flow forecasts, balance sheet summaries, financing needs, profitability measures, and key operating metrics in a structured way. The section is designed to answer the types of questions lenders typically ask, including how much capital is required, when the business becomes profitable, whether monthly cash flow remains positive, how debt service could be supported, and what assumptions drive the forecast. Inputs from the rest of the model, such as startup costs, sales assumptions, COGS, payroll, rent, marketing, and financing structure, flow into these reports automatically. For users preparing a business plan or loan package, this saves time and improves consistency across the forecast. For consultants and analysts, it provides a professional reporting structure that can be customized for different clients. By presenting the cafe’s financial projections in a clean and lender-friendly format, this section helps strengthen credibility and makes the financial plan easier to evaluate.
Revenue Breakdown
The revenue breakdown section gives users a more detailed view of how total coffee shop sales are generated across different revenue streams. Rather than treating revenue as one generic number, this component separates income by categories such as coffee and beverages, donuts and pastries, catering and bulk orders, or other menu lines relevant to the specific cafe concept. Users can adjust the percentage mix, pricing assumptions, customer demand, and growth expectations for each stream, allowing the model to show which parts of the business contribute most to sales and margin. This is important for coffee shops because not all products have the same profitability profile. Beverages may have strong margins but depend on volume and speed of service, pastries may drive impulse purchases and increase average ticket size, while catering and bulk orders may produce larger transactions but require planning, labor, packaging, and inventory control. The revenue breakdown helps users evaluate product strategy, menu focus, upselling opportunities, and operational priorities. It can also support decisions about whether to expand food offerings, promote high-margin drinks, introduce loyalty programs, or target office catering. By showing the composition of revenue over time, this section helps users understand not only how much the business sells, but where the sales come from and how they affect profitability.
KPI Dashboard
The KPI dashboard section tracks the key performance indicators that matter most for a coffee shop’s financial health and operating performance. This may include metrics such as revenue growth, average order value, daily customer volume, gross margin, EBITDA margin, net profit margin, payroll as a percentage of sales, COGS as a percentage of revenue, cash balance, payback period, break-even timing, and return metrics. The dashboard helps users compare actual or forecasted performance against internal targets and industry benchmarks, making it easier to identify where the business is strong and where improvements may be needed. For example, if revenue is growing but payroll is rising faster than sales, the model can help highlight a staffing efficiency issue. If gross margin weakens, users can review ingredient costs, supplier pricing, waste, portion control, or menu pricing. If cash flow tightens despite positive profitability, the user can investigate startup spending, debt payments, inventory buildup, or seasonality. The KPI dashboard is useful for founders preparing funding documents, owners managing operations, and consultants presenting recommendations because it turns financial data into measurable business signals. It supports disciplined decision-making by helping users focus on the numbers that most directly influence sustainability, growth, and profitability.
Startup Costs
The startup costs section organizes the initial investment required to open or expand a coffee shop before regular operations begin. It may include leasehold improvements, store build-out, furniture, fixtures, signage, espresso machines, grinders, brewing equipment, commercial ovens, refrigeration, display cases, point-of-sale systems, smallwares, opening inventory, licenses, permits, professional fees, deposits, pre-opening payroll, initial marketing, and working capital reserves. Users can edit each cost category to reflect the actual location, size, concept, equipment strategy, and launch plan. The section then helps calculate total funding required and connects those assumptions to the broader forecast, including cash flow, balance sheet, financing needs, and payback analysis. This is particularly important for a coffee shop because the business often requires significant spending before the first sale is made. Underestimating build-out costs, equipment purchases, deposits, or opening inventory can create cash shortages that affect the launch. A detailed startup cost plan also helps users communicate clearly with lenders and investors about how much capital is needed and how the funds will be used. By separating one-time launch expenses from recurring operating costs, this section improves budgeting accuracy and helps users prepare a realistic funding plan before signing a lease, purchasing equipment, or committing to a launch date.
Break-Even Analysis
The break-even analysis section helps users understand when the coffee shop may generate enough revenue to cover its fixed and variable costs. It connects assumptions such as average order value, customer traffic, COGS, payment processing fees, packaging costs, payroll, rent, utilities, insurance, marketing, and other overhead expenses to determine the sales level or time period needed to reach profitability. Outputs may include break-even revenue, break-even month, contribution margin, fixed cost coverage, and the gap between current forecasted sales and the sales required to break even. For a coffee shop, this analysis is essential because the business has a mix of fixed costs, such as rent and salaried staff, and variable costs, such as ingredients, packaging, and transaction fees. Once the cafe covers its fixed monthly cost base, additional sales can contribute more strongly to profit, but only if margins and staffing are managed properly.
Similar ProductsOther customers were also interested in...
 HenrySheykin
Coffee Truck Financial Model Excel Template
The Coffee Truck Financial Model Template helps entrepreneurs, founders, consultants, and business p... Read more
 ECF Consultancy
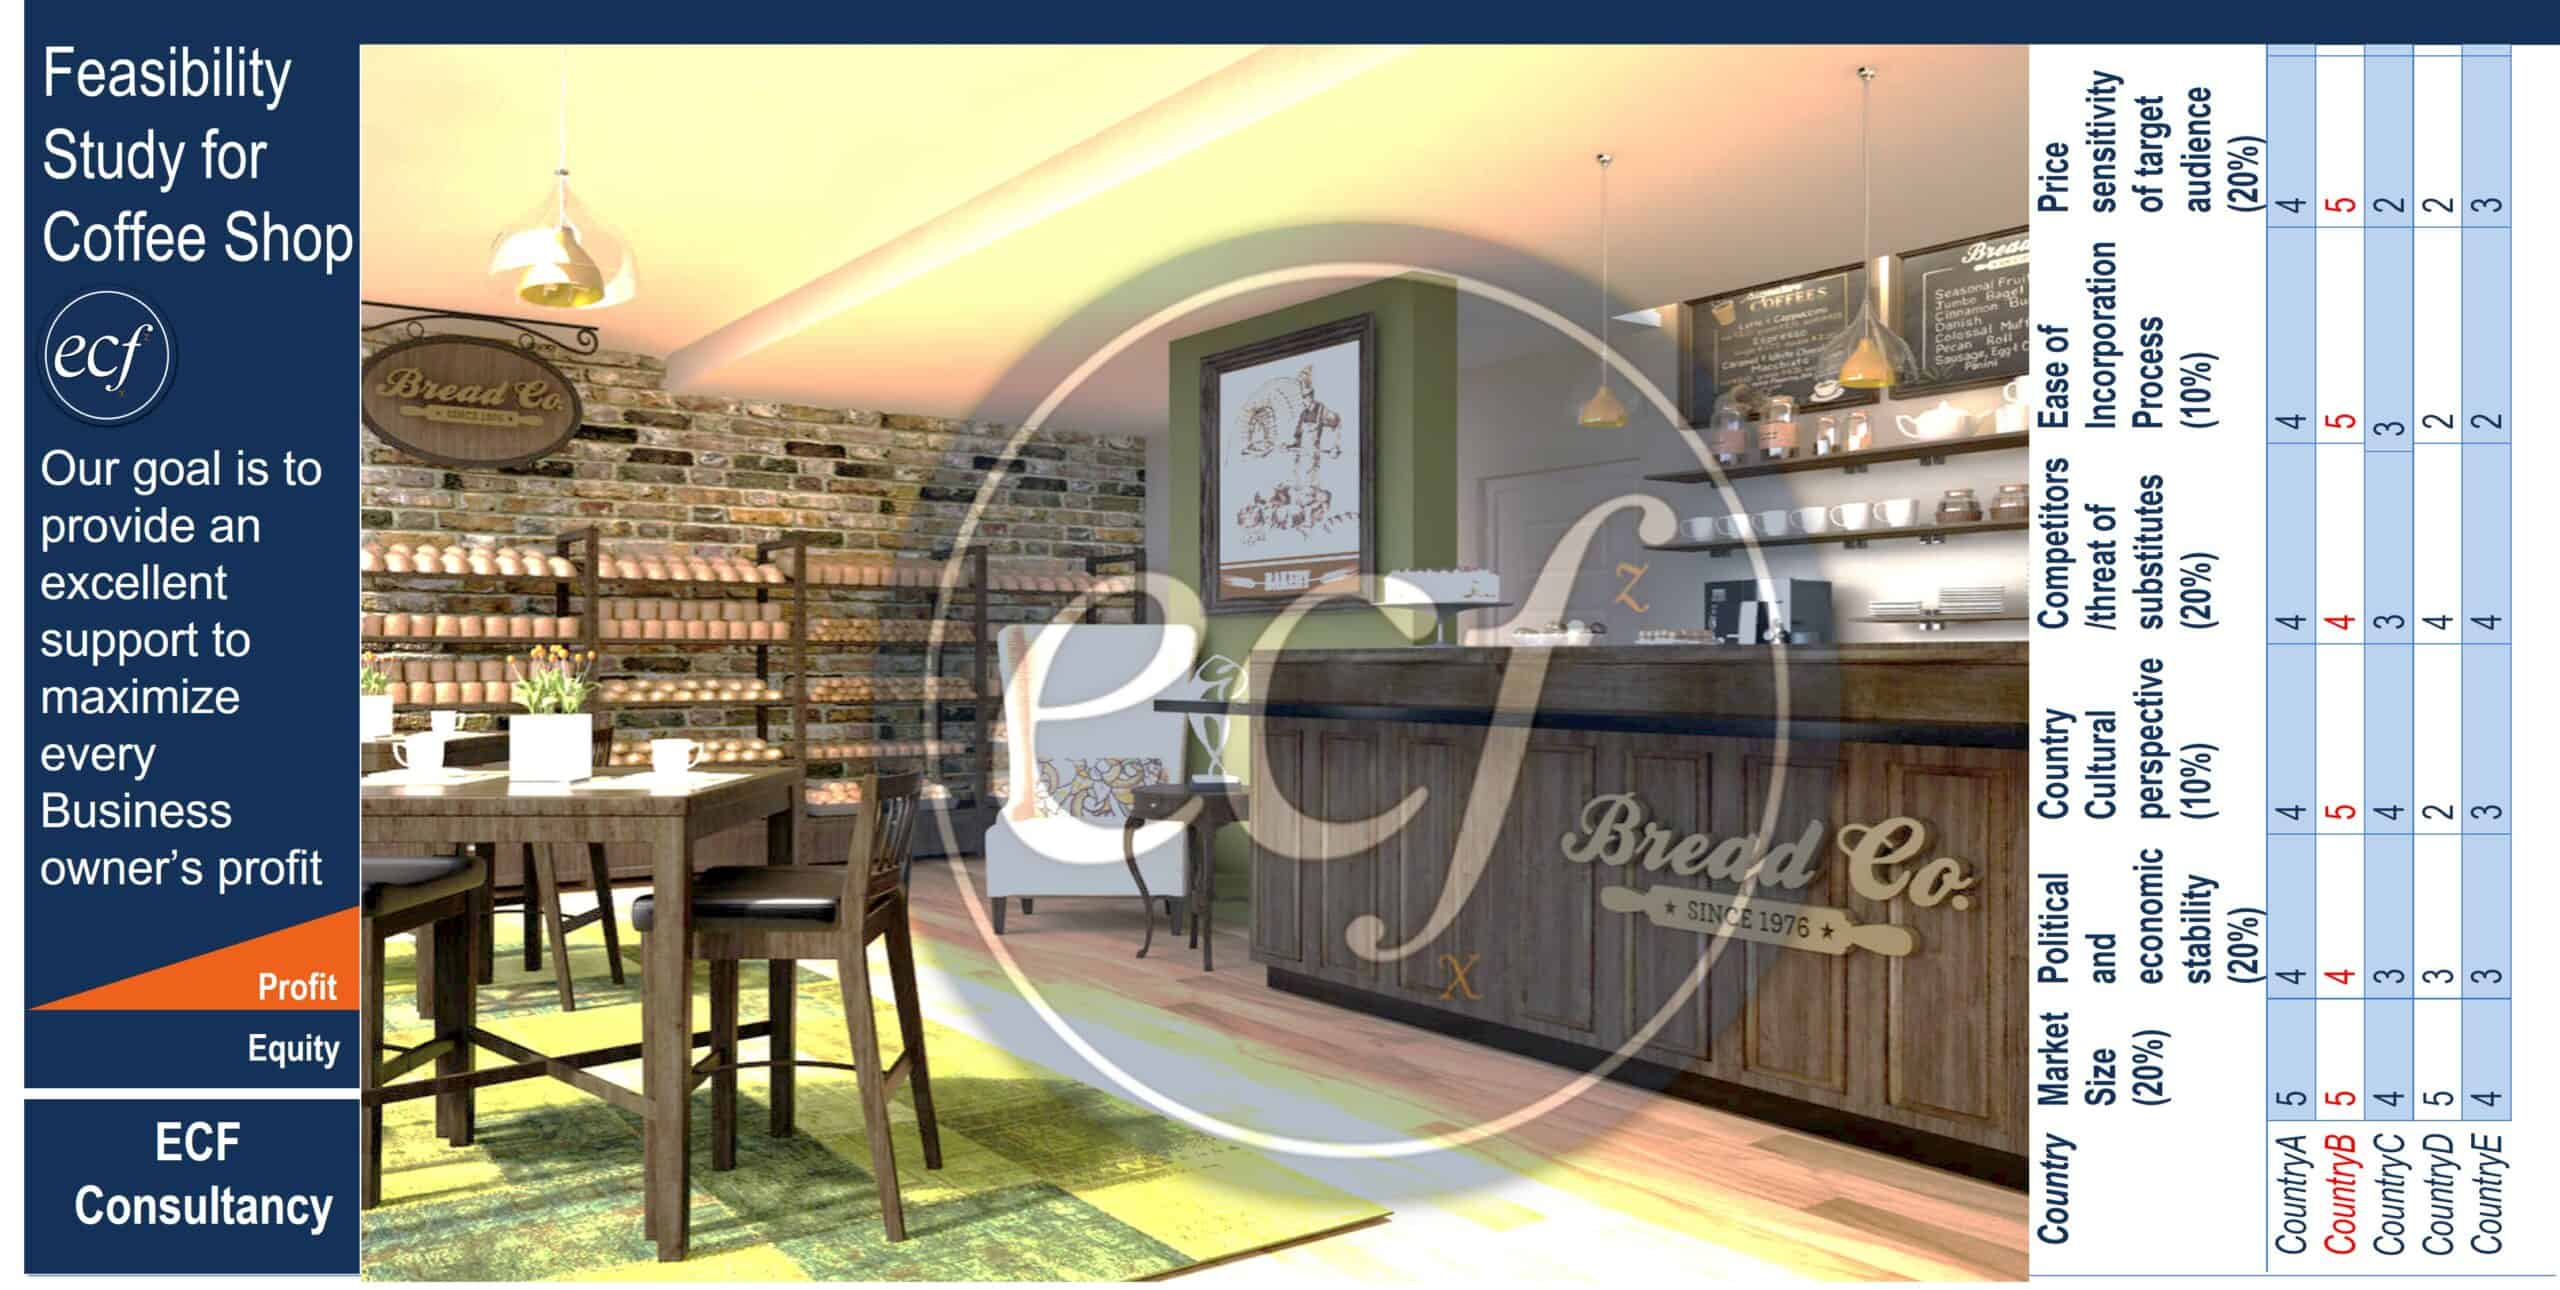
Market Entry Feasibility Study for Coffee Shops In...
This model include market entry feasibility study in word format and business plan to convert the li... Read more
Coffee Shop Financial Model Excel Template
The Coffee Shop Financial Model helps entrepreneurs, founders, business owners, consultants, and ana... Read more
Gourmet Food Store Financial Model Excel Template
The Gourmet Food Store Financial Model helps entrepreneurs, founders, business owners, consultants, ... Read more
Juice Bar Financial Model Excel Template
The Juice Bar Financial Model helps entrepreneurs, founders, consultants, analysts, and business own... Read more
Food And Drink Marketplace Financial Model Excel T...
The Food and Drink Marketplace Financial Model helps founders, entrepreneurs, consultants, analysts,... Read more
Bubble Tea Cafe Financial Model Excel Template
The Bubble Tea Shop Financial Model helps entrepreneurs and business planners turn a boba tea concep... Read more
Tea Cafe Financial Model Excel Template
The Tea Room Financial Model helps entrepreneurs, operators, consultants, and business planners turn... Read more
Confectionery Shop Financial Model Excel Template
The Confectionery Shop Financial Model helps turn a candy shop, sweet shop, dessert retail concept, ... Read more
Tea Store Financial Model Excel Template
The Tea Shop Financial Model Financial Model Template helps entrepreneurs, founders, consultants, an... Read more
You must log in to submit a review.