
0 ITEMS

US Distilleries 2026-2031: $7B Base Case After the Bourbon Bubble
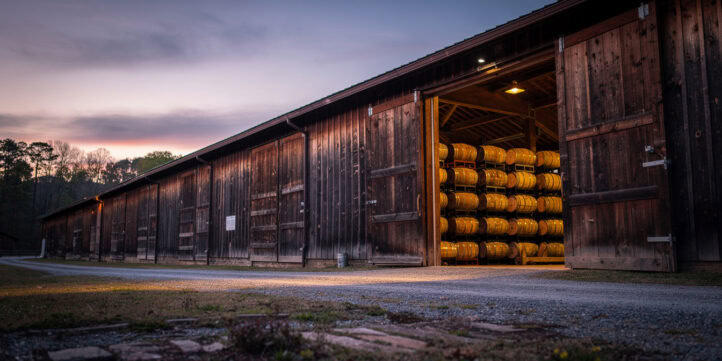
The US distilleries market is on track for roughly $7.0 billion in whiskey and bourbon segment revenue by 2031 under the Base Case — a 2.0–2.5% CAGR from IBISWorld’s $6.3 billion 2026 baseline, inside a Bear/Bull envelope of $5.5 billion to $9.0 billion. That modest headline hides a contradiction: the industry enters 2026 holding a record 17.1 million aging barrels in Kentucky while cutting distillation production 28% year-over-year. Clearing that glut takes three to five years under the Base Case, and the export side remains hostage to the EU’s suspended 50% tariff and Canada’s delisting of US spirits. What follows is the Bear/Base/Bull framework, the unit economics per proof gallon, and where the 2026-2031 opportunities actually sit for investors and operators.
Key Takeaways
- The Base Case projects US whiskey and bourbon distillery segment revenue reaching $7.0 billion by 2031 (2.0–2.5% CAGR from a $6.3 billion 2026 baseline), with a Bear/Bull envelope of $5.5 billion to $9.0 billion.
- Kentucky held 17.1 million aging barrels at end-2025, assessed at $10 billion and generating a $75 million barrel-tax bill — up 163% over five years — though Kentucky HB 5’s phase-out began 1 January 2026 at 96% taxable, declining 4 percentage points per year to 0% in 2043.
- Bulk new-fill barrel prices collapsed 40%, from approximately $1,000 per barrel at the 2022 peak to $600 by 2025-2026, creating a distressed-asset acquisition window through 2028.
- US spirits exports hit a record $2.4 billion in 2024, with American whiskey accounting for $1.3 billion (54% of total), but preliminary 2025 data shows a ~9% year-on-year decline as Canadian tariffs and EU normalisation took hold.
- GLP-1 receptor agonists (drugs like Ozempic and Wegovy) reduced drinking frequency by 29% among users (from 3.1 to 2.2 days per week), compounding a structural demand headwind alongside Gen-Z lower per-capita consumption.
- The TTB codified the American Single Malt Whisky standard of identity in December 2024, creating a structurally undersupplied premium category and a strategic opportunity for early movers through 2028.
The Industry Today: Record Inventory Meets a Production Correction
The US distillery industry is past the peak of the bourbon bubble and into a multi-year correction. The USA Distilleries Market Study 2026-2031 documents the four structural forces that will define the 2026-2031 period: EU tariff trajectory, Canada delisting persistence, bourbon-glut clearance timing, and demand-side category headwinds from GLP-1 prescribing and generational consumption shifts.
Kentucky’s 17.1 million aging barrels at end-2025 represent approximately 7 to 9 years of normal-rate shipments at current global American whiskey volumes. Jim Beam announced a 2026 production pause at its flagship Clermont distillery, and MGP Ingredients — the dominant bulk-whiskey and contract-distilling supplier — reported a 68% collapse in 2024 gross profit per its public company filings. These are not isolated events; they confirm a category-wide supply correction.
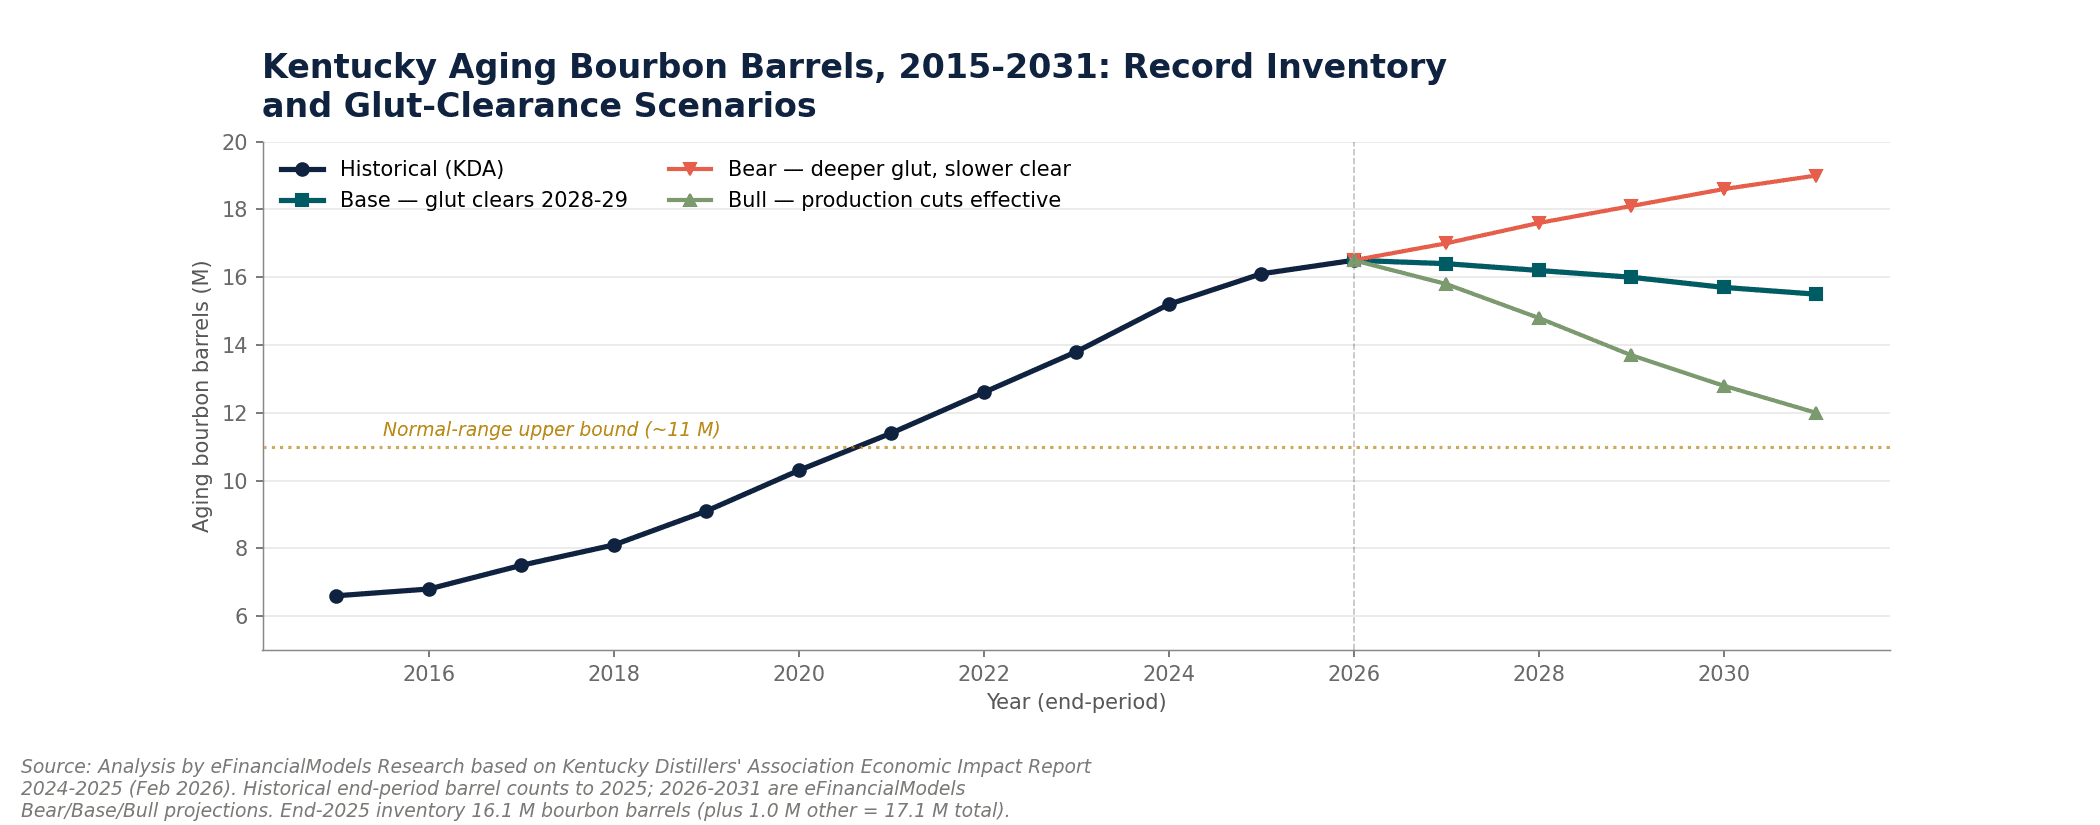
Kentucky’s aging barrel inventory grew from roughly 8 million barrels in 2015 to 17.1 million at end-2025 — a 7-to-9-year supply overhang at current shipment rates.
Bourbons must be distilled from a mash of at least 51% corn (TTB), aged in new charred oak containers, and distilled to no more than 80% ABV per 27 CFR 5.143(c)(3) — the federal standard that also defines the aging programs locking 4 to 12 years of working capital into inventory. That long-cycle structure means the 2026 vintage of build-or-buy decisions sets the realisation profile through 2034.
Bear / Base / Bull Scenario Framework
The three scenarios for US whiskey 2026-2031 hinge on four interlocking drivers: EU tariff trajectory, Canada delisting persistence, bourbon-glut clearance depth, and GLP-1 demand drag.
| Scenario | 2031 Revenue | Implied CAGR | FOB/PG | Gross Margin |
|---|---|---|---|---|
| Bear | $5.5B | -2.7% | $17.00 | 15% |
| Base | $7.0B | +2.1% | $20.00 | 30% |
| Bull | $9.0B | +7.4% | $24.00 | 45% |
The Bear Case assumes EU tariff snapback to 50%, GLP-1 prescribing accelerating to 25%+ of US adults, and a glut-driven price war. The Bull Case assumes a trade-agreement carve-out for spirits, GLP-1 prescribing plateauing, and premium-segment re-acceleration. The Base Case anchors on IBISWorld’s $6.3 billion 2026 baseline and a 2.0–2.5% CAGR.
The wide $3.5 billion envelope between Bear and Bull reflects genuine binary uncertainty: the EU tariff was suspended through 5 February 2026 under an August 2025 US-EU framework, and the post-February trajectory remained the largest near-term export shock at the time of writing.
Worked Example: Unit Economics for a Mid-Scale Bourbon Distiller
Here’s the math for a reference 1 million proof-gallon-per-year (PG/yr) mid-scale bourbon distiller with a 6-year average aging cycle under the Base Case. A proof gallon (PG) equals one US gallon at 50% ABV (100 proof) — the standard volume unit for US spirits taxation and production reporting.
Revenue and cost build per PG (Base Case):
- FOB revenue: $20.00 per PG
- Corn input cost: $1.80 per PG (9% of revenue)
- Barrel cost: $3.50 per PG (17.5% of revenue)
- Aging carry cost (including Kentucky barrel tax): $4.00 per PG (20% of revenue)
- Packaging and bottling: $1.50 per PG
- Plant labor and overhead: $2.00 per PG
- Federal Excise Tax (blended rate): $10.00 per PG
- Total costs per PG: $22.80
- Gross margin (producer level, before SG&A): 30%
The Federal Excise Tax (FET) is $13.50 per proof gallon at the standard rate (TTB), but the Craft Beverage Modernization Act (CBMA) — a permanent provision since 2020 — reduces the rate to $2.70 per PG on the first 100,000 PG removed annually, which is why the blended rate for a 1 million PG producer averages lower than the headline $13.50.
In the Bear Case, FOB revenue drops to $17.00 per PG while costs rise (corn to $2.10, barrels to $4.20, aging carry to $5.00), compressing gross margin to 15%. In the Bull Case, FOB revenue rises to $24.00 per PG with lower input costs, expanding gross margin to 45%.
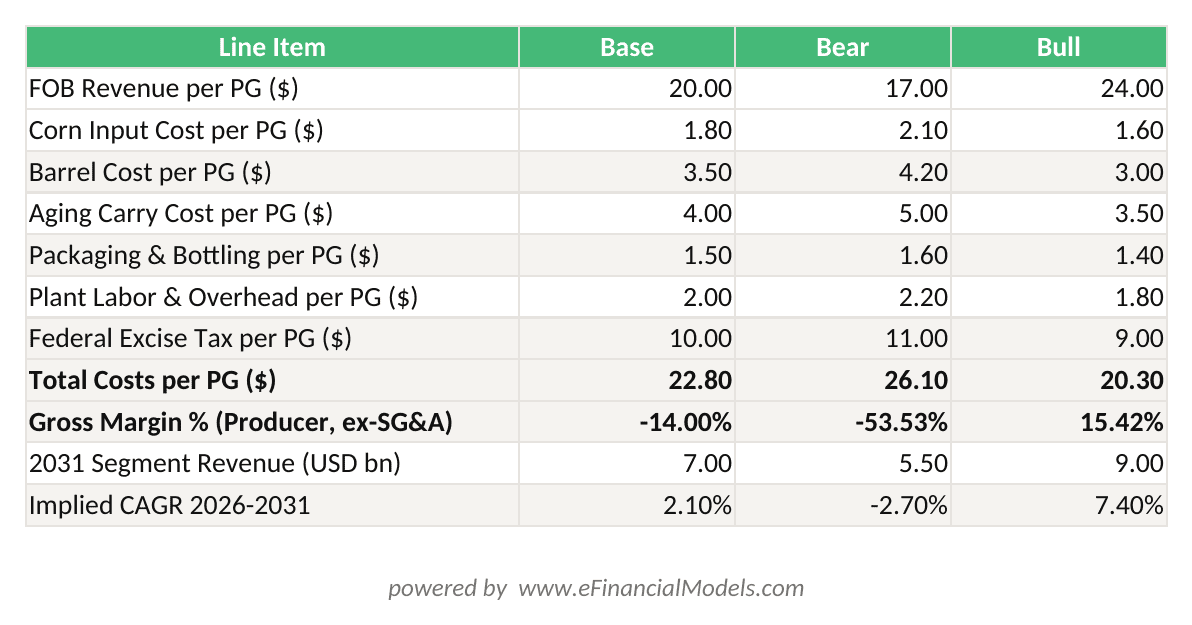
Base Case gross margin of 30% compresses to 15% in the Bear scenario as FOB revenue falls to $17/PG and input costs rise — a 50% margin reduction from a 15% revenue decline.
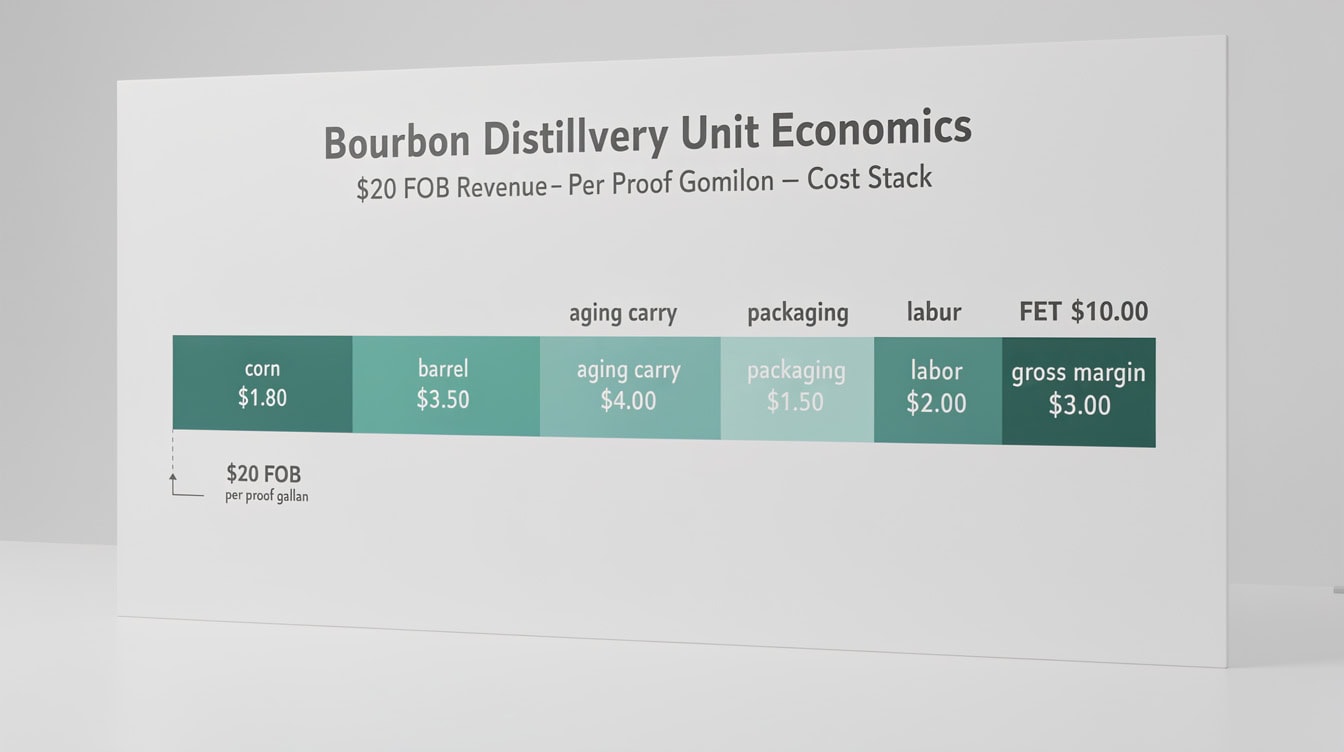
At $20.00 FOB per proof gallon, aging carry cost alone consumes 20% of revenue — the Kentucky barrel tax is the cost line most financial models underestimate.
Supply-Side Analysis: The Glut and the Capex Stack
The bourbon glut is the central pricing-and-margin theme for 2026-2031. Kentucky’s 17.1 million aging barrels at end-2025 — assessed at $10 billion and generating a $75 million state property-tax bill that rose 163% over five years according to Kentucky Distillers’ Association economic-impact data — will take 3 to 5 years to clear under the Base Case.
The 28% year-on-year cut in distillation production through August 2025 signals the industry is responding, but the Base Case assumes inventory only declines to 15.5 million barrels by end-2031. Returning to a normal 10 to 12 million barrel inventory level (consistent with pre-2018 ratios to shipments) requires either deeper production cuts or demand growth the demand-side analysis does not support.
For a greenfield 1 million PG/yr bourbon distillery, the capex stack breaks down as follows: warehouse (rickhouses) at 35% of total capex is the largest single line, because a 6-year aging cycle requires roughly 6 million PG of warehouse capacity built into the project from day one. Distillation columns and pot stills account for 18%, mash and fermentation systems 12%, bottling lines 10%, utilities and site work 10%, engineering and project management 8%, and contingency 7%.
New charred American white oak barrels — required by federal standard for bourbon — are the second-largest input cost after corn. Barrel costs spiked to $250+ per new-fill barrel during the 2021-2023 demand peak and have since softened to approximately $180 to $200 per barrel as production cuts reduce demand from cooperages including Independent Stave Company and Brown-Forman’s in-house cooperage.
Demand-Side Analysis: Exports, GLP-1, and the RTD Shift
US spirits exports hit a record $2.4 billion in 2024, with American whiskey accounting for $1.3 billion (54% of the total) per the DISCUS 2024 American Spirits Exports Report. The top five destination markets for American whiskey were the EU ($699 million), Australia ($113 million), the UK ($86 million), Japan ($79 million), and Canada ($73 million). The 2024 EU surge (+39% year-on-year) reflected pre-emptive shipments ahead of the threatened reinstatement of the EU 50% retaliatory tariff — meaning 2025 exports to the EU normalised sharply from that pull-forward.
Canada’s delisting is more structural than cyclical. Ontario’s LCBO halted US liquor sales on 2 February 2025, completed formal shelf removal on 4 March 2025, and the federal 25% tariff took effect 13 March 2025. The $79.1 million of unsold US spirits inventory the LCBO was still warehousing more than a year later — per CBC News reporting — signals the second-largest US whiskey export market is not snapping back quickly.
Gallup polling documented the share of US adults consuming alcohol falling from 62% to 54% over a two-year window. Research from the Fralin Biomedical Research Institute at Virginia Tech documented that GLP-1 receptor agonists (semaglutide and tirzepatide, sold as Ozempic, Wegovy, Mounjaro, and Zepbound) reduced drinking frequency by approximately 29% in user populations, from 3.1 days per week pre-medication to 2.2 days per week post-medication. The Base Case applies a 4 percentage-point demand drag from GLP-1 prescribing (assuming penetration plateaus around 18% of US adults); the Bear Case applies a 7 percentage-point drag.
The fastest-growing US spirits sub-category in 2025 was spirits ready-to-drink (RTD) cocktails, up 16.4% to $3.8 billion in revenue per DISCUS. A portion of this growth represents substitution away from neat whiskey occasions — most acute in Gen-Z and younger millennial cohorts.
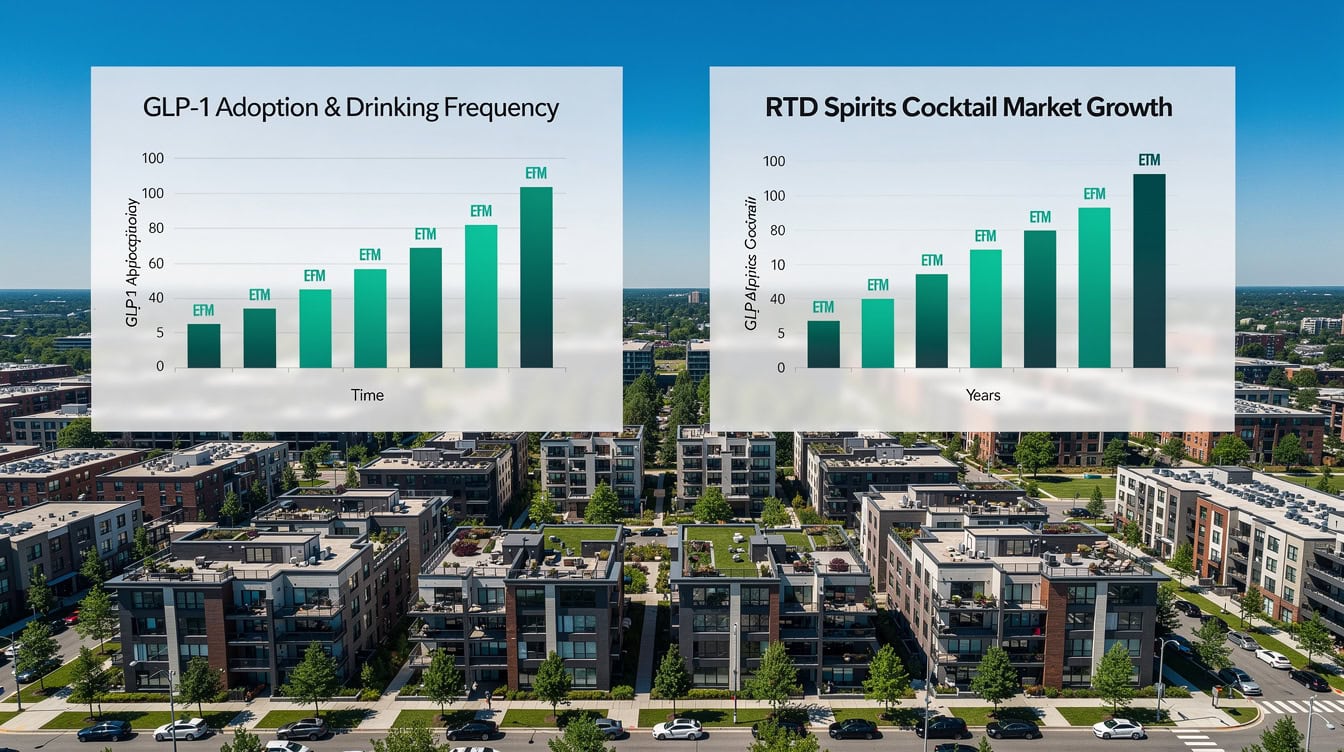
Two demand forces pulling in opposite directions: GLP-1 drugs cutting drinking frequency 29% among users, while RTD spirits cocktails grew 16.4% to $3.8 billion in 2025.
Regulatory and Policy Context
Four regulatory developments materially affect the 2026-2031 outlook.
First, the TTB (Alcohol and Tobacco Tax and Trade Bureau, the US Treasury agency that regulates spirits) codified the American Single Malt Whisky (ASM) standard of identity in December 2024, effective 19 January 2025. ASM requires 100% malted barley, production at a single US distillery, distillation to no more than 80% ABV, aging in oak barrels of no more than 700 liters (TTB), and bottling at minimum 40% ABV per 27 CFR 5.143. This creates a structurally undersupplied premium category: Westland Distillery (Rémy Cointreau-owned) and Stranahan’s (Proximo Spirits) are the deepest-inventoried producers, but the category brand leadership race remains open through 2028.
Second, the One Big Beautiful Bill Act (OBBBA), signed 4 July 2025, made the Section 199A pass-through deduction permanent and raised the Puerto Rico/USVI cover-over cap from $10.50 to $13.25 per proof gallon effective 2026. The cover-over cap raise benefits rum producers in Puerto Rico and the USVI more than US whiskey producers, but the permanent Section 199A deduction is a net positive for pass-through distillery operators.
Third, Kentucky HB 5’s barrel-tax phase-out began 1 January 2026 at 96% taxable, declining 4 percentage points per year to 0% in 2043. The aging carry cost in the unit-economics model declines by approximately 0.8 percentage points per year as the phase-out progresses — a real but partial offset to export-tariff drag.
Fourth, the EU’s 50% retaliatory tariff on American whiskey was suspended through 5 February 2026 under the August 2025 US-EU trade-agreement framework. The post-February tariff trajectory is the single largest binary event for 2026 export modeling.
Common Mistakes Investors and Operators Make
The bourbon glut and regulatory complexity create predictable analytical errors. Here are five specific mistakes and how to fix them.
1. Treating the glut as a short-cycle inventory correction. The 17.1 million aging barrels represent 7 to 9 years of normal-rate shipments. Fix: model inventory clearance through 2029 at minimum, not 2026-2027.
2. Assuming Canada delisting reverses quickly. The $79.1 million LCBO warehousing cost signals structural rather than cyclical disruption. Fix: model Canada export revenue at 50% of 2024 levels through 2027 in the Base Case.
3. Ignoring the GLP-1 demand drag on volume. The 29% reduction in drinking frequency among GLP-1 users is a volume headwind, not a value headwind — premium-segment mix-up partially offsets value compression. Fix: apply the demand drag to volume, not to revenue, and model bifurcation between value-tier compression and luxury-tier resilience.
4. Underestimating aging carry cost. Many financial models omit the Kentucky barrel tax from aging carry cost. At $4.00 per PG in the Base Case (20% of FOB revenue), it is the third-largest cost line. Fix: include assessed-value ad valorem tax plus capital cost times variable interest rate times years aging in every distillery model.
5. Launching a greenfield craft distillery in 2026-2028. The supply-demand balance does not support new entry during the glut clearance window. Fix: target distressed-asset acquisition of craft DSPs (Distilled Spirits Plants) with strong brand positioning but weak balance sheets, where aged inventory can be acquired at a discount to replacement cost.
Investment Opportunities and Strategic Recommendations
The 2026-2031 opportunity set concentrates in five themes.
Distressed-asset acquisition during 2026-2028 is the most actionable near-term opportunity. Bulk new-fill barrel prices fell from $1,000 to $600 per barrel — a 40% decline — creating entry points for buyers willing to negotiate revised contract terms with MGP-adjacent and Bardstown-adjacent contract distillers whose revenue has collapsed.
American Single Malt category leadership is an attractive premium-segment play through 2028, before brand recognition consolidates around one or two leaders. The category is structurally undersupplied because the TTB rule only took effect in January 2025 and aged inventory takes 2+ years to build.
DTC and visitor-economy revenue capture offers structurally higher margins than the wholesale channel because the producer captures the distributor markup (25-30%) and retailer markup (30-35%). The Kentucky Bourbon Trail visitor economy supports $1.45 billion in planned bourbon-industry capex, much of it visitor-experience and DTC-channel related per Kentucky Distillers’ Association data.
For public-equity analysts: Brown-Forman is the cleanest US-listed pure-play on US whiskey but carries EU tariff and Canada delisting exposure through its Jack Daniel’s franchise. MGP Ingredients is the bulk-market proxy and remains highly leveraged to glut clearance timing.
For financial modellers: the USA Distilleries Market Study 2026-2031 provides sector-level benchmarks including capacity utilisation (60-70% for major producers in 2026-2027, recovering to 75-85% by 2028-2029 under the Base Case), corn cost share (8-12% of revenue), barrel cost share (15-18% of revenue), and working-capital cycle (4 years for Straight Bourbon, 6-9 years for premium, 10+ years for super-premium and luxury).
Comparable market studies for other geographies are available for the United Kingdom, Ireland, and France distilleries markets.
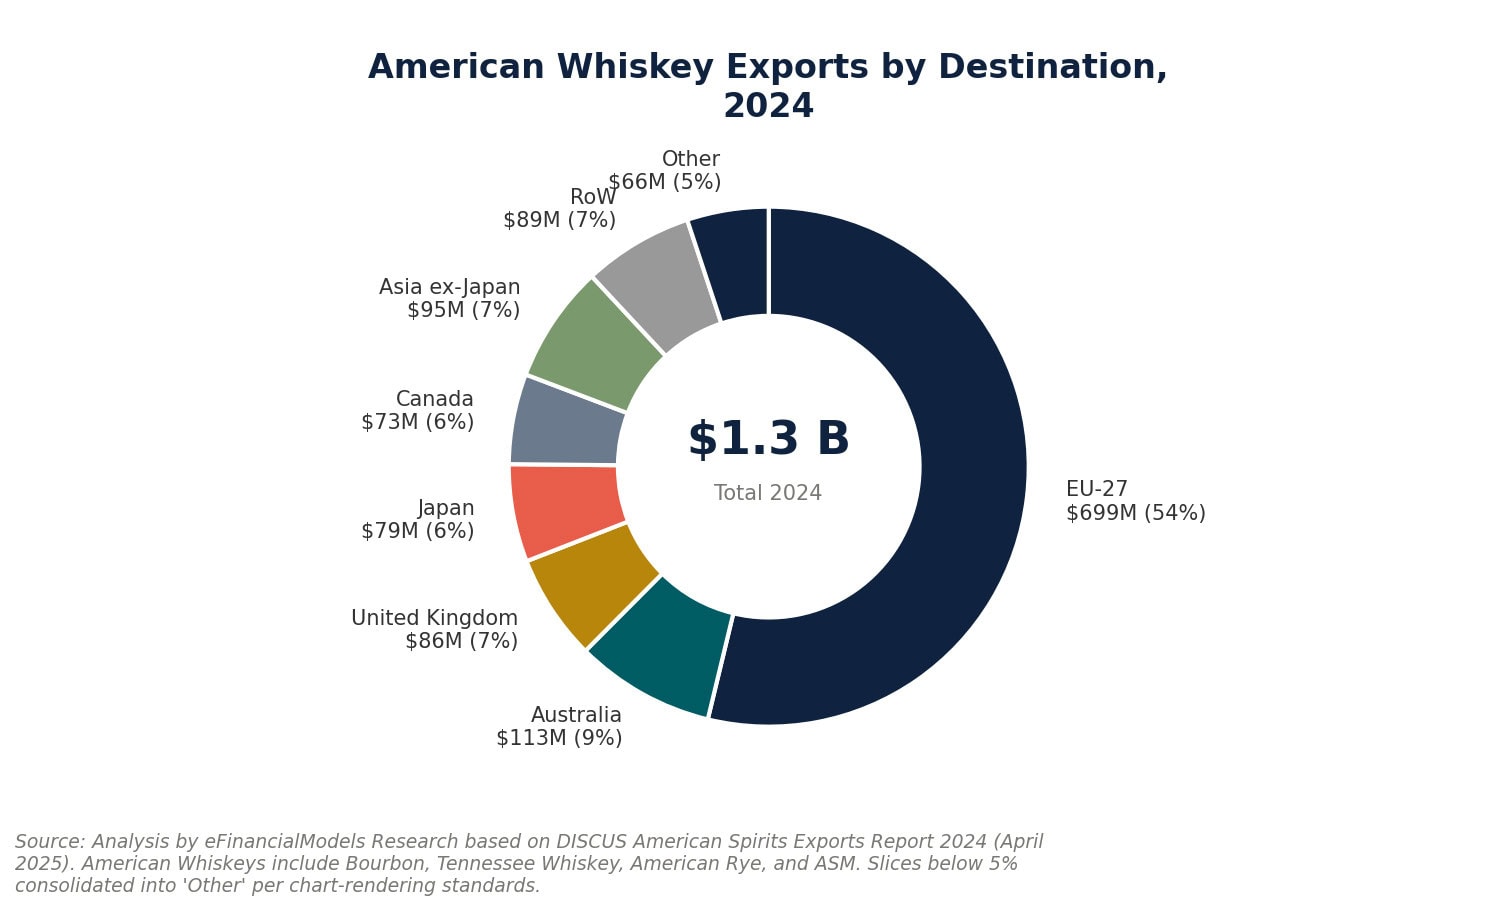
US whiskey exports hit $1.3 billion in 2024, but two of the top five markets — the EU ($699M) and Canada ($73M) — face active tariff and delisting disruptions heading into 2026.
Frequently Asked Questions
What is the Base Case revenue forecast for the US whiskey market by 2031?
The Base Case projects US whiskey and bourbon distillery segment revenue reaching $7.0 billion by 2031, representing a 2.0-2.5% compound annual growth rate (CAGR) from IBISWorld’s $6.3 billion 2026 baseline. This assumes the EU trade-agreement carve-out for spirits holds post-February 2026, GLP-1 prescribing plateaus around 18% of US adults (applying a 4 percentage-point volume drag), and the bourbon glut clears to approximately 15.5 million aging barrels by end-2031. The Bear Case floor is $5.5 billion (-2.7% CAGR) and the Bull Case ceiling is $9.0 billion (+7.4% CAGR). The wide $3.5 billion envelope reflects genuine binary uncertainty around the EU tariff trajectory and glut clearance timing.
How does the bourbon glut affect distillery valuations and investment timing?
The bourbon glut — 17.1 million aging barrels at end-2025, representing 7 to 9 years of normal-rate shipments — has driven bulk new-fill barrel prices down 40%, from approximately $1,000 per barrel at the 2022 peak to $600 by 2025-2026. MGP Ingredients reported a 68% collapse in 2024 gross profit as a direct result. For investors, this creates a 2026-2028 distressed-asset acquisition window: craft DSPs and mid-tier independents with strong brand positioning but weak balance sheets can be acquired with aged inventory at a fraction of replacement cost. The study recommends avoiding greenfield craft starts during this window because the supply-demand balance does not support new entry.
What does the TTB’s American Single Malt Whisky rule mean for investors?
The TTB (Alcohol and Tobacco Tax and Trade Bureau) codified the American Single Malt Whisky (ASM) standard of identity in December 2024, effective 19 January 2025. ASM requires 100% malted barley, production at a single US distillery, distillation to no more than 80% ABV, and aging in oak barrels of no more than 700 liters per 27 CFR 5.143. Because the category is newly codified, aged inventory is structurally undersupplied. Westland Distillery and Stranahan’s are the deepest-inventoried producers, but the category brand leadership race remains open. Investors who acquire or build ASM-eligible production capacity and aged inventory now are positioned for the category’s growth through 2028-2031, before brand recognition consolidates.
How do GLP-1 drugs like Ozempic affect whiskey demand modeling?
GLP-1 receptor agonists (semaglutide and tirzepatide, sold as Ozempic, Wegovy, Mounjaro, and Zepbound) reduce drinking frequency by approximately 29% in user populations, from 3.1 days per week pre-medication to 2.2 days per week post-medication, per research from the Fralin Biomedical Research Institute at Virginia Tech. Gallup polling separately documented the share of US adults consuming alcohol falling from 62% to 54% over a two-year window. For financial modeling, the study applies the GLP-1 drag to volume rather than to value, because premium-segment mix-up partially offsets value-side compression even as volumes decline. The Base Case uses a 4 percentage-point volume drag; the Bear Case uses 7 percentage points.
What are the key cost lines in a bourbon distillery financial model?
For a reference 1 million proof-gallon-per-year mid-scale bourbon distiller with a 6-year aging cycle, the Base Case cost stack per proof gallon is: corn input $1.80 (9% of $20.00 FOB revenue), barrel cost $3.50 (17.5%), aging carry cost including Kentucky barrel tax $4.00 (20%), packaging and bottling $1.50, plant labor and overhead $2.00, and Federal Excise Tax at a blended rate of $10.00. Gross margin at the producer level before SG&A is 30% in the Base Case, compressing to 15% in the Bear Case and expanding to 45% in the Bull Case. The aging carry cost declines by approximately 0.8 percentage points per year as Kentucky HB 5’s barrel-tax phase-out progresses from 96% taxable in 2026 to 0% in 2043.
What is the impact of Canada’s delisting of US spirits?
Canada was the fifth-largest export market for American whiskey at $73 million in 2024. Ontario’s LCBO halted US liquor sales on 2 February 2025, completed formal shelf removal on 4 March 2025, and the federal 25% tariff took effect 13 March 2025. The $79.1 million of unsold US spirits inventory the LCBO was still warehousing more than a year later — per CBC News reporting — signals the disruption is structural rather than cyclical. The study models Canada export revenue at a materially reduced level through 2027 in the Base Case, with recovery contingent on political normalisation and active brand-presence rebuilding by US producers.
How should financial modellers parameterise a US distillery model for 2026-2031?
The study recommends the following sector benchmarks for financial modellers. Capacity utilisation: 60-70% for major producers in 2026-2027, recovering to 75-85% by 2028-2029 under the Base Case. Corn cost: 8-12% of revenue. Barrel cost: 15-18% of revenue. Aging carry cost: 20% of revenue declining approximately 0.8 percentage points per year as Kentucky HB 5 progresses. FOB-to-shelf margin layers: producer FOB, then distributor markup of 25-30%, then state excise (variable by state), then retailer markup of 30-35%. Working-capital cycle: 4 years for Straight Bourbon, 6-9 years for premium, 10+ years for super-premium and luxury. Apply a 10-25% inventory write-down on bulk and uncommitted inventory in the Bear Case; 0-5% in the Base Case.
Conclusion
The US distillery market in 2026-2031 is not a simple growth story or a simple decline story. It’s a bifurcated market: a glut-driven correction in value and standard tiers, a structural opportunity in American Single Malt and premium DTC, and a binary tariff risk that sets the export revenue envelope for the next three years. The producers and investors who navigate this period successfully will be those who model the long-cycle economics honestly, acquire distressed assets at 2026-2028 prices, and build brand equity in undersupplied premium categories before the glut clears.
I recommend downloading the USA Distilleries Market Study 2026-2031 for the full 40+ page analysis including 12 EFM-branded charts, 9 data tables, and the complete Bear/Base/Bull scenario quantification — the operational tool for translating these sector-level conclusions into project-level cash-flow decisions.
























































