
0 ITEMS

Virtual Power Plant Financial Model Excel | 20-Year Distributed Energy, Revenue Stacking & Project Finance
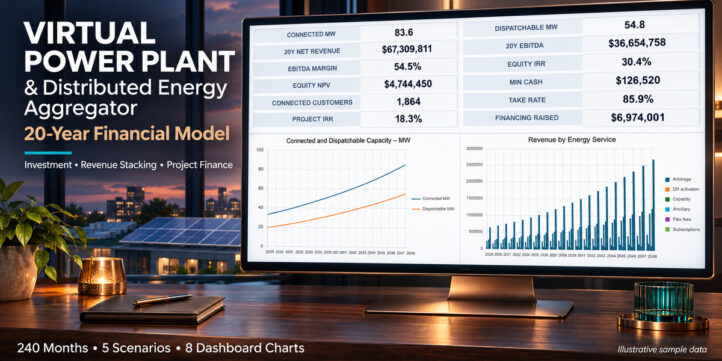
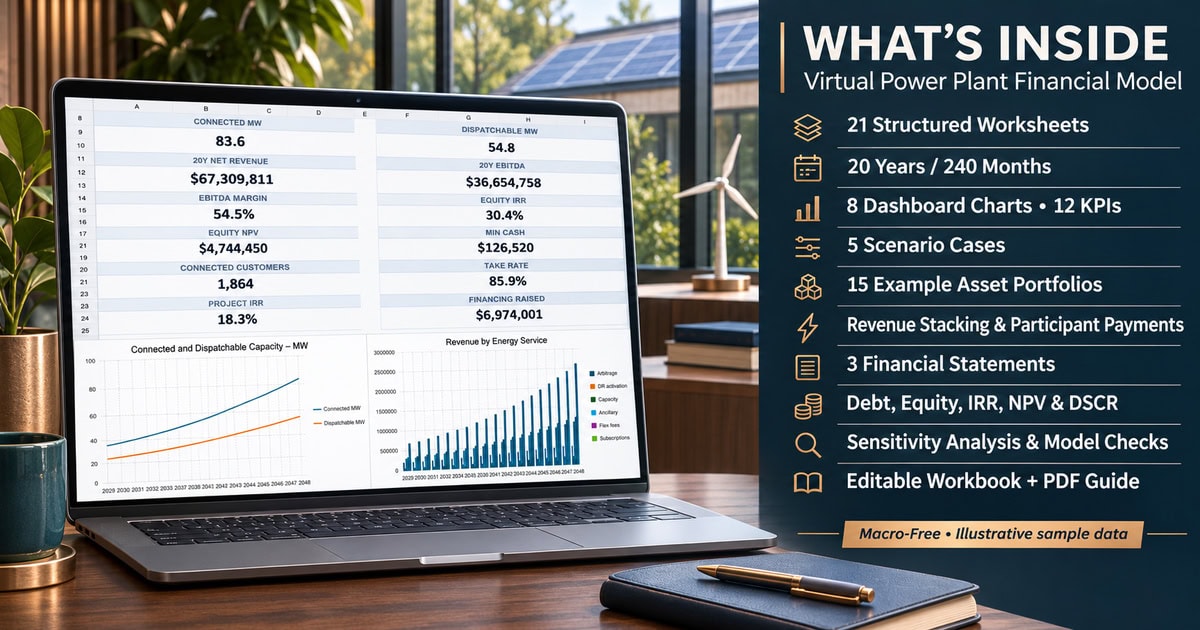
Evaluate a distributed energy aggregator with a 240-month Excel financial model covering 500 prepared asset and contract records, revenue stacking, participant payments, debt, 3 financial statements, 5 indicative scenarios, 12 KPI cards, 8 native charts and an 11-page PDF guide.
VIRTUAL POWER PLANT FINANCIAL MODEL | 20-YEAR PREMIUM EDITION
Distributed Energy • Revenue Stacking • Participant Payments • Project Finance
CONNECT DISTRIBUTED ENERGY ASSETS TO FINANCIAL PERFORMANCE.
Evaluate the economics of a Virtual Power Plant (VPP) using an editable Excel model that connects distributed energy capacity, market revenues, participant payments and long-term financing.
The Virtual Power Plant & Distributed Energy Aggregator Financial Model by SheetworksStudio links battery storage, solar PV, flexible EV charging and demand response to modeled dispatch, operating expenses, cash flow and investment analysis.
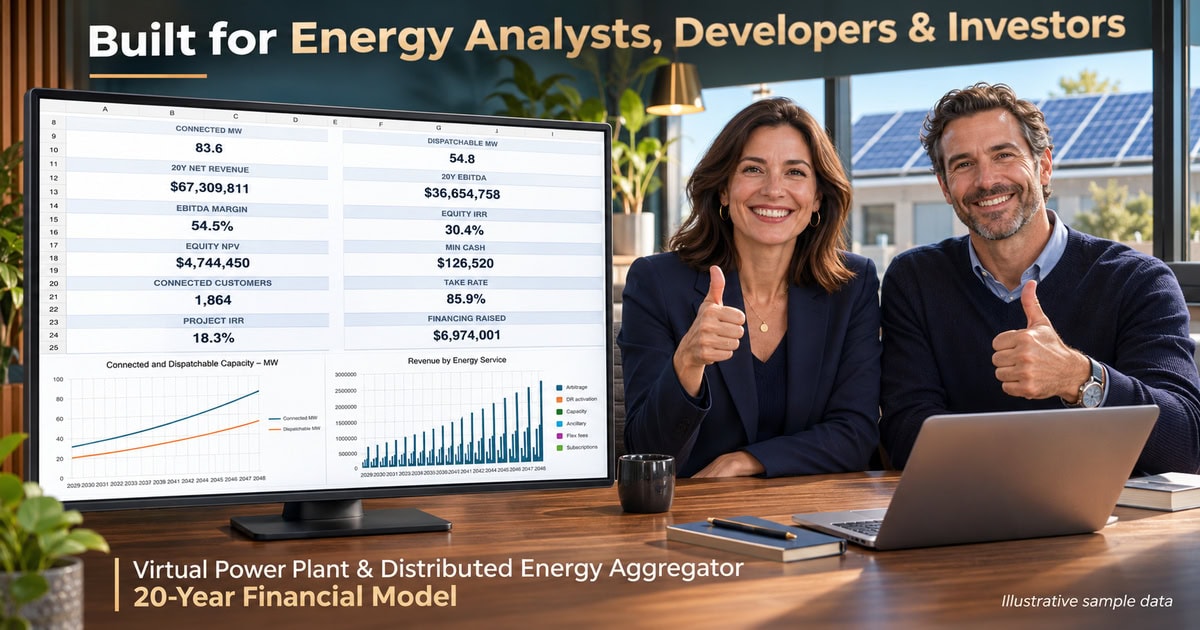
Designed for VPP developers, energy aggregators, renewable-energy analysts, consultants and finance teams, this premium workbook supports assumption-driven project screening and 20-year business planning.
All example data and financial outputs are fictional illustrations, not independently verified forecasts.
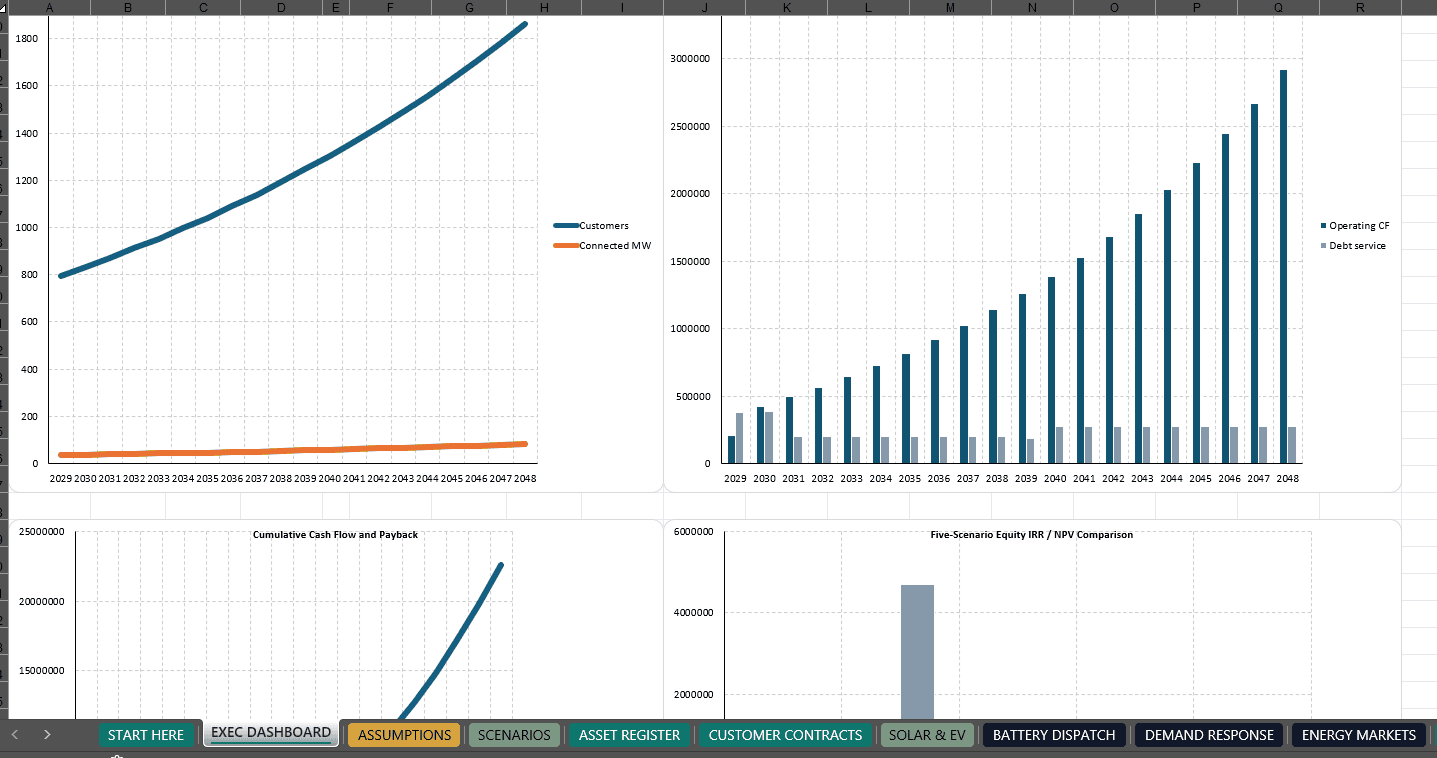
📊 EXECUTIVE DASHBOARD & EIGHT NATIVE CHARTS
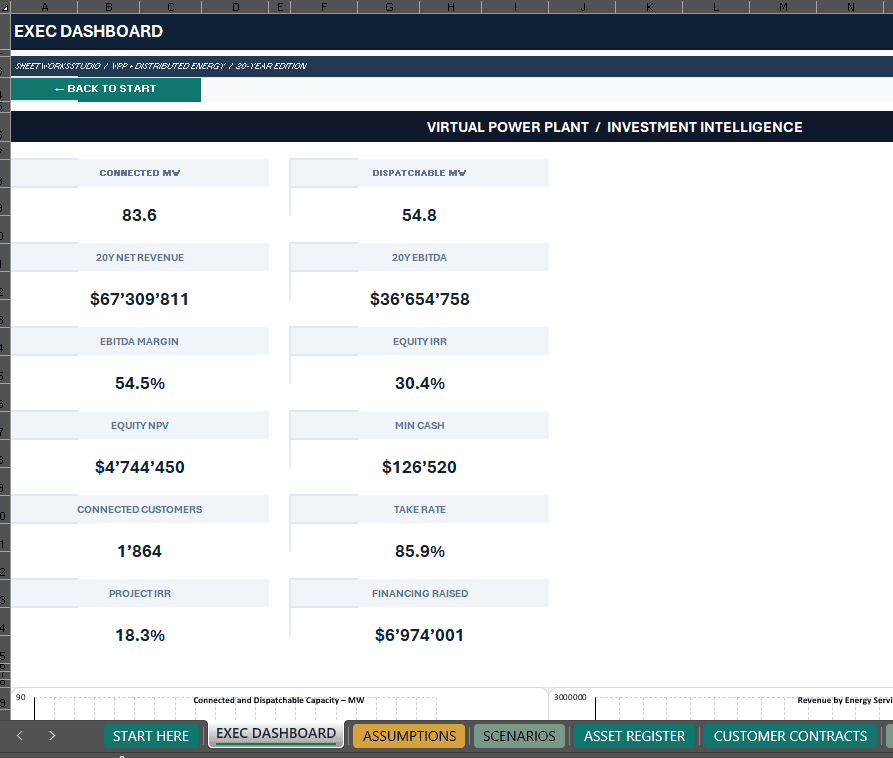
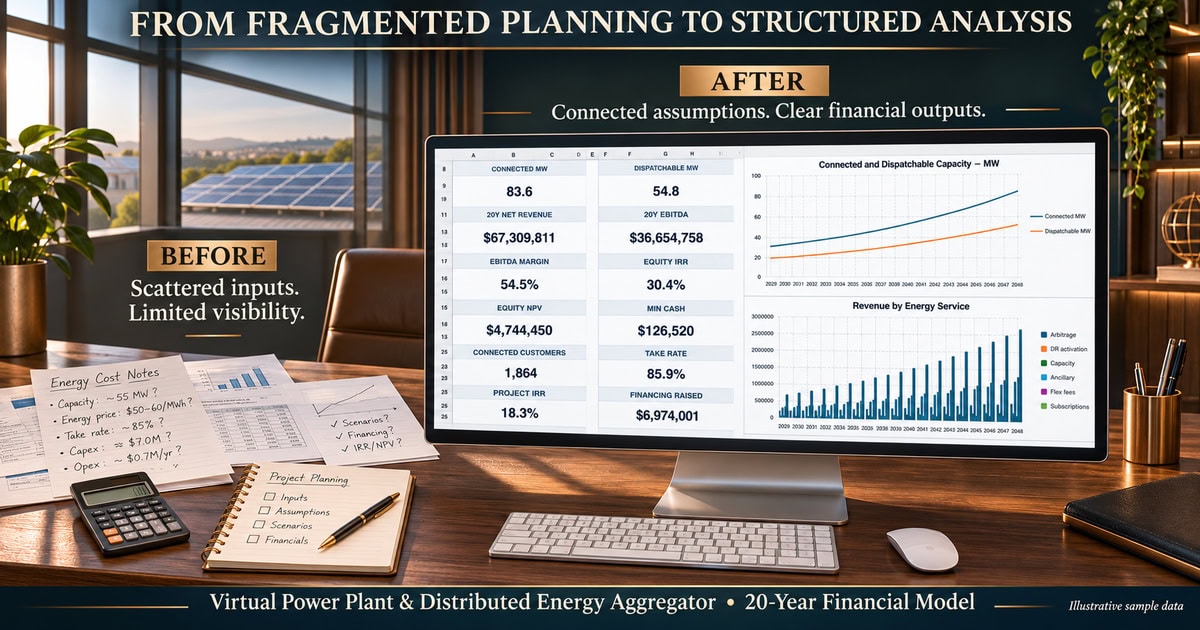
Review twelve executive indicators:
• Connected and Dispatchable Capacity
• 20-Year Net Revenue and EBITDA
• EBITDA Margin
• Equity IRR and Equity NPV
• Minimum Cash
• Connected Customers
• Aggregator Take Rate
• Project IRR
• Financing Raised
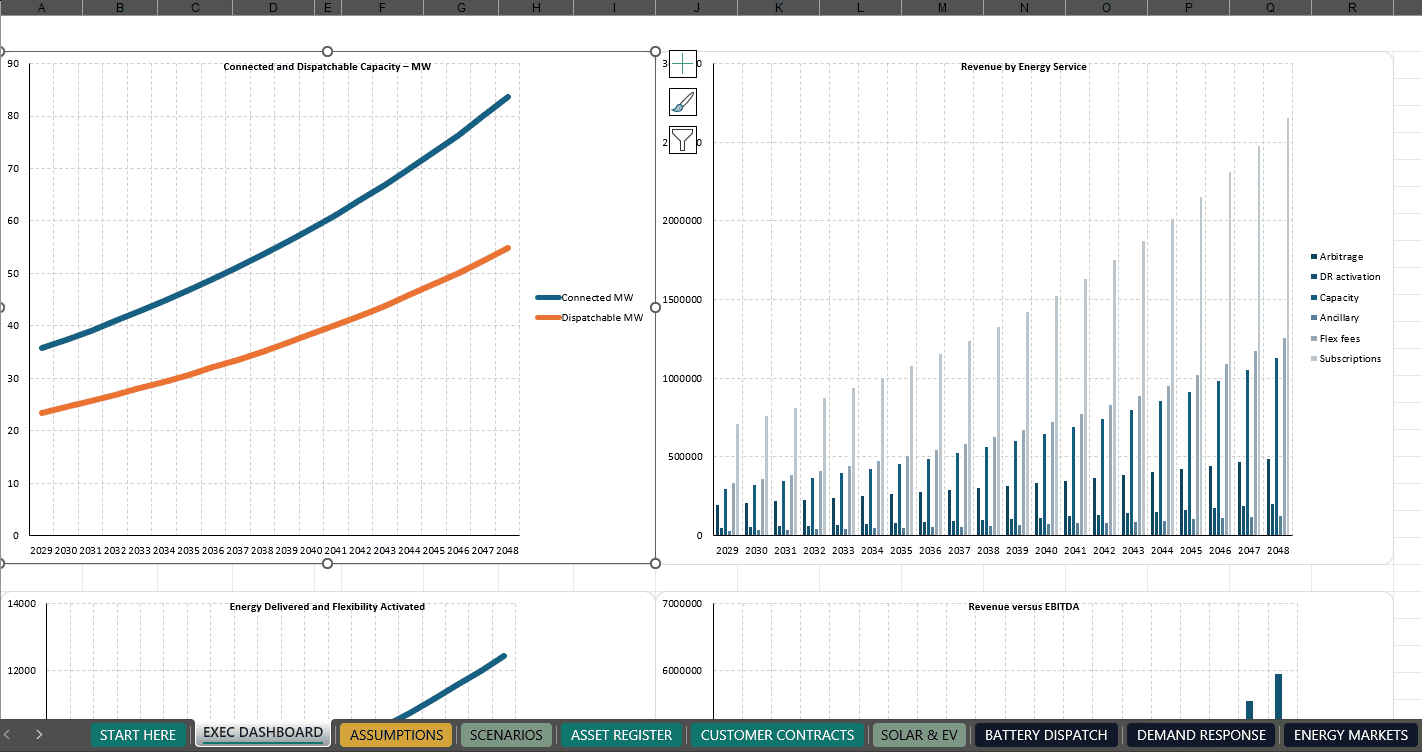
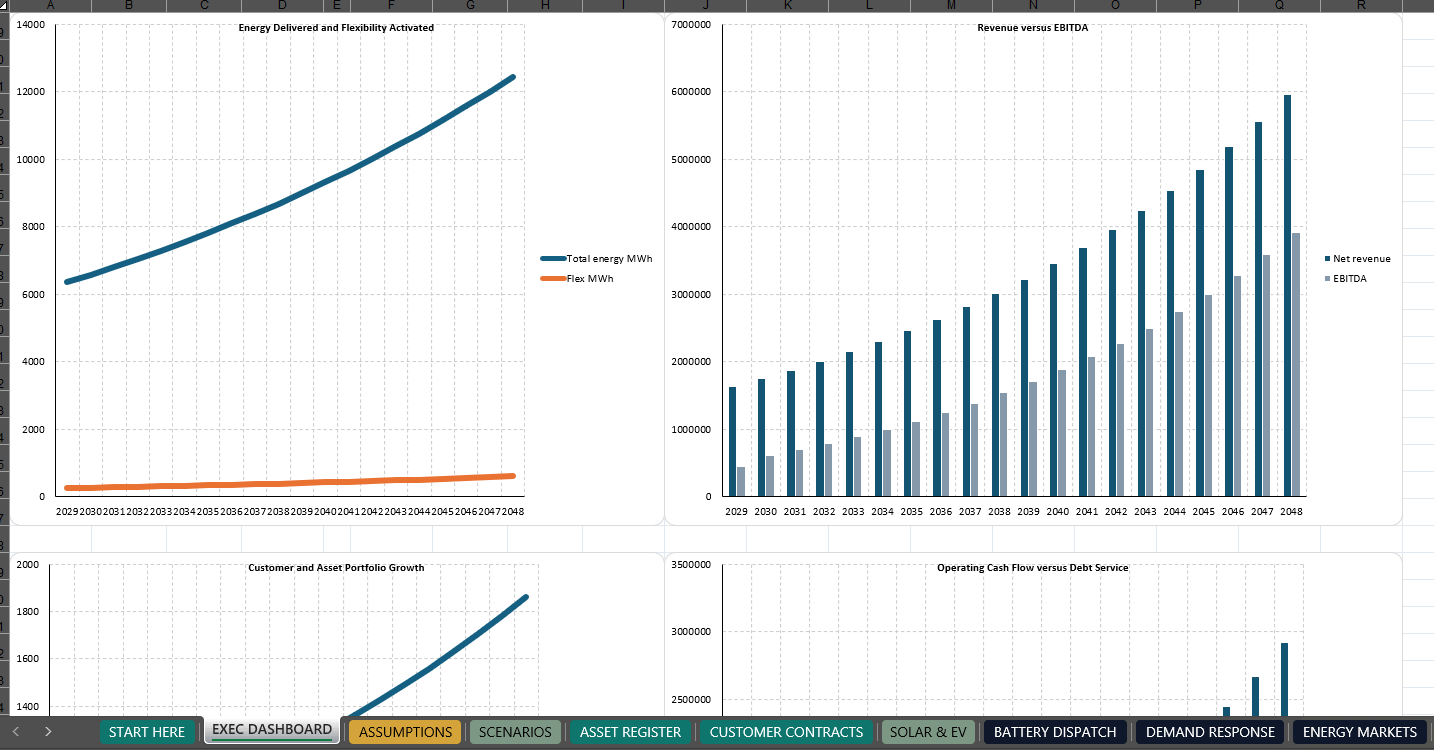
Eight native Excel charts visualize:
- Connected and Dispatchable Capacity
- Revenue by Energy Service
- Energy Delivered and Flexibility Activated
- Revenue versus EBITDA
- Customer and Asset Portfolio Growth
- Operating Cash Flow versus Debt Service
- Cumulative Cash Flow and Payback
- Five-Scenario Investment Comparison
Charts are linked to the underlying workbook calculations.
⚡ DISTRIBUTED ASSET & PARTICIPANT REGISTERS
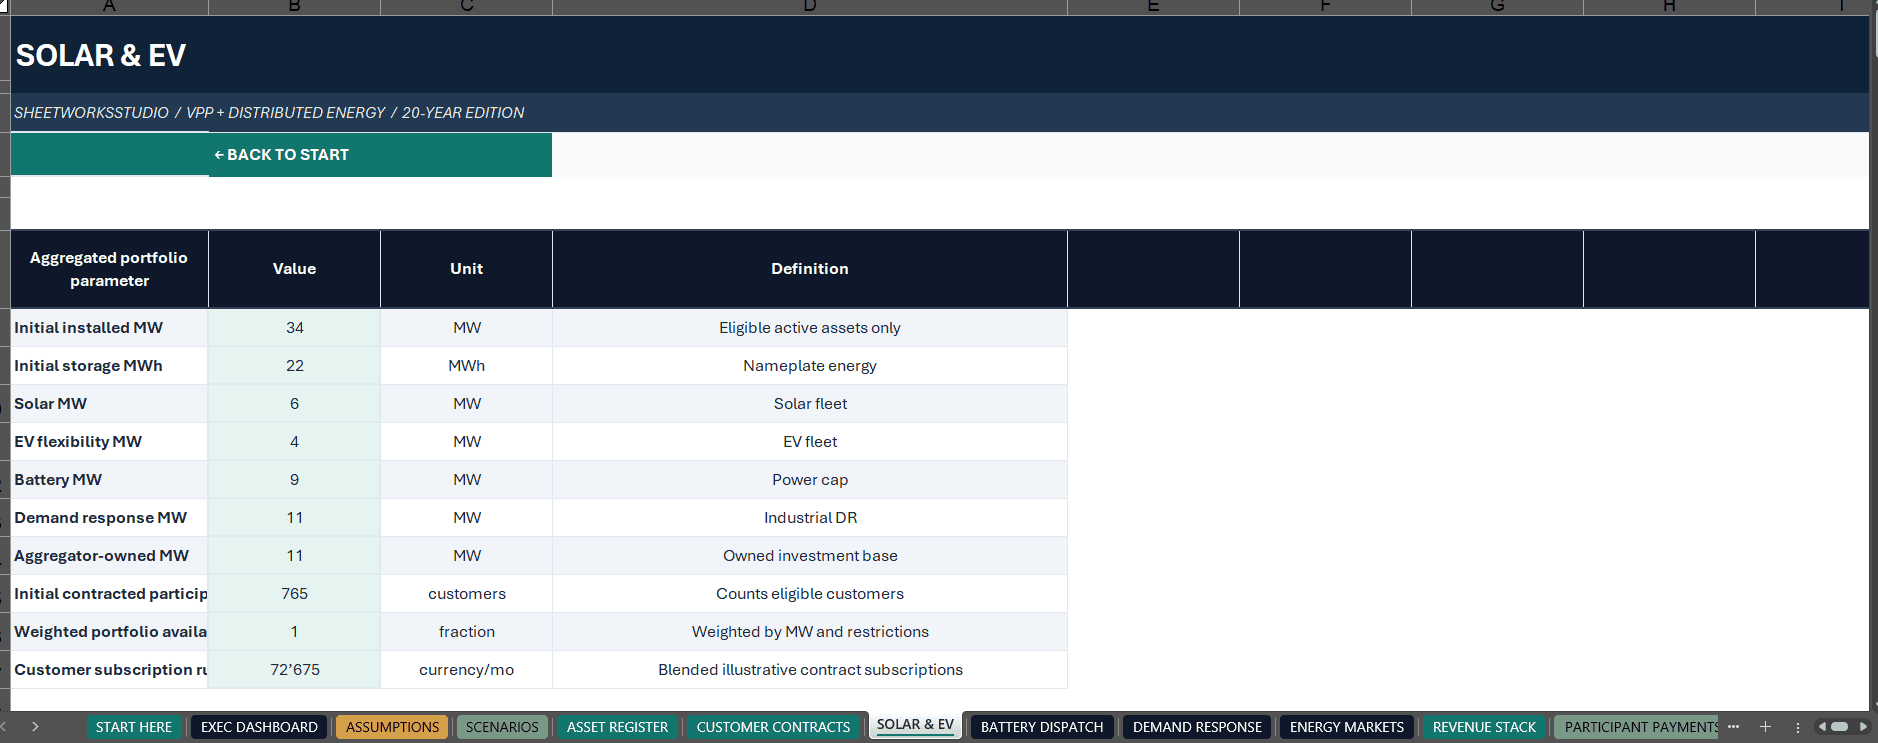
Build your portfolio around battery storage, solar PV, smart EV charging, flexible HVAC and industrial demand-response resources.
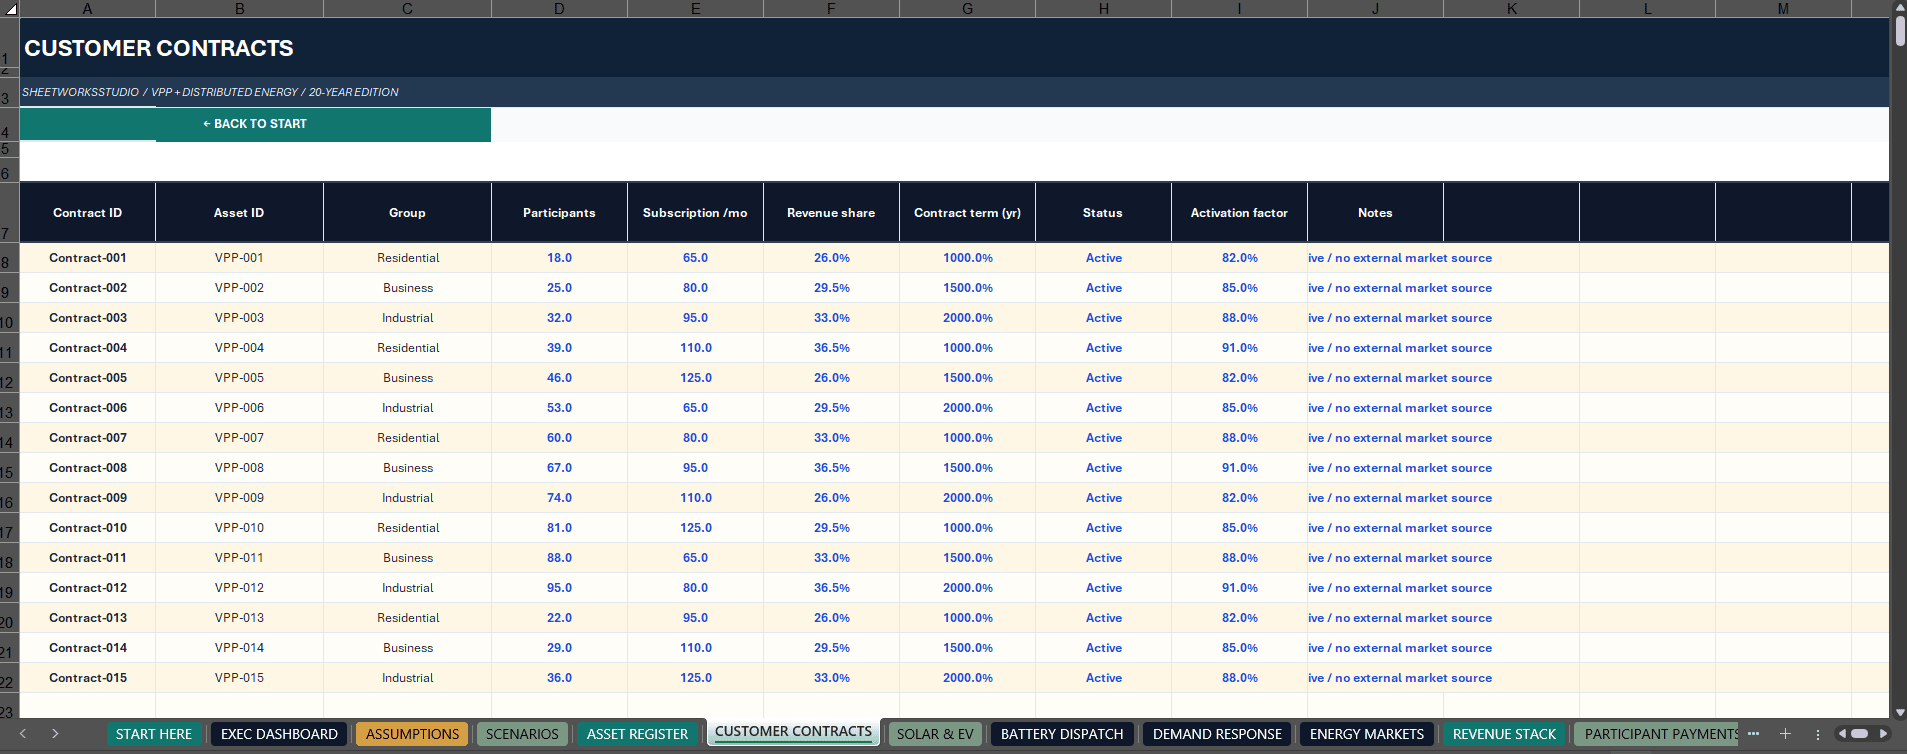
The workbook includes 15 fictional asset and contract examples, with 500 prepared entry rows in each register.
Configure resource classification, region, ownership, installed capacity, storage energy, availability, grid limitations, churn and commercial participation.
Distinguish aggregator-owned resources from third-party assets and review connected, available and dispatchable capacity.
The 500-row registers provide input capacity; they do not represent 500 independent hourly dispatch simulations.
◈ ENERGY MARKETS & REVENUE STACKING
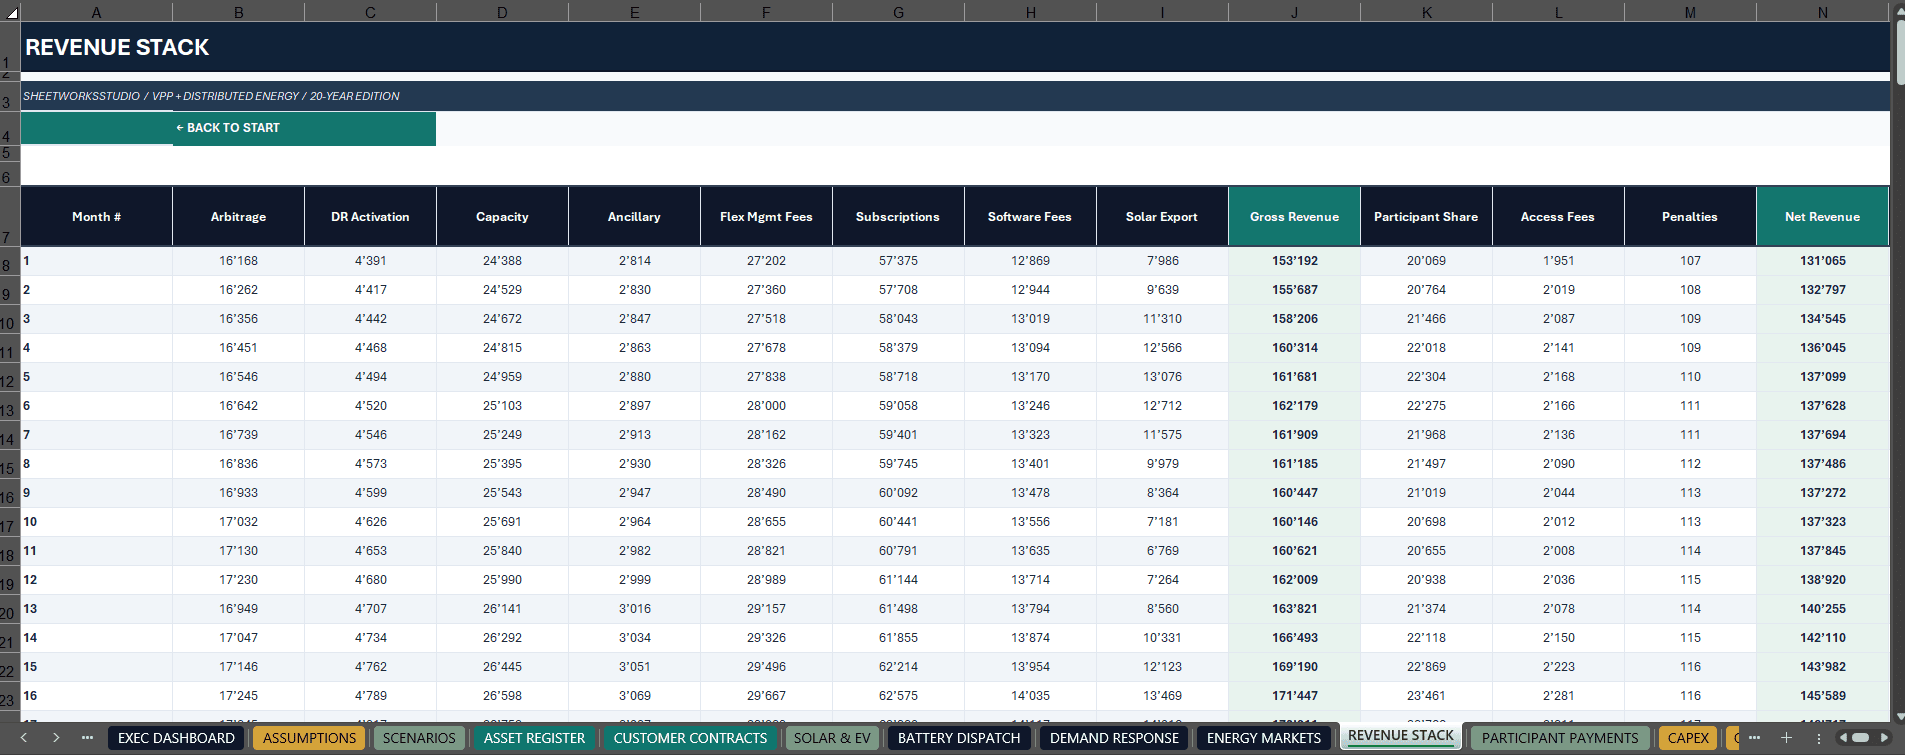
Review multiple potential revenue streams:
• Energy Arbitrage
• Demand-Response Activation
• Capacity Services
• Ancillary Services
• Flexibility Management
• Participant Subscriptions
• Platform and Software Fees
• Solar Export Revenue
Trace gross commercial income through participant revenue sharing, market-access costs and performance penalties to calculate retained aggregator revenue.
A dedicated PARTICIPANT PAYMENTS worksheet supports reconciliation between gross and net commercial value.
Actual stacking eligibility depends on physical availability, market rules and contractual rights. Revenue streams must be independently verified to avoid incompatible simultaneous commitments.
🏗️ OPERATING COSTS, CAPEX & FUNDING
Plan initial platform investment, equipment purchases, expansion, onboarding and replacement expenditure.
Operating expenses include staffing, platform operations, maintenance, customer acquisition, metering, communications and cybersecurity.
The integrated financing schedule models project debt, interest, scheduled repayments and sponsor equity.
Review financing requirements alongside operating cash flow, outstanding debt and debt-service coverage.
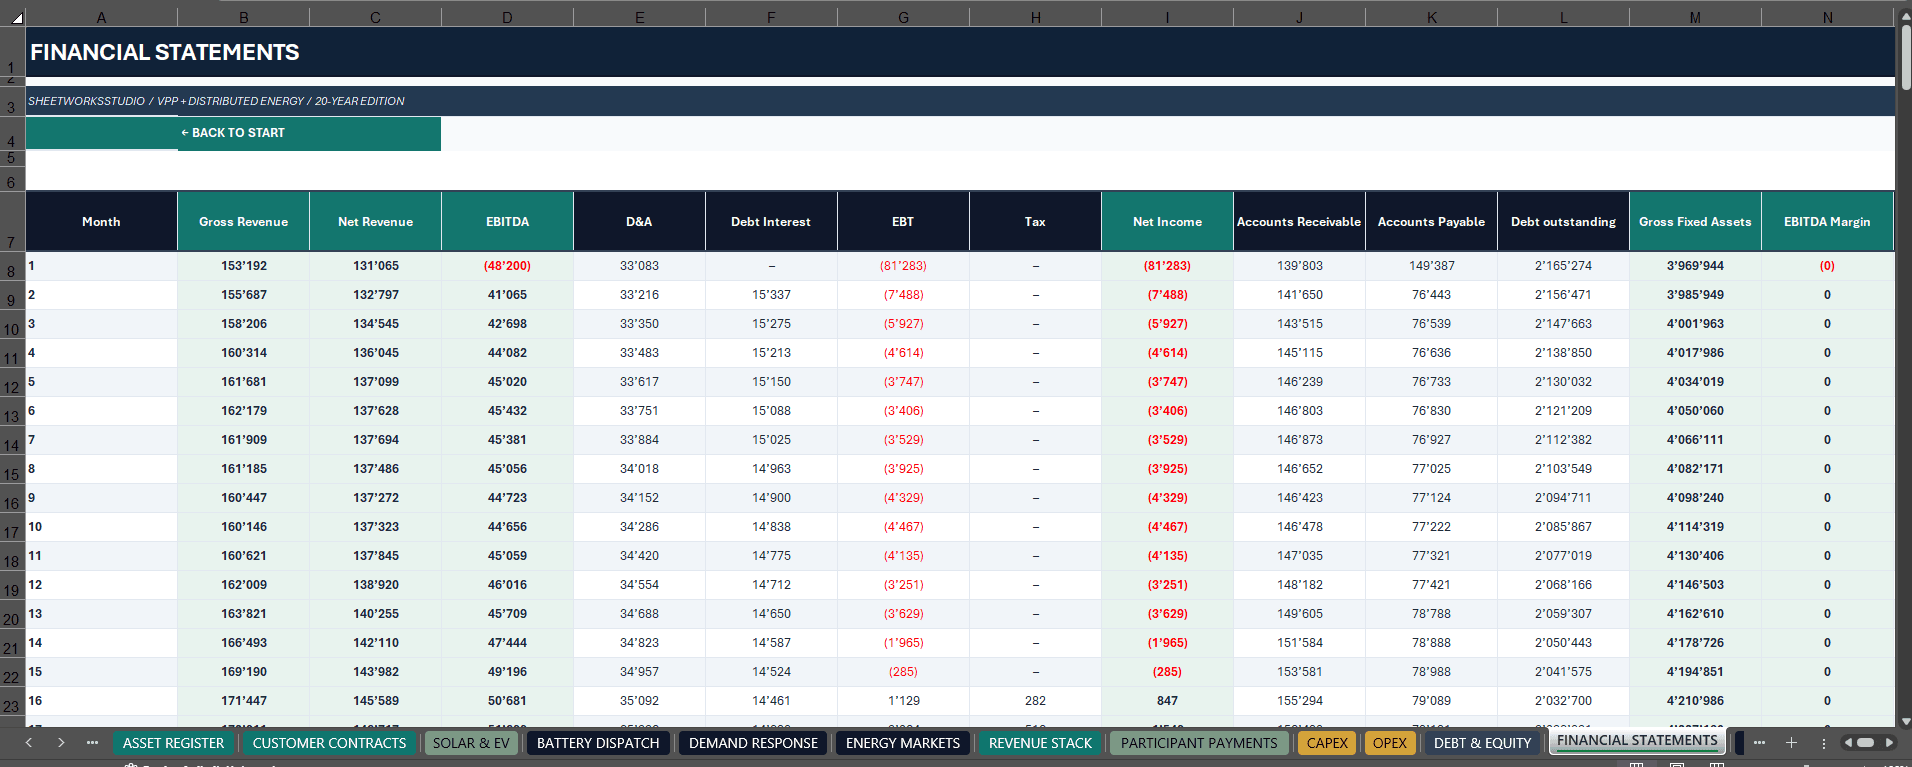
📑 THREE LINKED FINANCIAL STATEMENTS
Analyze 240 monthly periods of interconnected financial calculations.
INCOME STATEMENT
Gross and net revenue, operating expenses, EBITDA, depreciation, financing costs, taxes and net income.
BALANCE SHEET
Cash, receivables, payables, property and equipment, debt and shareholders’ equity.
CASH FLOW STATEMENT
Operating cash generation, capital expenditure, debt movements, equity financing and closing liquidity.
Twenty annual investment-return summaries provide a long-term view of revenue, profitability, CAPEX, cash flow and financing.
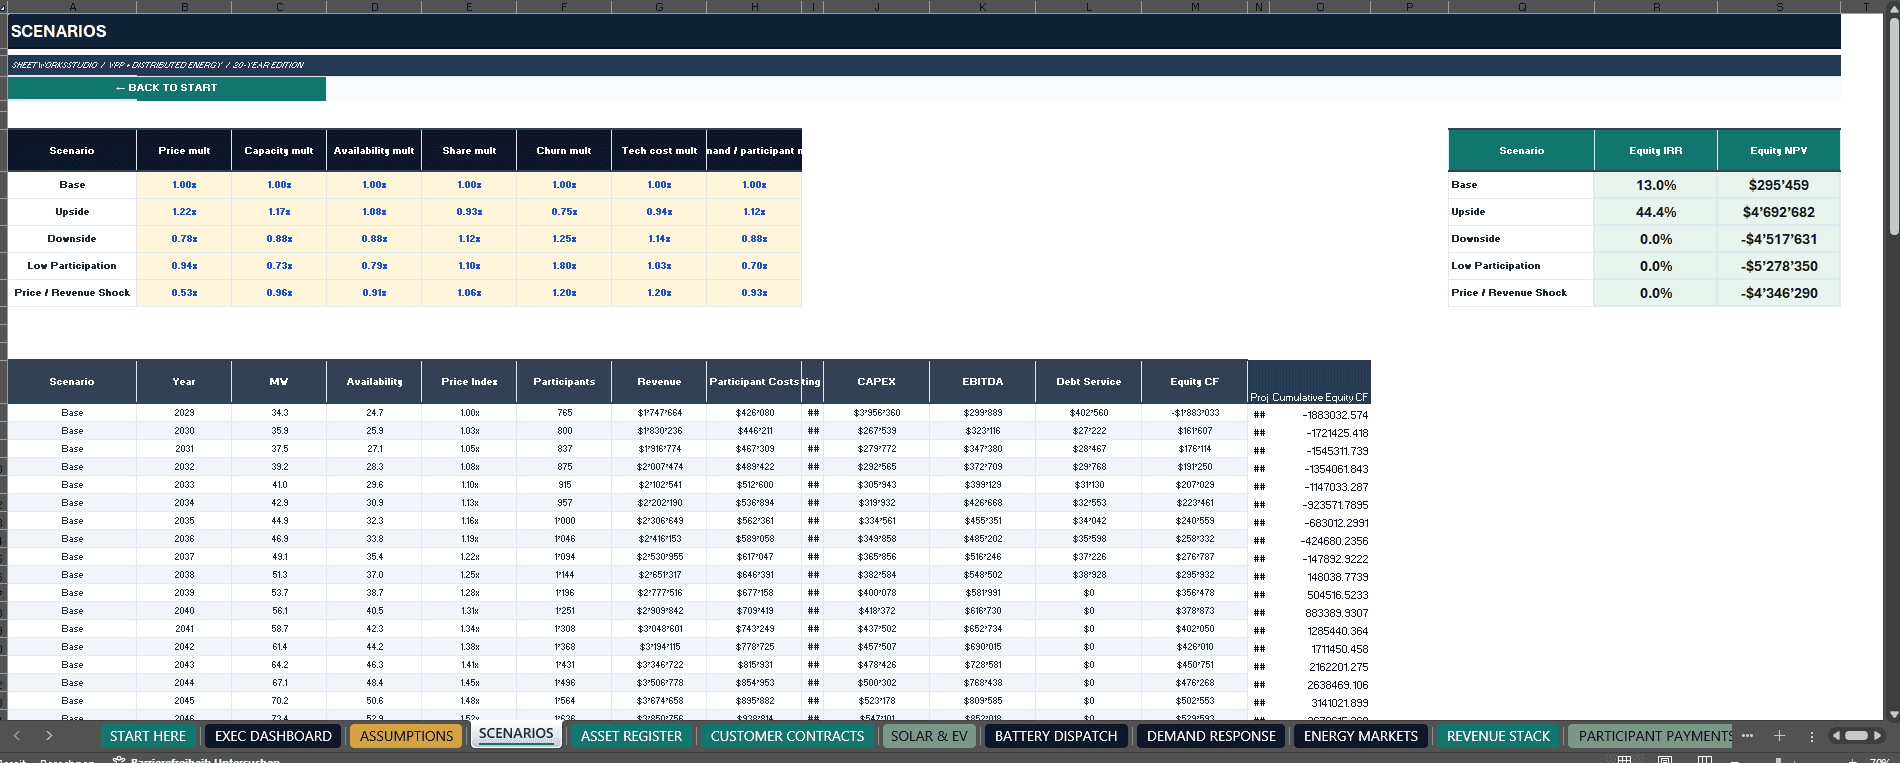
🔀 FIVE ECONOMIC SCENARIOS & SENSITIVITY
Compare five planning cases:
BASE — Central illustrative assumptions.
UPSIDE — Stronger capacity, participation and revenue conditions.
DOWNSIDE — Weaker prices, availability and operating performance.
LOW PARTICIPATION — Reduced customer participation and higher attrition.
PRICE / REVENUE SHOCK — Severe commercial-price and revenue pressure.
Editable multipliers cover pricing, connected capacity, availability, revenue sharing, churn, technology costs and demand.
The scenarios use separate simplified annual calculations rather than five complete independent 240-month financial forecasts.
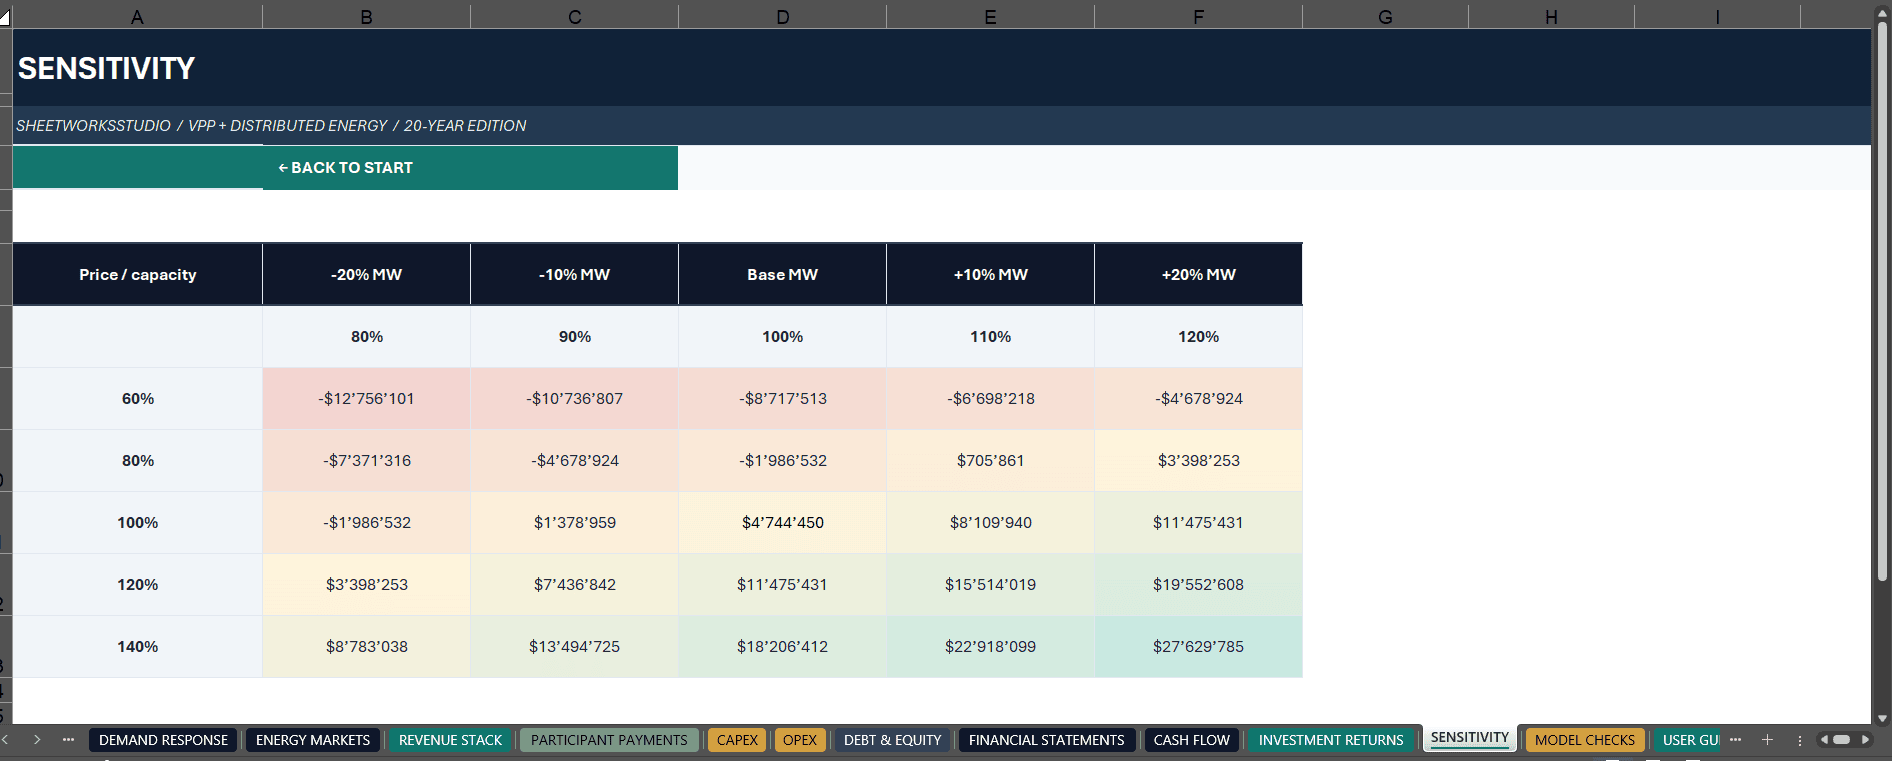
A two-factor sensitivity matrix provides indicative equity-NPV responses to changes in energy prices and connected capacity.
📈 INVESTMENT RETURNS & FINANCIAL RISKS
Review Project IRR, Equity IRR, Equity NPV, cumulative cash flow, payback indicators and debt-service coverage.
The main workbook and simplified scenario analysis use different cash-flow conventions. Their return metrics should not be treated as interchangeable.
The illustrative supplied model includes a negative minimum DSCR, triggering a financing warning against the selected covenant threshold.
Scenario IRR values displayed as zero may also indicate an undefined mathematical return rather than a genuine 0% investment outcome.
Assess returns together with actual cash-flow sequences, financing requirements and model limitations.
✓ MODEL CHECKS & TRANSPARENT ASSUMPTIONS
Built-in checks review balance-sheet reconciliation, participant payments, service-capacity allocation, negative cash, debt balances, debt coverage, revenue activity and cash movements.
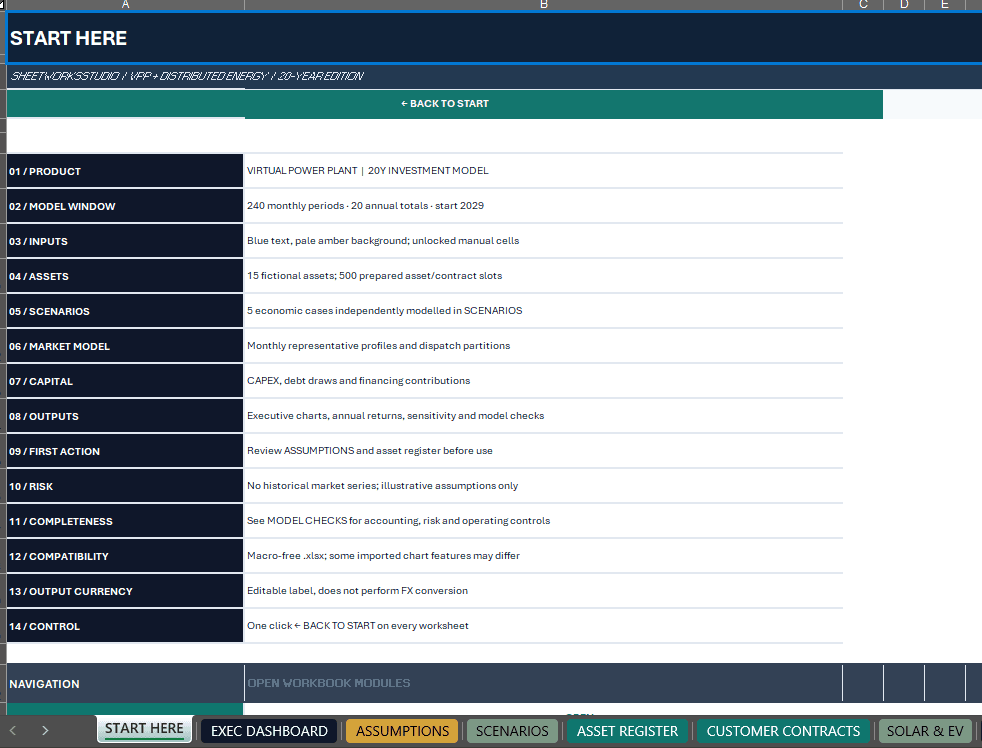
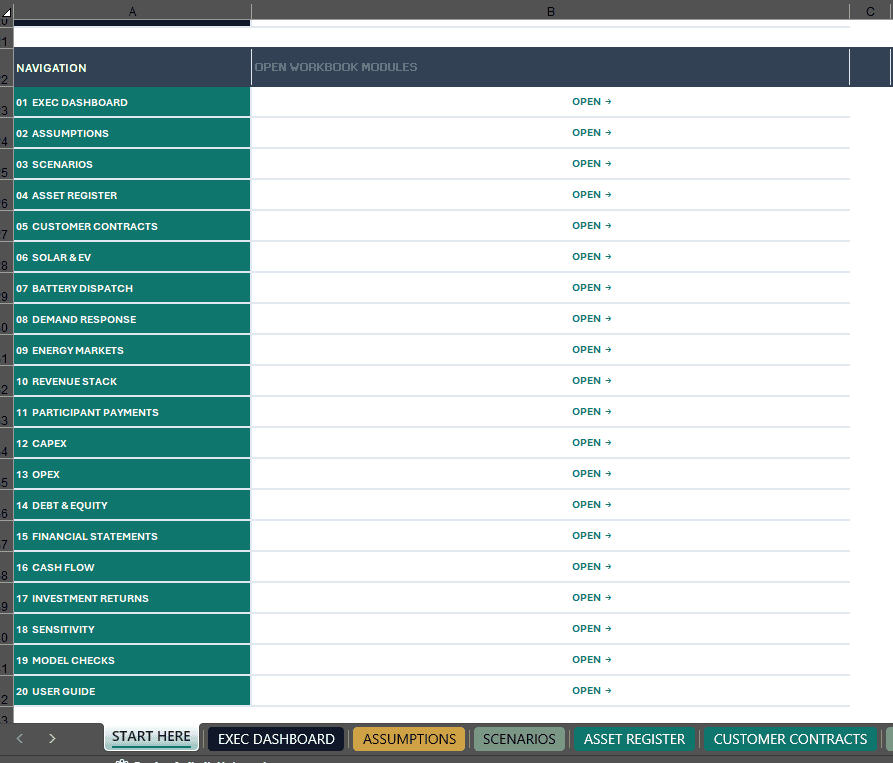
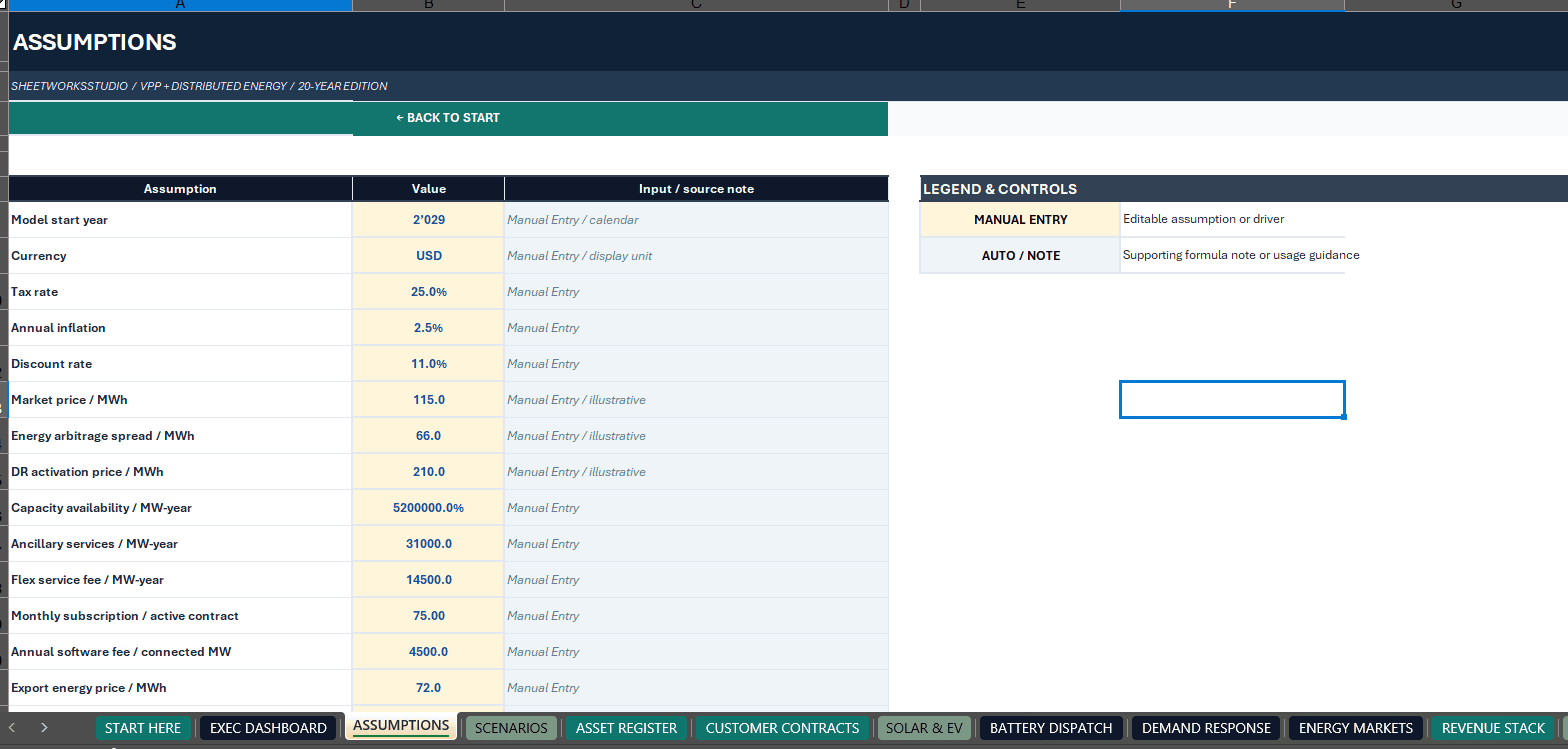
A START HERE navigation sheet, input styling and an embedded USER GUIDE support model interpretation.
A mathematical PASS confirms selected reconciliation relationships. It does not certify financing adequacy, commercial feasibility or regulatory compliance.
📦 WHAT YOU RECEIVE
1. PREMIUM EXCEL FINANCIAL MODEL (.XLSX)
• 21 connected worksheets
• 240 monthly operating periods
• 20 annual investment-return summaries
• 500 prepared asset-register rows
• 500 prepared contract-register rows
• 15 fictional sample records
• 5 economic scenario cases
• 12 executive KPI cards
• 8 native Excel charts
• Revenue stacking and participant payments
• CAPEX, OPEX, debt and equity schedules
• 3 linked financial statements
• IRR, NPV, DSCR and sensitivity analysis
• Built-in model checks
2. PROFESSIONAL 11-PAGE PDF GUIDE
An English user manual covering setup, navigation, portfolio configuration, energy operations, revenue stacking, financing, scenarios, investment returns, model validation and troubleshooting.
🧭 GETTING STARTED
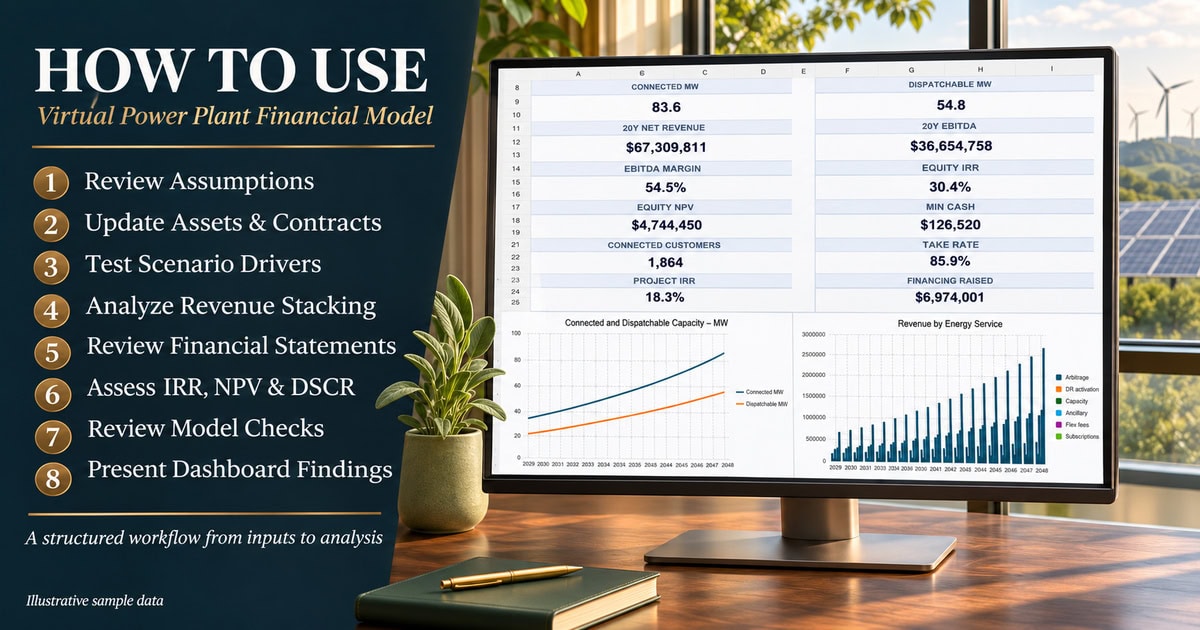
- Open START HERE and review the PDF guide.
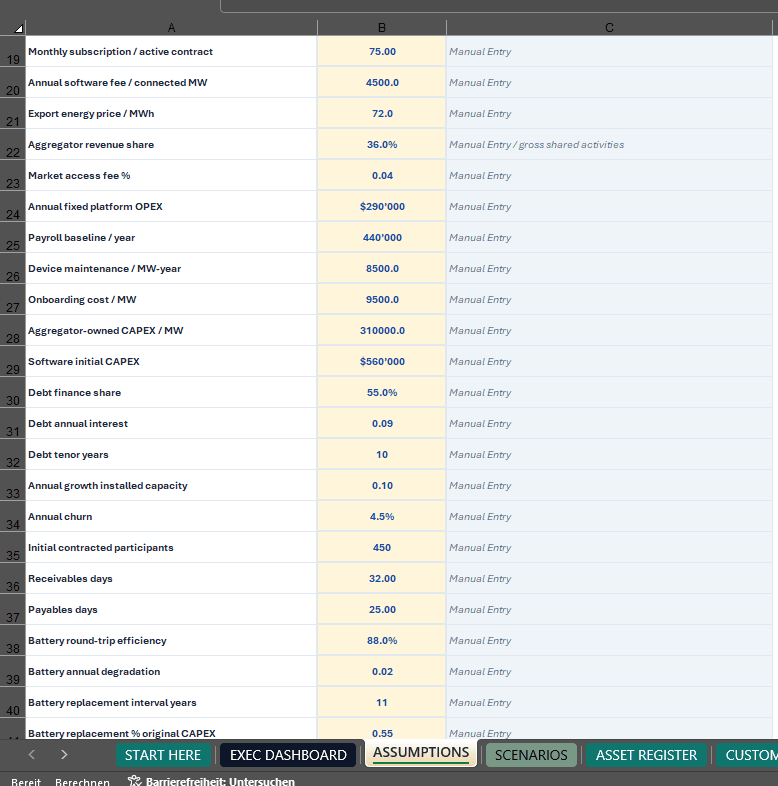
- Configure project assumptions.
- Customize ASSET REGISTER and CUSTOMER CONTRACTS.
- Review operating schedules and revenue stacking.
- Examine debt, financial statements and cash flow.
- Compare scenarios and investigate MODEL CHECKS.
Save separate working copies when evaluating alternative projects.
👥 WHO IS THIS MODEL FOR?
• Virtual Power Plant developers
• Distributed energy aggregators
• Battery storage and flexibility operators
• Renewable-energy financial analysts
• Infrastructure investment teams
• Energy consultants and advisers
• Business planning professionals
Suitable for early-stage project screening, commercial assumption testing, operating-cost planning, funding discussions and illustrative investment analysis.
⚙️ SOFTWARE & MODEL SCOPE
Format: Editable Microsoft Excel (.xlsx)
Forecast: 240 months / 20 years
Default Period: 2029–2048
Macros / VBA: None
External Connections: None required
Recommended Software: Microsoft Excel Desktop
A live Excel Desktop recalculation and Google Sheets compatibility test have not been completed. Users should verify formulas, charts, formatting and outputs after opening or importing.
The model is not an hourly dispatch optimizer, real-time energy-management system, live market-data service, regulatory qualification tool or lender-approved debt-sizing model.
Changing the currency label does not perform foreign-exchange conversion.
🛡️ IMPORTANT DISCLAIMER
Independent Financial Modeling Template – Unofficial Product.
Created by SheetworksStudio for financial planning, education and illustrative analysis.
All demonstration assumptions and outputs are fictional. No financing, market eligibility, revenue, profitability or investment performance is guaranteed.
The model is not independently audited, certified, regulator-approved, bank-approved or endorsed by any utility, energy market, financial institution or software provider.
Users must independently validate physical constraints, revenue stacking, participant contracts, market rules, financing, taxation and accounting assumptions.
This product does not provide individualized financial, investment, tax, engineering or legal advice.
Digital download only. No physical equipment, electricity, software subscription or live data service is included.
Bring distributed energy aggregation, commercial revenue stacking and long-term project finance into one structured 20-year Excel model.
Similar ProductsOther customers were also interested in...


 eFinancialModels
Electric Vehicle (EV) Charging Station Financial M...
With this comprehensive 5- or 10-year monthly tool, investors can assess the viability of setting up... Read more

Financial Model for Mobile App | Mobile App Busine...
The Mobile App Financial Plan Template in Excel allows you to develop financial projections when lau... Read more

 HenrySheykin
Food Truck Financial Model Excel Template
The Food Truck Financial Model helps entrepreneurs, founders, business owners, consultants, and anal... Read more

Green Hydrogen Production from Wind Energy Financi...
The Green Hydrogen from Wind Financial Model aims to comprehensively forecast a horizon of 40 years ... Read more

Simple Mutual Non-Disclosure Agreement Template
Protect your business secrets with ease using our Simple Mutual Non-Disclosure Agreement Template. S... Read more

Solar Energy Financial Model
The Solar Energy Financial Model Spreadsheet Template in Excel assists you in preparing a sophistica... Read more

 Peter Graf
The Customer-Centric Financial Model for Restauran...
Starting a restaurant without a financial plan is like driving a car blindfolded. You wouldn´t do i... Read more
You must log in to submit a review.