
0 ITEMS

Solar PV Project Finance Model Excel – 30-Year Forecast, PPA, Debt, DSCR, IRR & LCOE
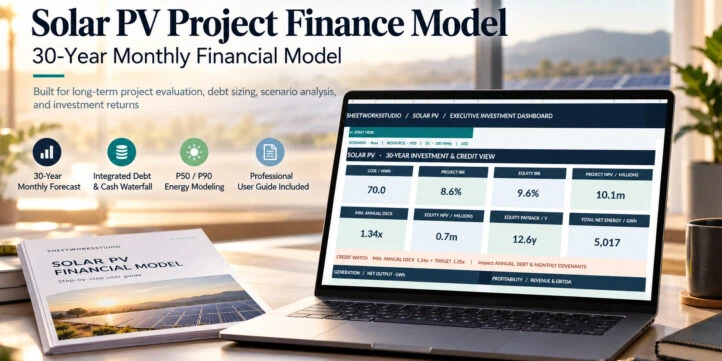
30-year monthly Solar PV project finance model in Excel with P50/P90 production, PPA and merchant revenue, construction CAPEX, debt schedules, DSCR, cash waterfall, three-statement reporting, IRR and LCOE. Includes a 32-page PDF guide.
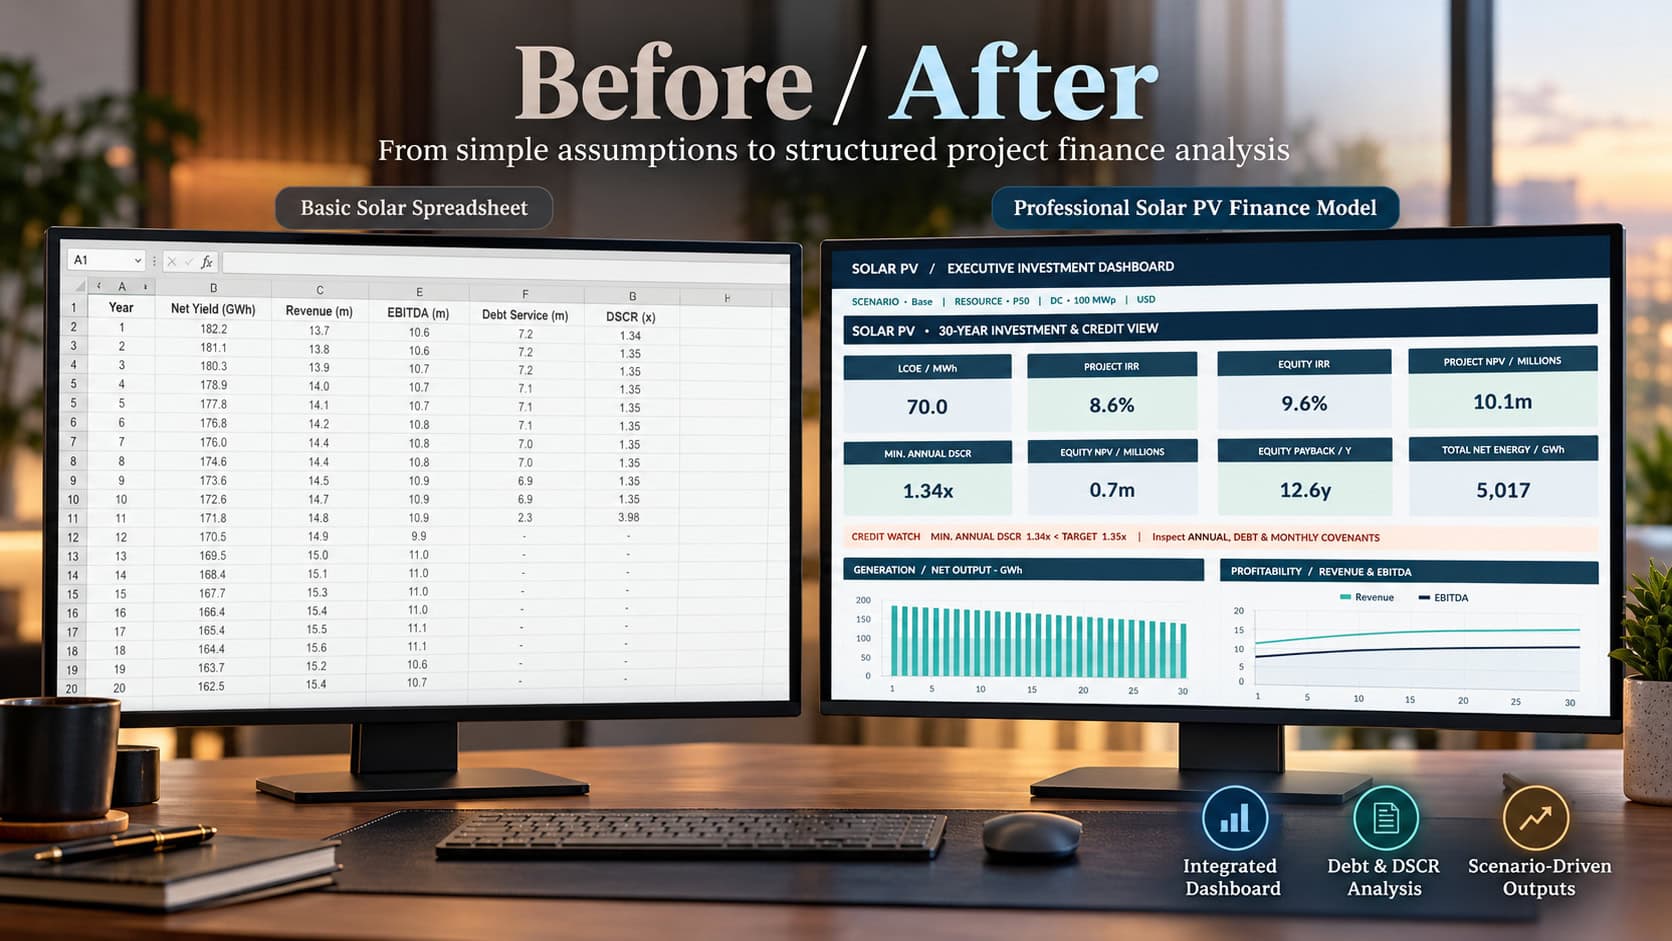
SOLAR PV PROJECT FINANCE MODEL
30-Year Monthly Financial Forecast | Solar Production, PPA Revenue, Debt, DSCR & Equity Returns
Assess solar project economics from construction through the final operating year with a structured, editable Excel project finance model.
The Solar PV Project Finance Model by SheetworksStudio combines monthly electricity generation, long-term power sales, construction costs, operating expenditure, project financing, cash flow, financial statements and investment returns in a single integrated modeling framework.
It is designed for solar developers, independent power producers, renewable energy investors, finance professionals and infrastructure advisors seeking a transparent, scenario-driven approach to solar project economics.
📊 PROJECT ECONOMICS & EXECUTIVE DASHBOARD
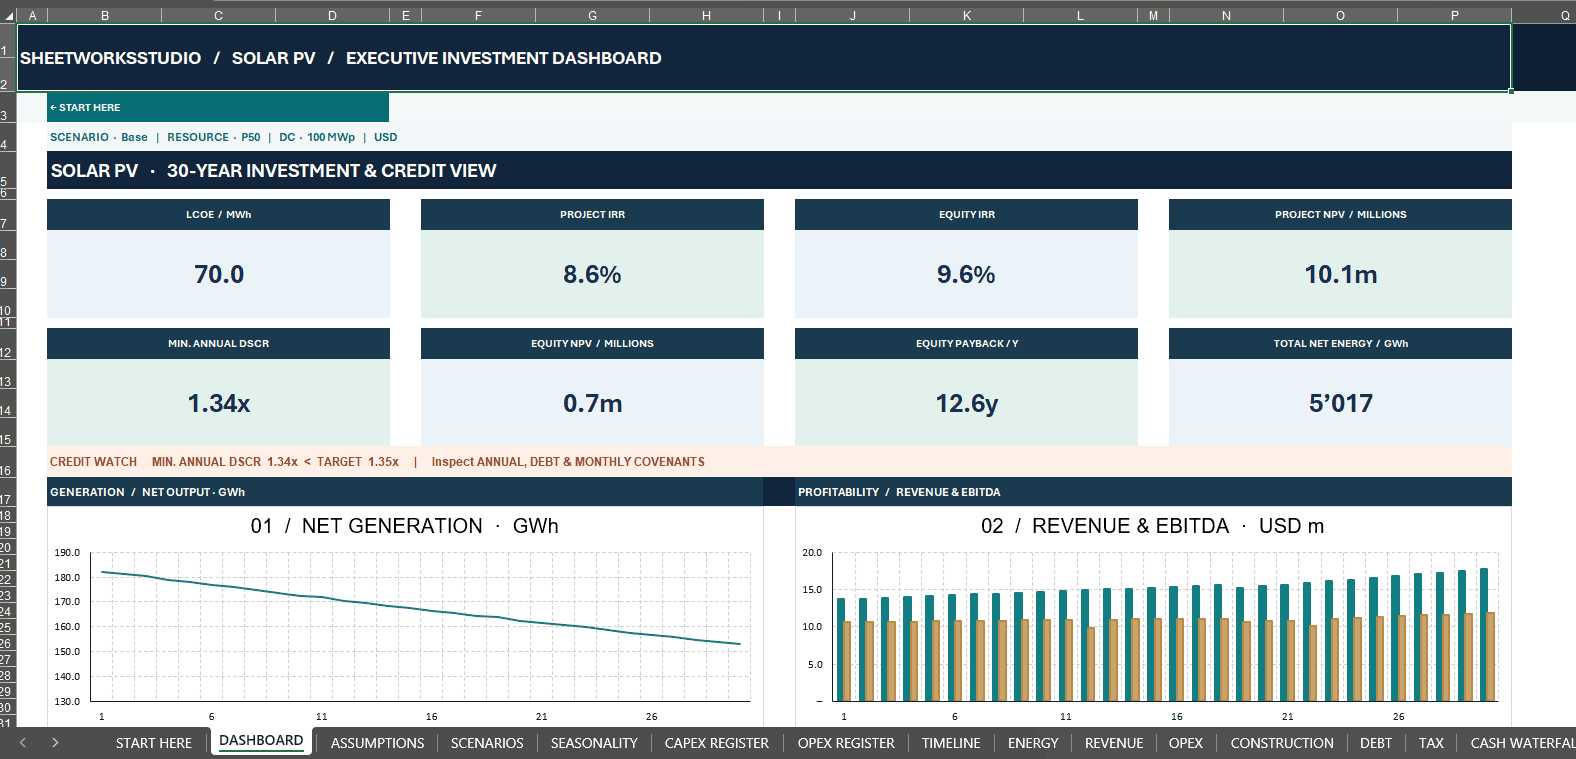
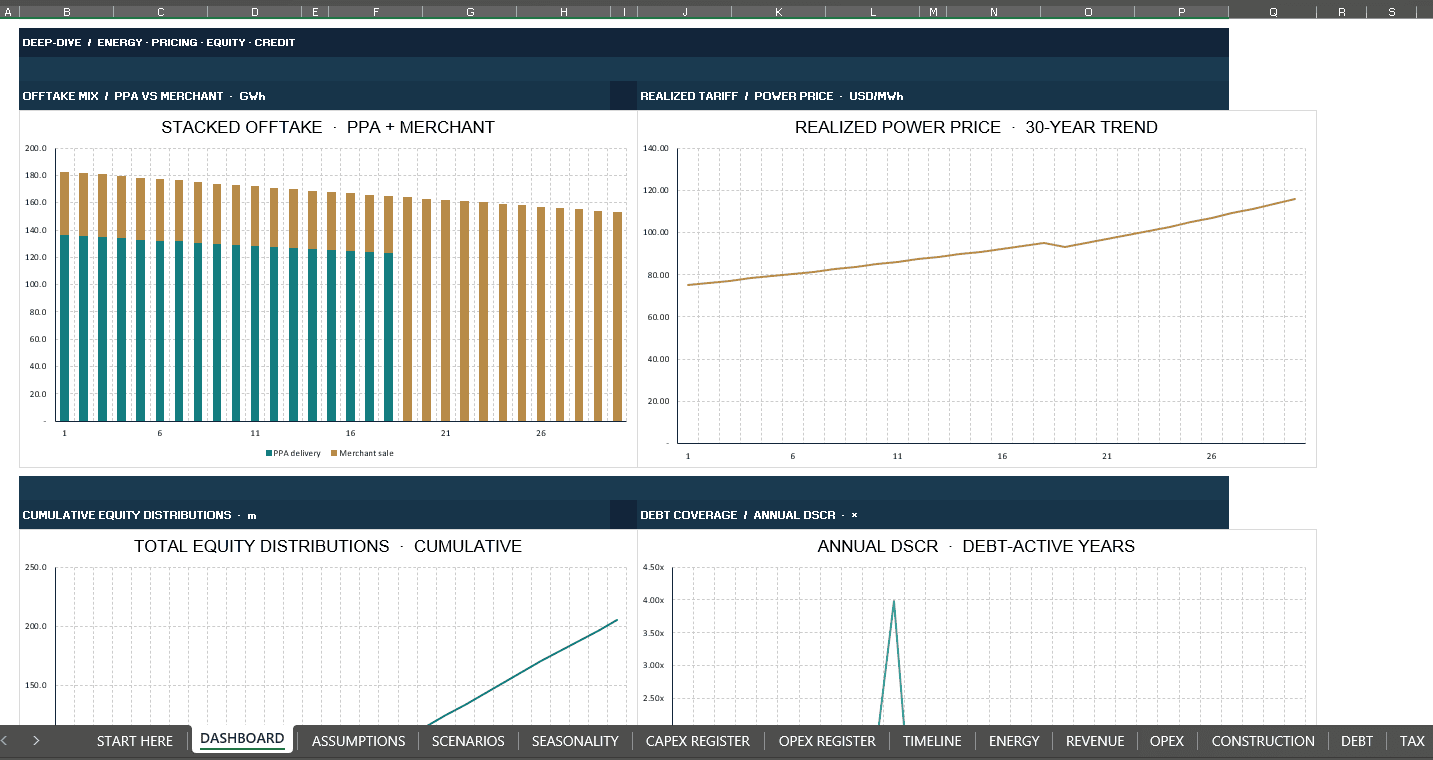
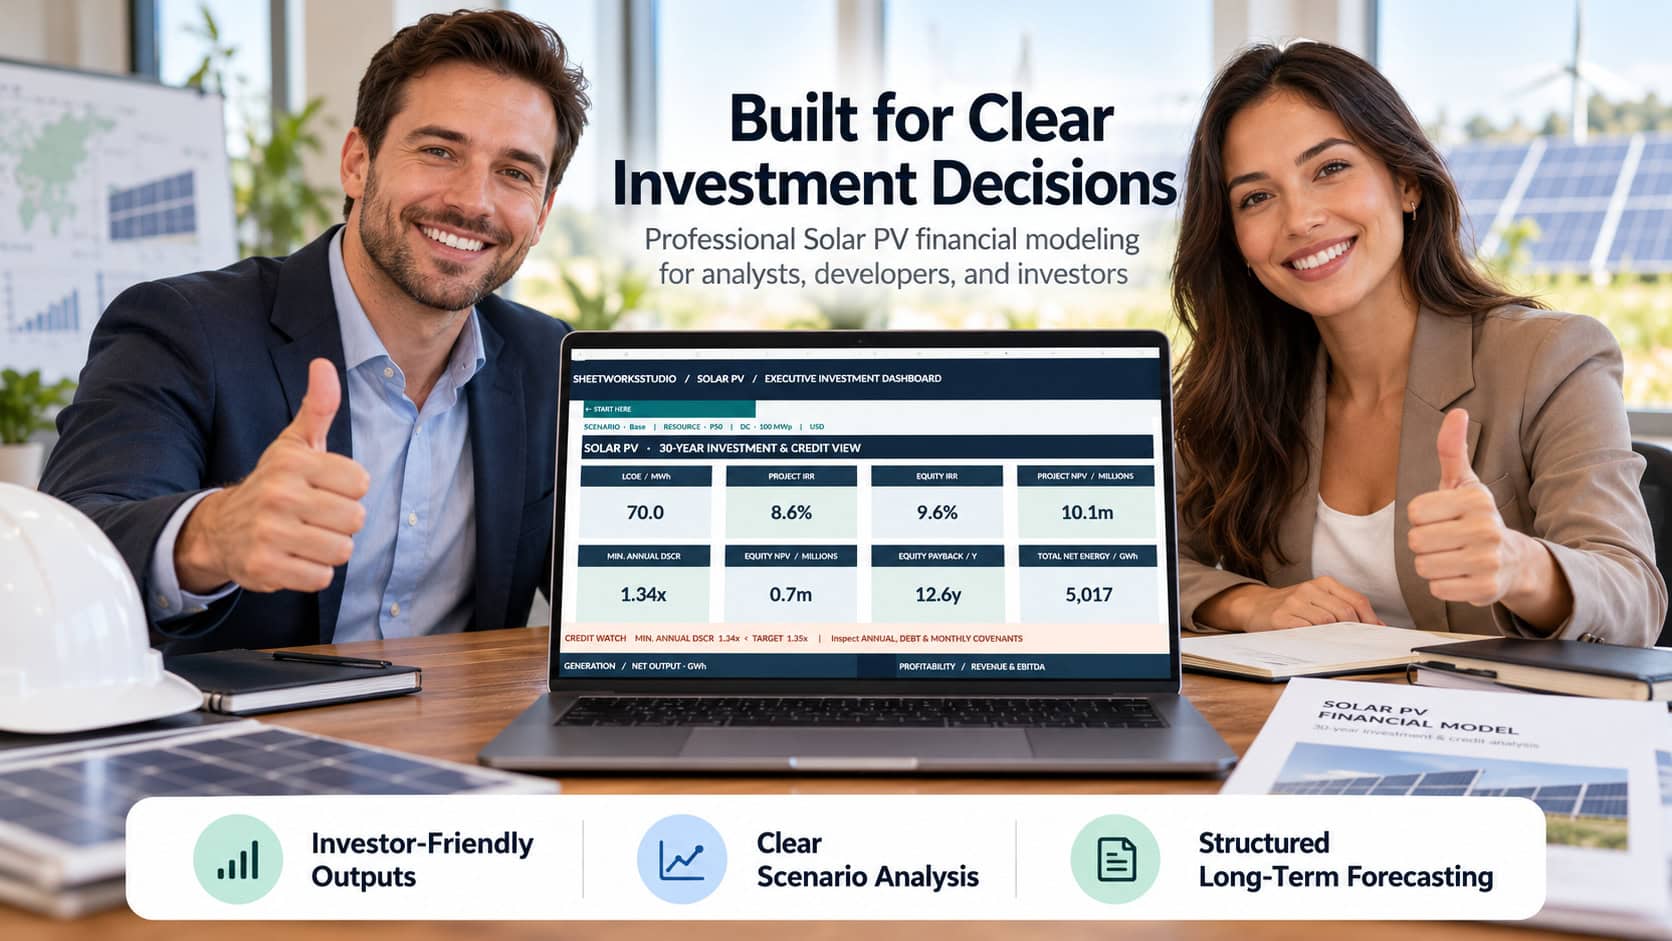
The Executive Investment Dashboard consolidates essential investment indicators and eight data-linked charts.
Evaluate:
- Project Internal Rate of Return (IRR)
- Equity Internal Rate of Return (IRR)
- Project and Equity Net Present Value (NPV)
- Levelized Cost of Energy (LCOE)
- Minimum Annual Debt Service Coverage Ratio (DSCR)
- Equity Payback Period
- Lifetime Net Electricity Production
- Revenue, EBITDA and Financing Trends
- Project and Equity Cash Flow Performance
All main outputs are connected to the financial calculations and respond to changes in project assumptions.
The model highlights potential financing and coverage risks rather than treating model integrity checks as lender approval.
⚡ 30-YEAR SOLAR PRODUCTION & ELECTRICITY REVENUE
Monthly Solar Energy Production
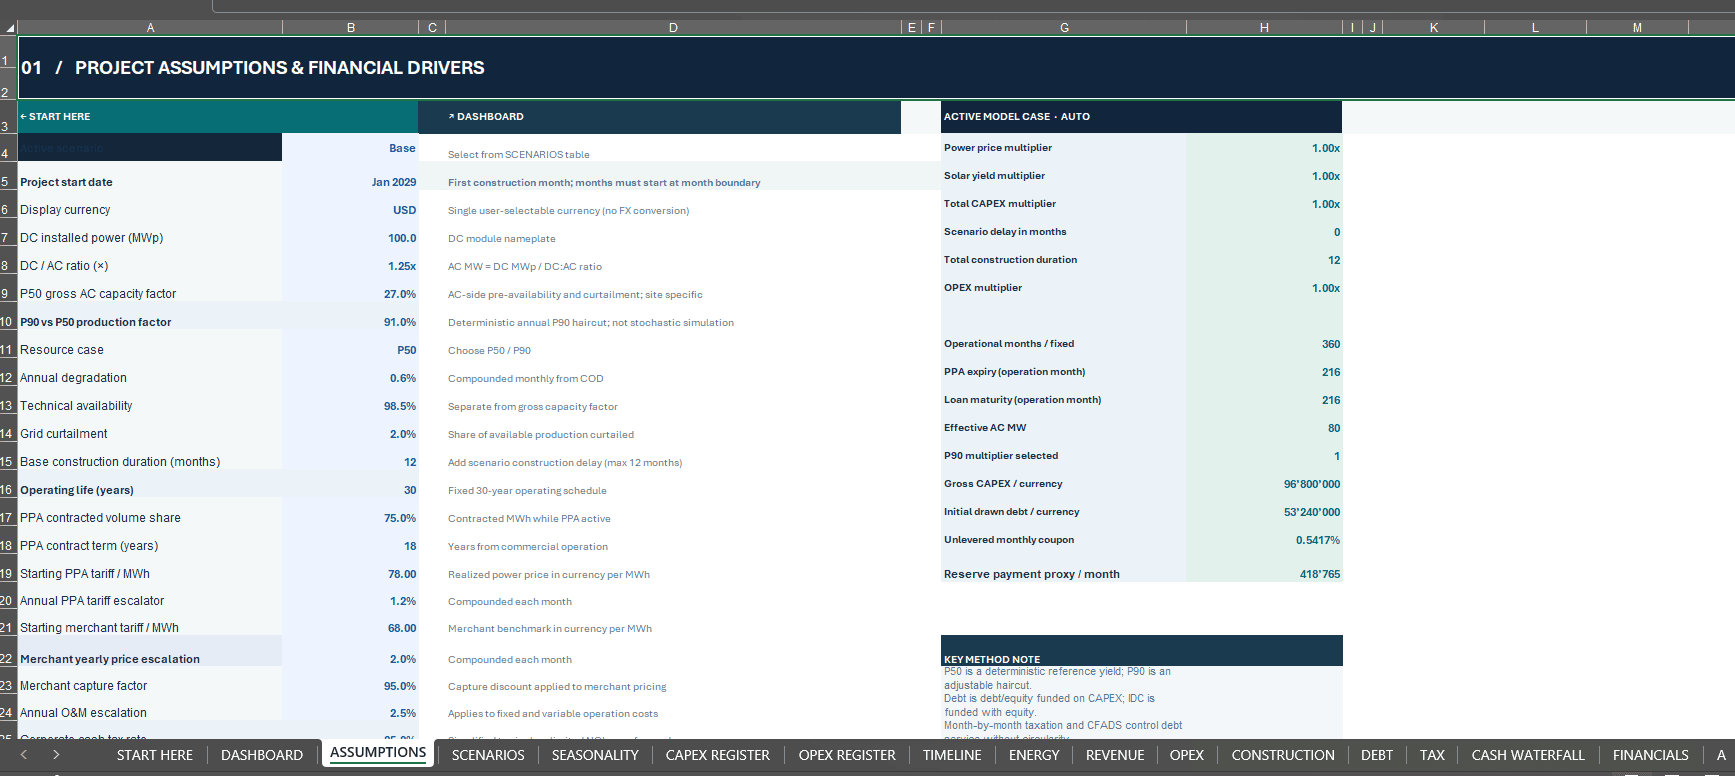
Estimate electricity generation using configurable technical and operating assumptions, including:
- Installed DC Capacity (MWp)
- DC/AC Ratio
- Gross AC Capacity Factor
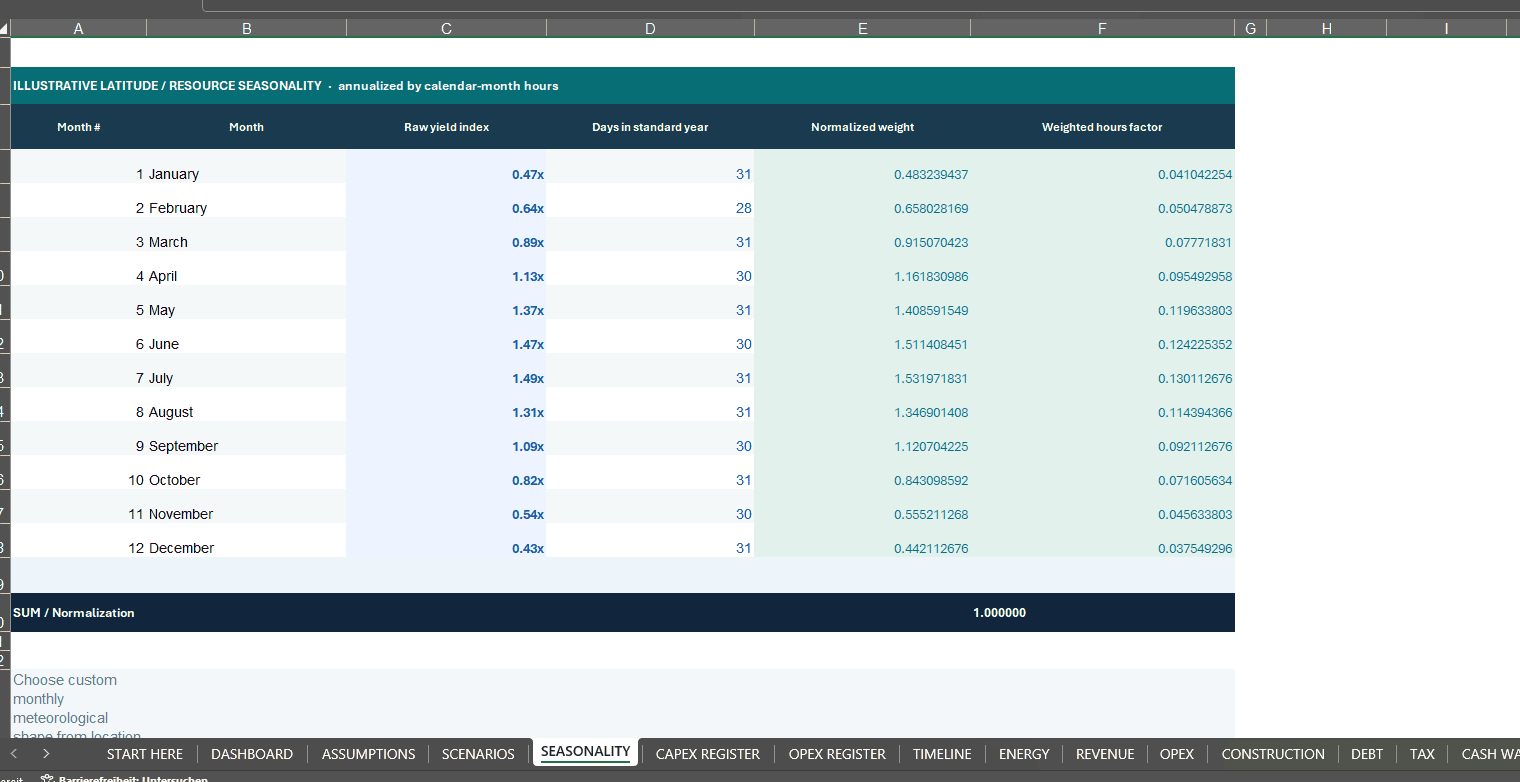
- Monthly Solar Generation Seasonality
- Annual Performance Degradation
- Technical Availability
- Grid Curtailment
- P50 and P90 Production Cases
- Gross Generation and Net Export
Evaluate the relationship between electricity production, operating revenue, cash generation and long-term investment returns.
The P90 scenario uses a configurable deterministic adjustment to P50 generation. It is not a location-specific probabilistic energy yield assessment.
PPA & Merchant Revenue
Model contracted and market-based power sales through:
- Power Purchase Agreement (PPA) Tariffs
- Contracted Electricity Allocation
- PPA Contract Duration
- PPA Tariff Escalation
- Merchant Electricity Prices
- Merchant Price Escalation
- Revenue After PPA Expiration
- Monthly and Annual Electricity Revenue
This structure allows users to examine how contracted revenue and merchant-market exposure affect project economics.
🏗️ CONSTRUCTION CAPEX & OPERATING COST PLANNING
Build a project budget using editable cost assumptions and structured expenditure registers.
The workbook supports:
- CAPEX Breakdown and Project Cost Registers
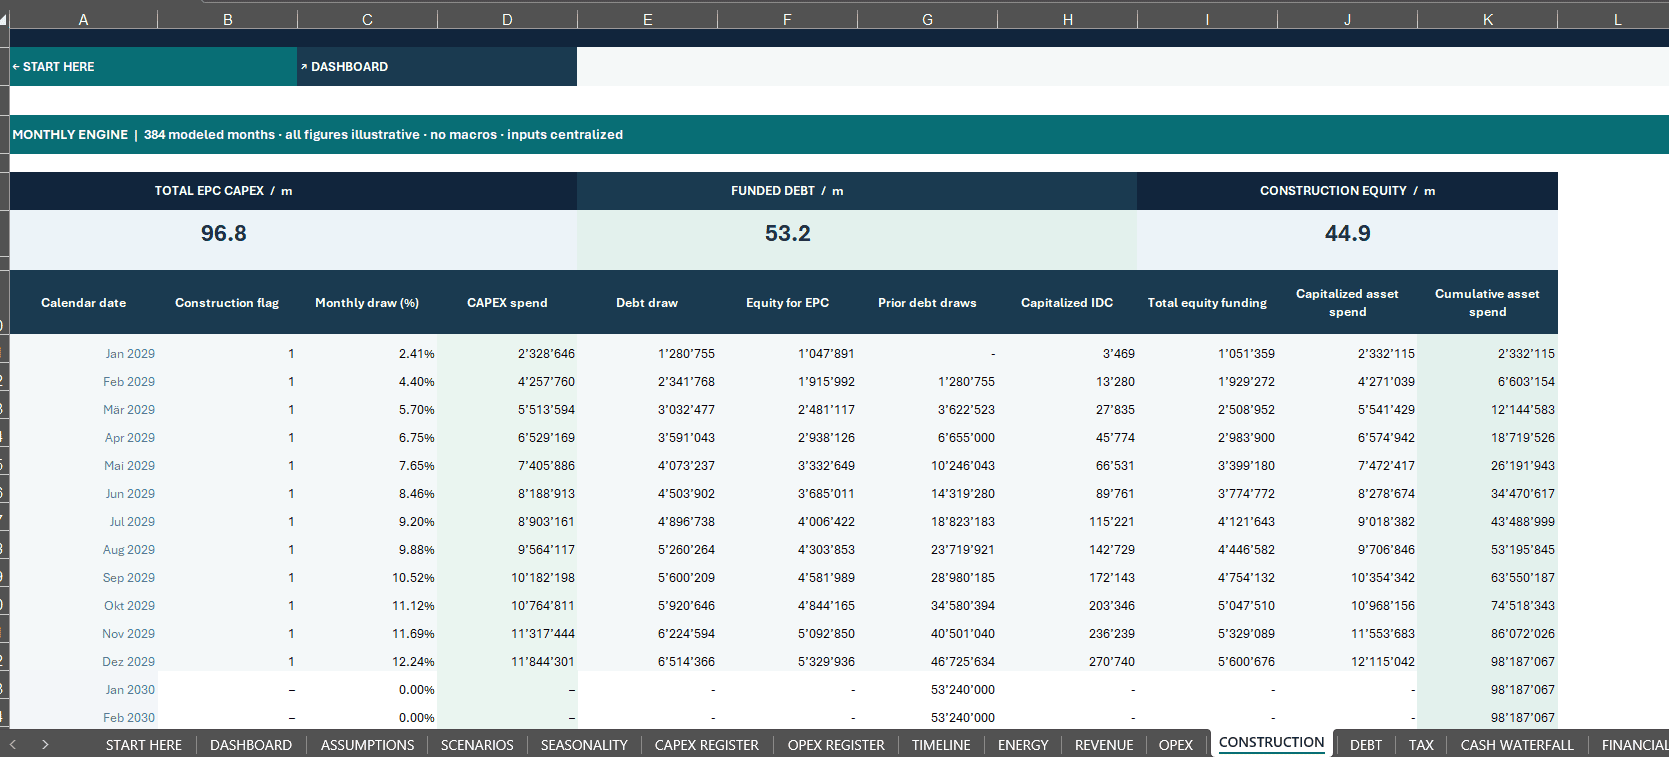
- Monthly Construction Expenditure
- Construction Delays and Cost Escalation
- Debt-Funded and Equity-Funded CAPEX
- Capitalized Interest During Construction
- Operations and Maintenance Costs
- Operating Expense Escalation
- Depreciation and Tax Calculations
Users can replace fictional sample assumptions with project-specific quotations, technical forecasts, budgets and cost estimates.
No live supplier prices, energy market feeds or external pricing APIs are included.
🏦 PROJECT DEBT, DSCR & CASH WATERFALL
Analyze how the project is funded and how operating cash generation supports debt repayment and equity distributions.
The financing framework includes:
- Construction Debt Drawdowns
- Loan Interest and Capitalized Construction Interest
- Debt Amortization and Repayment Schedules
- Opening and Closing Loan Balances
- Cash Flow Available for Debt Service (CFADS)
- Debt Service Coverage Ratio (DSCR)
- Debt Coverage Monitoring
- Cash Retention and Liquidity Requirements
- Equity Funding Requirements and Equity Cures
- Monthly Cash Waterfall
- Equity Distributions
The model helps identify periods when available cash flow may fall below the selected debt service coverage target.
Financing warnings are analytical indicators and do not constitute a guarantee of compliance with loan agreements.
📈 INTEGRATED FINANCIAL STATEMENTS & PROJECT RETURNS
The model connects operating forecasts and financing schedules to an integrated financial reporting framework.
Income Statement
Evaluate electricity revenue, operating expenses, EBITDA, depreciation, interest, taxation and project profitability.
Balance Sheet
Review the modeled financial position, including project assets, financing balances, liabilities and equity.
Cash Flow Statement
Understand cash movements associated with operations, construction investment, debt financing and equity funding.
Investment Return Analysis
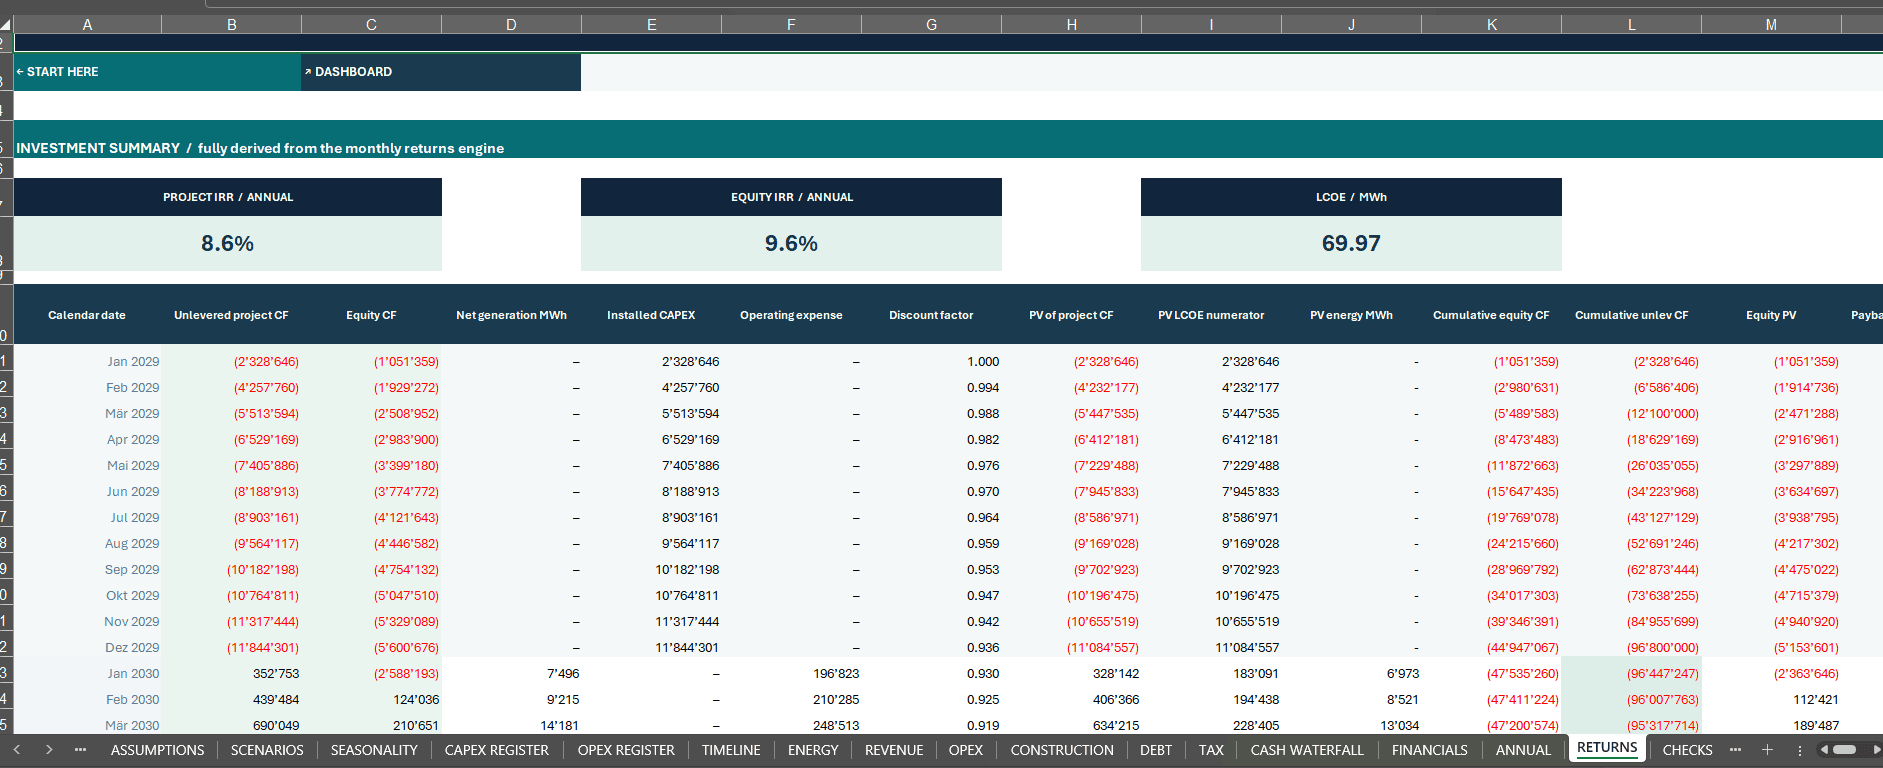
Examine project and equity cash flows, IRR, NPV, LCOE, DSCR, payback and long-term investment performance.
The workbook provides both monthly calculations and annual reporting views.
🔄 FOUR SCENARIOS & PRODUCTION SENSITIVITY
Evaluate alternative assumptions without rebuilding the financial model.
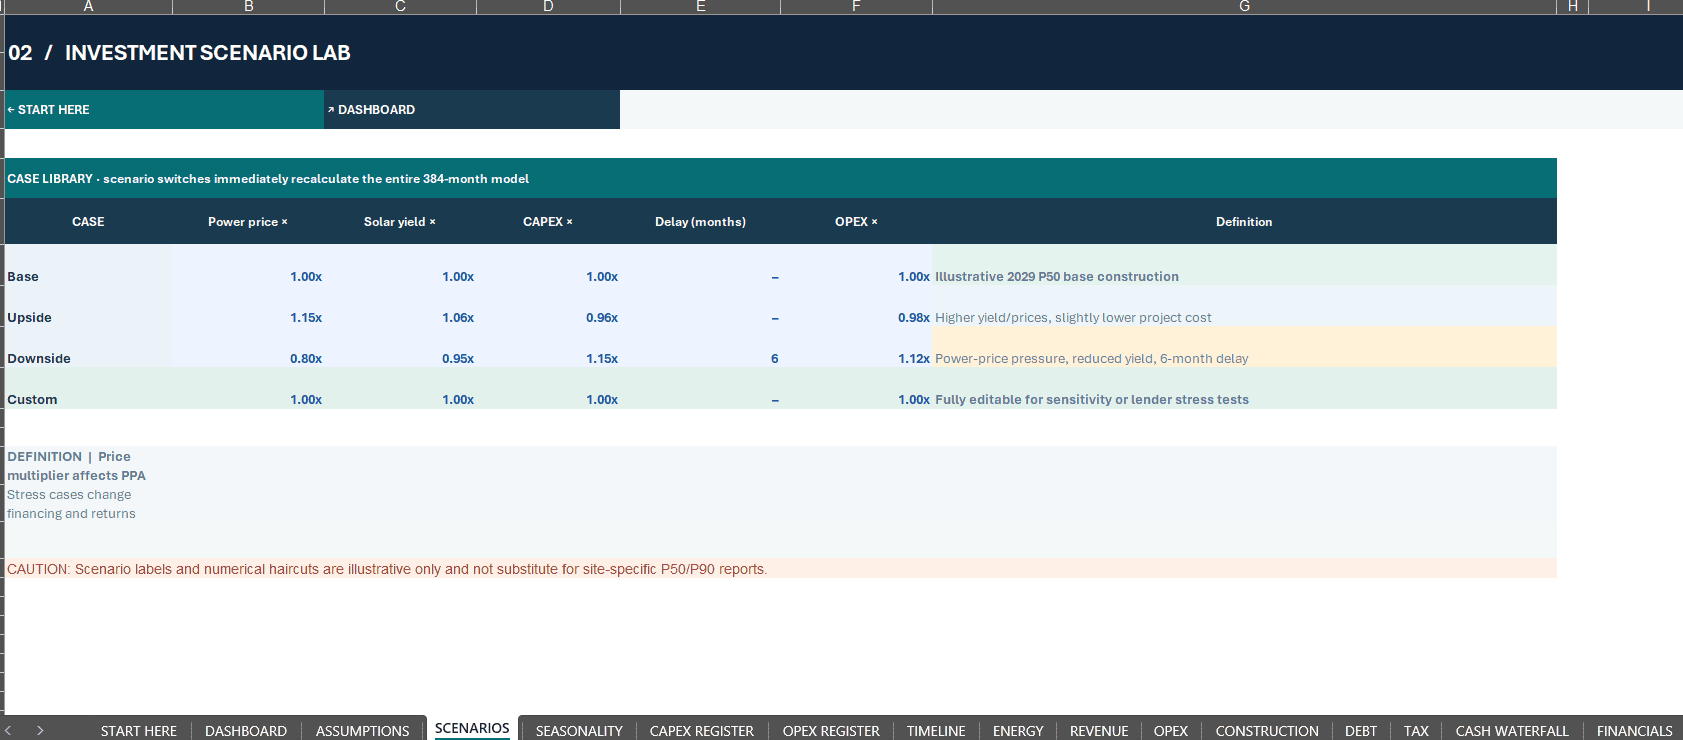
Base Case — Illustrative central operating and financing assumptions.
Upside Case — More favorable project conditions.
Downside Case — More conservative assumptions reflecting potential project risks.
Custom Case — User-configurable scenario adjustments.
Scenario drivers include electricity pricing, solar production, capital expenditure, operating expenses and construction delays.
P50/P90 resource choices provide an additional production-sensitivity perspective.
Users can compare the effects on profitability, debt coverage, cash flow and equity returns.
📦 WHAT YOU RECEIVE
1. Solar PV 30Y Financial Model (.xlsx)
A fully editable financial modeling workbook featuring:
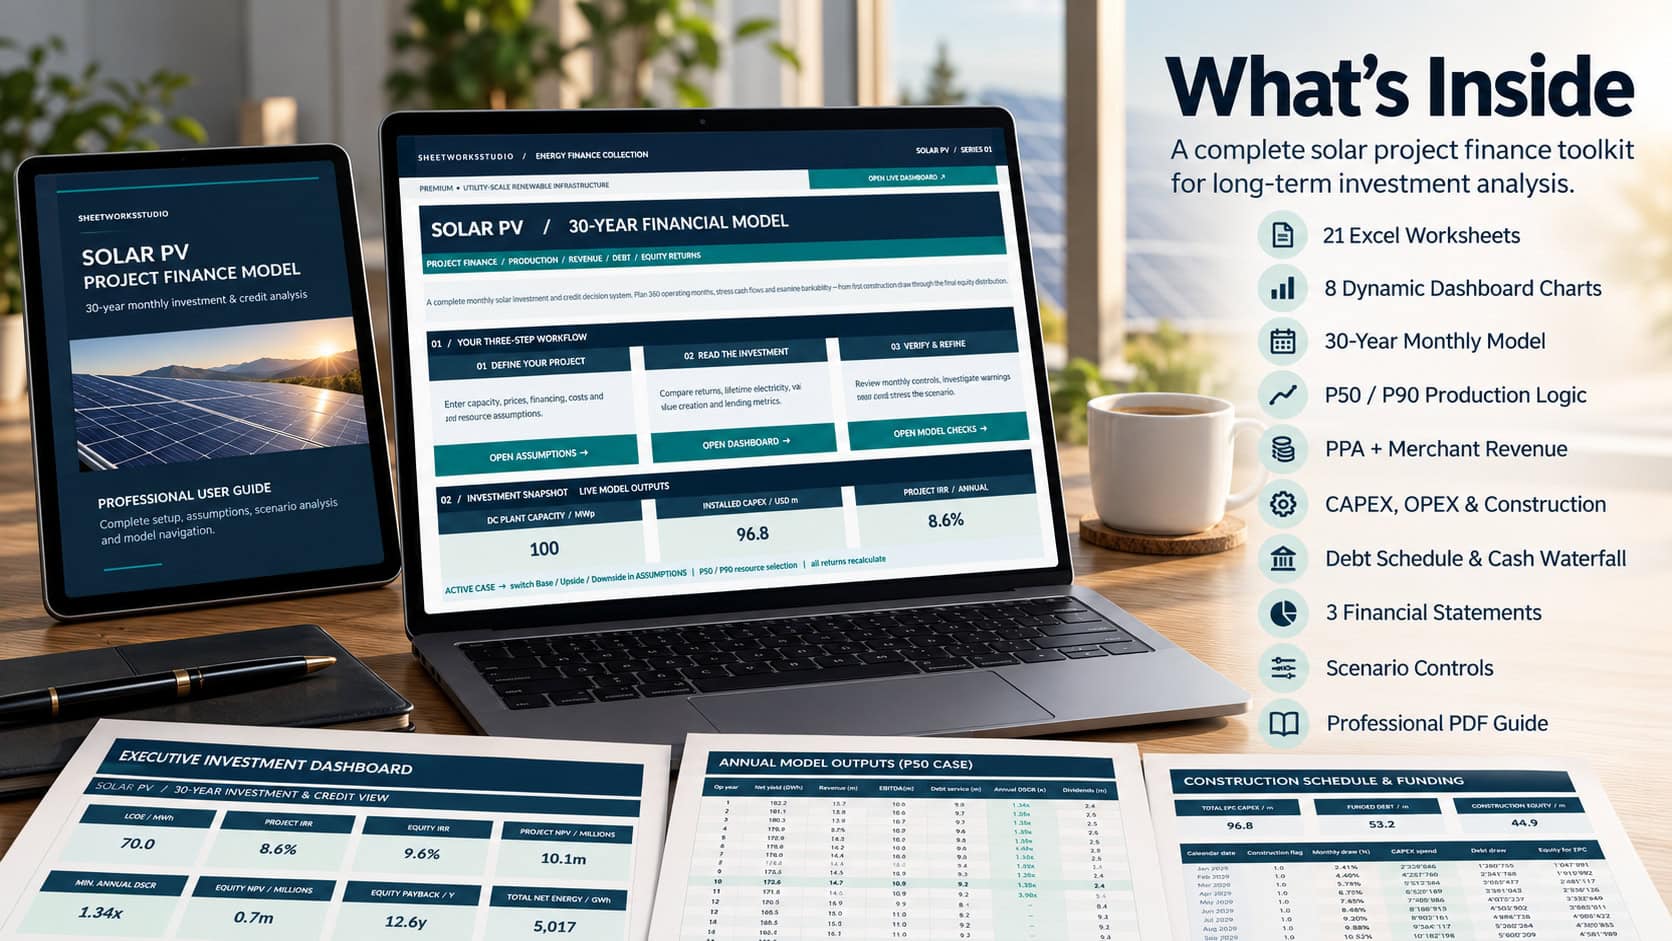
- 21 Integrated Worksheets
- 30-Year Monthly Forecast
- 8 Data-Linked Dashboard Charts
- Industry-Specific Solar Production Calculations
- PPA and Merchant Revenue Analysis
- CAPEX and OPEX Planning
- Project Debt and Cash Waterfall
- Three-Statement Financial Reporting
- Project and Equity Returns
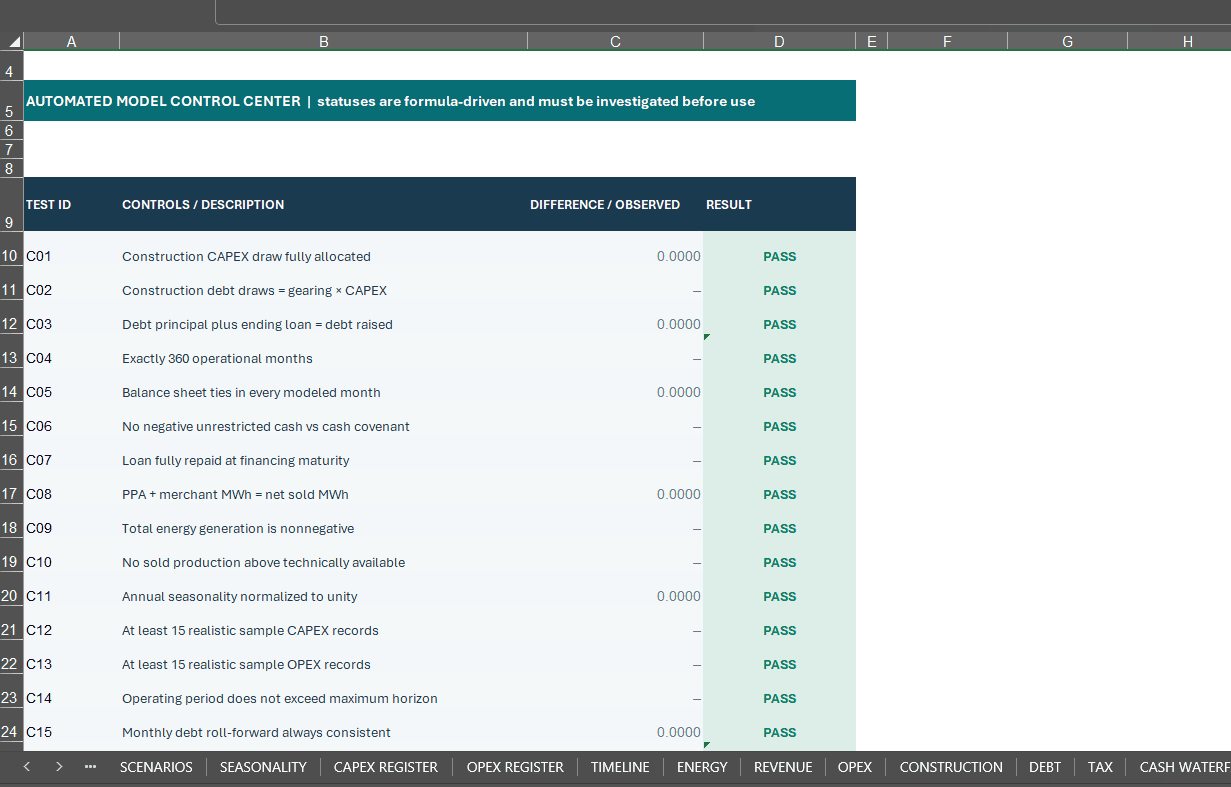
- Scenario Controls and Model Integrity Checks
- Navigation and Illustrative Sample Data
2. Professional How-to-Use Guide (32-Page PDF)
A detailed English-language manual covering model setup, technical assumptions, solar resource selection, energy production, revenue modeling, project costs, debt financing, DSCR, cash flow, financial statements, return metrics, scenarios and troubleshooting.
IDEAL FOR
- Solar PV Project Developers
- Independent Power Producers (IPPs)
- Renewable Energy Investors
- Infrastructure Investment Teams
- Project Finance Analysts
- Financial Modeling Consultants
- Project Sponsors
- Investment Advisors
- Corporate Finance Professionals
- Energy Project Consultants
Typical applications include preliminary project feasibility, illustrative financial evaluation, financing structure reviews, scenario comparisons, investment return analysis and internal management reporting.
⚙️ HOW TO USE THE MODEL
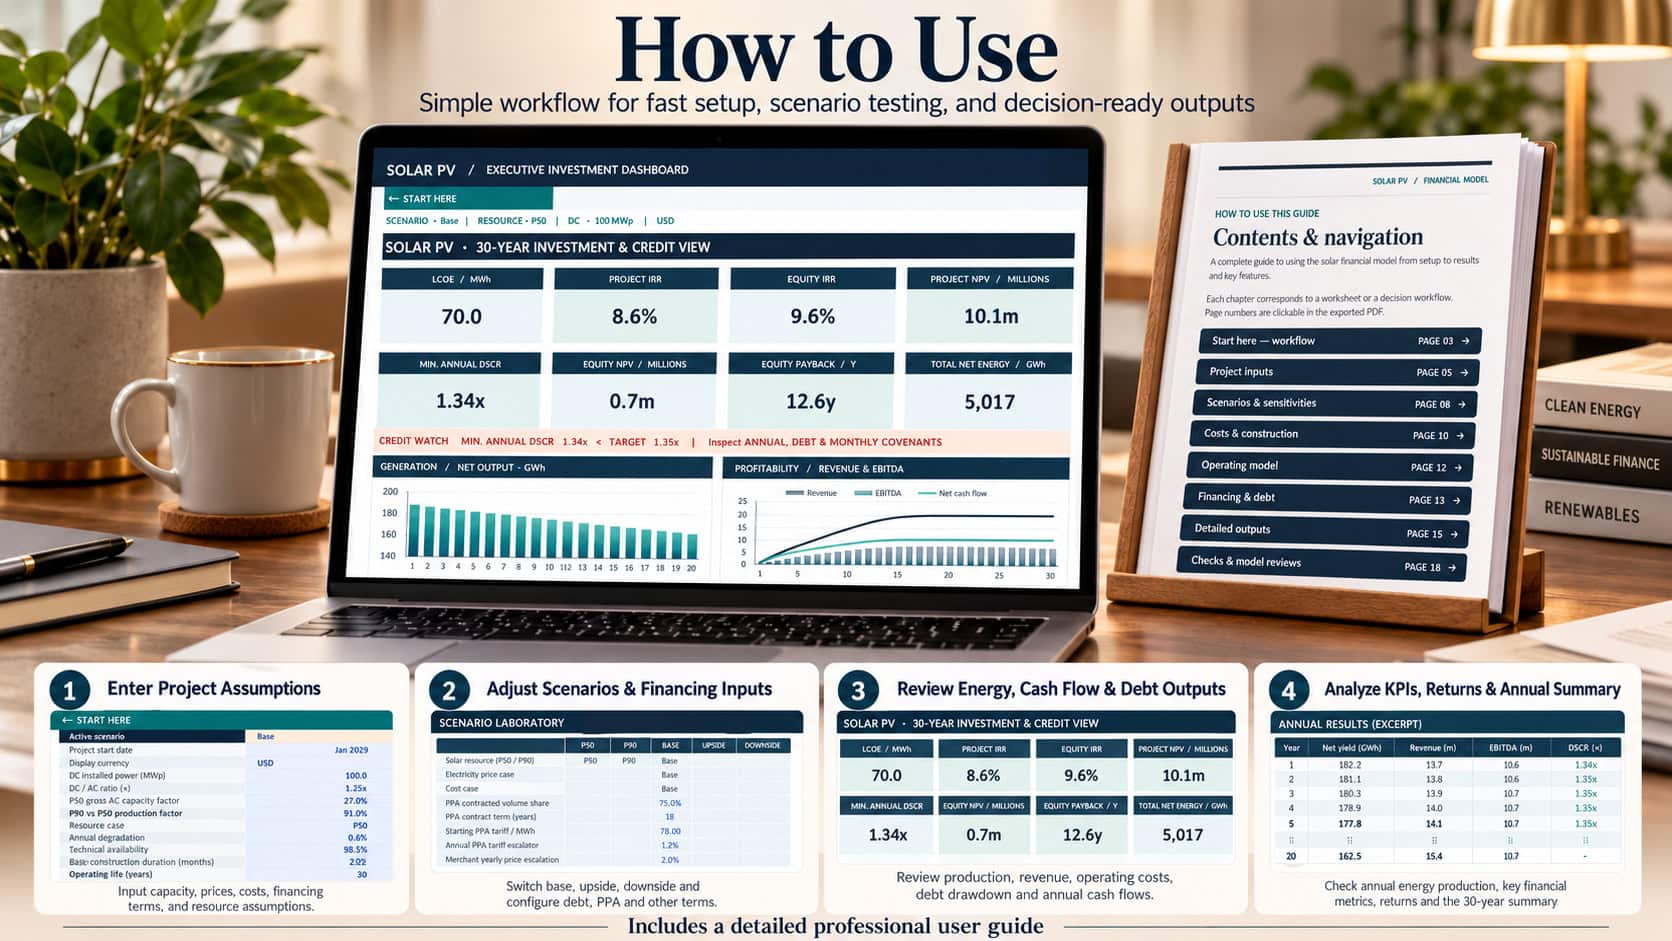
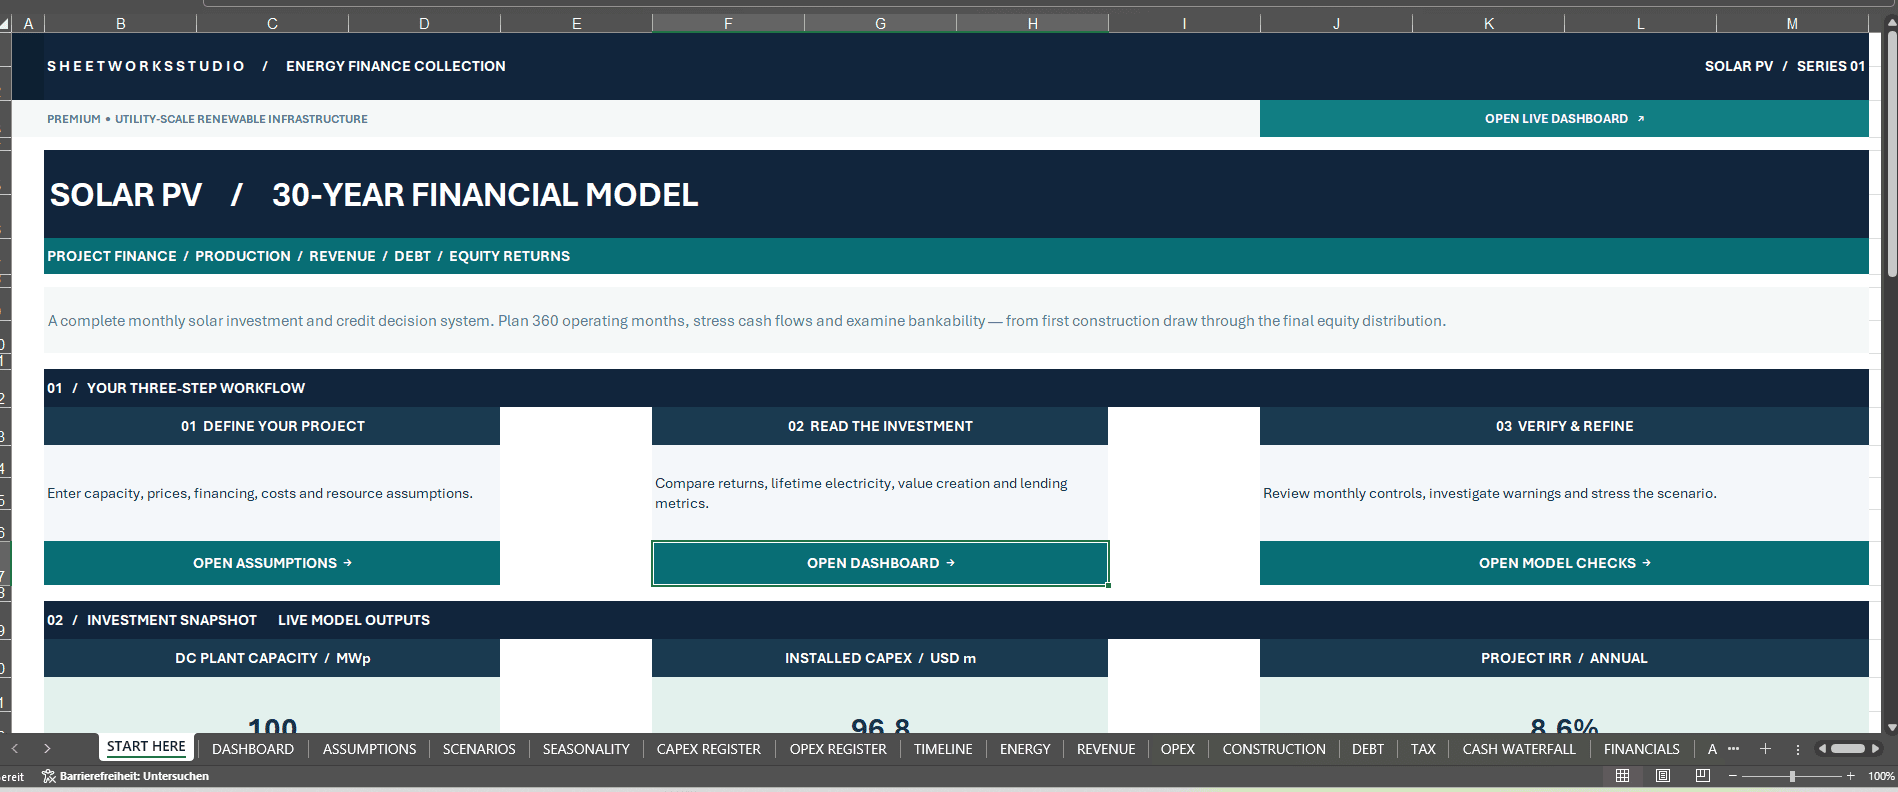
Step 1 — Define Project Assumptions
Open START HERE and configure the relevant technical, commercial, construction and financing inputs.
Step 2 — Select Scenarios
Choose Base, Upside, Downside or Custom and select the preferred P50/P90 production case.
Step 3 — Review Operating and Financing Schedules
Analyze ENERGY, REVENUE, CONSTRUCTION, DEBT, TAX, CASH WATERFALL and FINANCIALS.
Step 4 — Evaluate Project Performance
Review DASHBOARD, ANNUAL, RETURNS and CHECKS to examine project economics and model consistency.
Step 5 — Compare Alternatives
Adjust assumptions and review how production, electricity prices, construction costs and financing conditions affect the results.
TECHNICAL SPECIFICATIONS
- File Format: Microsoft Excel (.xlsx)
- Forecast Horizon: 30 Years
- Forecast Frequency: Monthly
- Workbook Structure: 21 Worksheets
- Executive Dashboard: 8 Charts
- Scenarios: Base, Upside, Downside and Custom
- Resource Cases: P50 and P90
- Financial Reporting: Monthly and Annual
- Financial Statements: Integrated
- Formulas: Editable and Visible
- Macros: Not Required
- External Data Connections: None
- User Documentation: 32-Page PDF
- Sample Data: Fictional and Illustrative
Microsoft Excel Desktop is the recommended environment.
Google Sheets import and functional compatibility have not been independently validated. Equivalent formula behavior, charts, navigation and formatting are therefore not guaranteed.
IMPORTANT MODEL LIMITATIONS & DISCLAIMER
This product is an independent, illustrative financial modeling template. It is not a bank-certified model and does not constitute financial, investment, legal, accounting, tax, engineering or project-specific technical advice.
The P90 resource case is modeled using a configurable deterministic adjustment and does not replace a professional solar resource assessment.
Financing and DSCR warnings are analytical outputs. Passing internal model checks does not establish compliance with lender covenants or financing agreements.
Real project results depend on independently verified technical studies, site-specific energy assessments, PPA contracts, construction quotations, financing terms, applicable taxation and regulatory requirements.
Users must independently review all assumptions, formulas, calculations and project outputs before relying on the model for financial or investment decisions.
This is a digital product. No physical item will be shipped.
Developed by SheetworksStudio – Professional Financial Models & Business Decision Tools.
Similar ProductsOther customers were also interested in...


 eFinancialModels
Electric Vehicle (EV) Charging Station Financial M...
With this comprehensive 5- or 10-year monthly tool, investors can assess the viability of setting up... Read more

Financial Model for Mobile App | Mobile App Busine...
The Mobile App Financial Plan Template in Excel allows you to develop financial projections when lau... Read more

 HenrySheykin
Food Truck Financial Model Excel Template
The Food Truck Financial Model helps entrepreneurs, founders, business owners, consultants, and anal... Read more

Green Hydrogen Production from Wind Energy Financi...
The Green Hydrogen from Wind Financial Model aims to comprehensively forecast a horizon of 40 years ... Read more

Simple Mutual Non-Disclosure Agreement Template
Protect your business secrets with ease using our Simple Mutual Non-Disclosure Agreement Template. S... Read more

Solar Energy Financial Model
The Solar Energy Financial Model Spreadsheet Template in Excel assists you in preparing a sophistica... Read more

 Peter Graf
The Customer-Centric Financial Model for Restauran...
Starting a restaurant without a financial plan is like driving a car blindfolded. You wouldn´t do i... Read more
You must log in to submit a review.