
0 ITEMS

Retail Company Open-to-Buy, Inventory, Omnichannel Profitability & 5-Year Financial Model
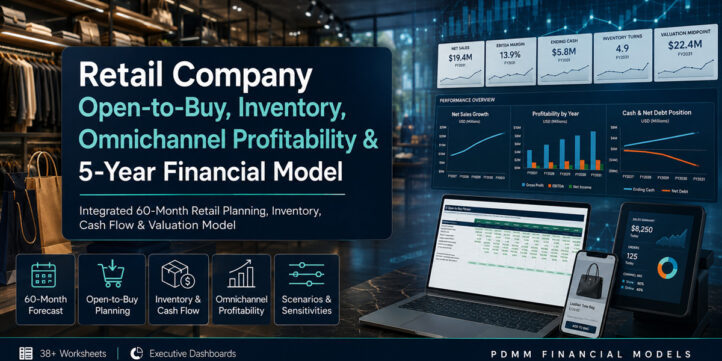
Turn retail planning into one connected operating and financial decision system. This premium Excel model is designed for retailers that need more than a simple sales forecast. It links physical-store demand, e-commerce demand, markdowns, returns, shrink, merchandise purchasing, open-to-buy planning, inventory coverage, working capital, staffing, store economics, financing and valuation into one integrated 60-month model. The workbook includes coherent fictional sample data for Northstar Retail Co. so every schedule, scenario, sensitivity and dashboard is populated on opening and can be replaced with the buyer’s own assumptions.


🛍️ Retail Company Open-to-Buy, Inventory, Omnichannel Profitability & 5-Year Financial Model
Turn retail planning into one connected operating and financial decision system.
This premium Excel model is designed for retailers that need more than a simple sales forecast. It links physical-store demand, e-commerce demand, markdowns, returns, shrink, merchandise purchasing, open-to-buy planning, inventory coverage, working capital, staffing, store economics, financing and valuation into one integrated 60-month model. The workbook includes coherent fictional sample data for Northstar Retail Co. so every schedule, scenario, sensitivity and dashboard is populated on opening and can be replaced with the buyer’s own assumptions.
🎯 What decisions does the model support?
Retail profitability can look healthy on the income statement while cash is trapped in inventory, markdowns quietly erode margin, returns reduce online economics, or expansion creates an unexpected funding gap. This model is built to show those connections explicitly.
Recommended use cases
- Build a five-year monthly retail forecast with annual FY2027-FY2031 summaries.
- Plan open-to-buy purchases and test whether planned inventory receipts are affordable.
- Forecast inventory levels, weeks of supply and inventory turns alongside demand and product cost.
- Analyze markdown, return and shrink leakage and their effect on realized gross margin.
- Compare physical-store and e-commerce profitability before shifting channel investment.
- Test store expansion, opening timing, rent, staffing and local contribution economics.
- Forecast P&L, Balance Sheet and Cash Flow with integrated working capital and financing.
- Evaluate cash headroom, revolver usage, debt amortization and minimum-cash protection.
- Run Downside, Base and Upside scenarios using centralized operating-driver overlays.
- Stress test decisions with six formula-driven sensitivity analyses around sales, gross margin, inventory coverage, markdowns, online mix, returns, conversion, AOV, shrink, productivity and occupancy.
- Review product-category profitability and gross-profit mix to identify where value is being created or diluted.
- Estimate enterprise and equity value using DCF and an exit-EBITDA-multiple cross-check.
⚙️ How the model works
The operating logic begins with store traffic and conversion, store average order value, online visits, online conversion and online AOV. Gross demand is then adjusted for markdowns and returns to produce channel net sales. Product-category mix and gross-margin assumptions feed product cost, while return-to-stock logic, shrink and inventory coverage requirements flow into the merchandise financial plan and open-to-buy engine.
The inventory model rolls beginning inventory, purchases/receipts, product cost, shrink and ending inventory by month. Supplier payable terms and other working-capital assumptions translate merchandise decisions into cash requirements. Payroll, occupancy, marketing, e-commerce processing, fulfillment, shipping subsidies, return processing and other operating expenses then build EBITDA and EBIT. Capex, depreciation, taxes, term debt and revolver mechanics complete the fully integrated three statements.
The result is a model where a change to a centralized assumption can flow through demand, inventory, margin, cash, debt and valuation rather than being isolated in a disconnected planning sheet.
✏️ Editable inputs and setup
The workbook clearly separates user-editable assumptions from calculations. Core editable areas include company and forecast assumptions, tax and minimum cash, growth rates, return rates, markdowns, shrink, inventory coverage, gross margin, e-commerce cost assumptions, working-capital days, financing terms, valuation assumptions, seasonality, product categories, store locations and online operating assumptions.
The Product & Category Setup includes up to 20 merchandise categories with sales mix, initial gross margin, markdown rate, return rate, shrink, target weeks, supplier lead time and payable-day assumptions. The Store & Location Setup supports existing and planned locations with opening/closing dates, square footage, traffic, conversion, AOV, rent, staffing and opening capex. The E-Commerce Assumptions sheet centralizes visits, conversion, AOV, growth, returns, processing, fulfillment, shipping, returns processing, marketing and markdown inputs.
🧩 Workbook architecture
01-08 | Setup, controls and input framework
Cover & Navigation provides the model promise, product information and click-through workflow. Instructions & Controls explains model conventions and methodology. Scenario Manager centralizes Downside, Base and Upside overlays. Historical Actuals provides an illustrative starting point and plan-versus-actual bridge. Retail Assumptions, Product & Category Setup, Store & Location Setup and E-Commerce Assumptions contain the core editable operating inputs.
09-18 | Demand, merchandise, open-to-buy and margin engine
Sales & Demand Forecast builds store and online demand, markdowns, returns and net sales. Channel Mix & Unit Economics compares channel sales, orders, AOV, return rates and online contribution. Merchandise Financial Plan, Open-to-Buy Planner, Inventory Roll-Forward and Purchase Orders & Receipts connect merchandise demand to purchases and inventory. Markdown & Promotion, Returns & Refunds, Shrink Damage Obsolescence and Gross Margin Bridge isolate the key sources of realized-margin leakage.
19-26 | Operating costs and financial schedules
Store Economics forecasts locations independently. E-Commerce Contribution analyzes online direct economics. Payroll & Headcount, Operating Expenses, Capex & Depreciation, Working Capital, Debt & Financing and Taxes provide the supporting schedules for the integrated financial statements.
27-31 | Financial statements and profitability
Profit & Loss, Balance Sheet and Cash Flow Statement provide monthly forecasts with annual summaries. Retail KPI Analysis presents decision-focused measures including growth, margin, free cash flow, cash, debt, open stores, channel mix, inventory turns, weeks of supply, markdowns, returns, shrink, sales per store, sales per square foot, break-even sales and margin of safety. Product & Channel Profit highlights category profitability, gross-profit mix and store contribution.
32-38 | Decision analysis, valuation and dashboards
Scenario Comparison shows driver and output bridges across Downside, Base and Upside. Sensitivity Analysis contains six decision matrices. Valuation calculates unlevered DCF, terminal value, enterprise value, equity value, an exit-multiple cross-check and a DCF equity-value sensitivity table. Executive Dashboard, Inventory & OTB Dashboard and Cash & Liquidity Dashboard provide compact management views with KPI cards, charts and action panels. Model Checks independently tests statement balance, cash reconciliation, inventory roll-forward, category mix, liquidity bounds, margin/return/markdown bounds, debt balances and terminal-value mechanics.
🔄 Scenarios and sensitivities
The model includes Downside, Base and Upside scenarios. Scenario-sensitive drivers include traffic, store conversion, AOV, online visits, online conversion, gross margin, markdowns, store and online returns, shrink, inventory coverage, payroll inflation, rent inflation and marketing intensity.
Six sensitivity blocks test: sales growth vs gross margin, inventory weeks vs markdown rate, online mix vs return rate, conversion vs AOV, shrink vs gross margin, and store productivity vs occupancy cost. These sensitivities are formula-driven and do not overwrite the core assumptions.
📊 Dashboards and decision KPIs
The Executive Dashboard focuses on FY2031 net sales, EBITDA, EBITDA margin, ending cash, inventory turns and valuation midpoint. The Inventory & OTB Dashboard focuses on inventory, weeks of supply, inventory turns, OTB purchases, markdown rate and slow-moving inventory. The Cash & Liquidity Dashboard focuses on ending cash, cash flow from operations, free cash flow, net cash, minimum cash and liquidity headroom.
The dashboards are supported by native model outputs and management-action panels so the workbook can be used for planning meetings, lender conversations, budgeting, inventory reviews and investor discussions.
👥 Intended users
This model is designed for independent and growing retailers, specialty-store operators, omnichannel retailers, e-commerce brands adding stores, retail finance teams, CFOs, controllers, accountants, consultants, lenders and investors reviewing a retail business.
📦 Delivered files
The package includes the fully editable client-ready Excel workbook, a 38-page full-sheet PDF preview with one page per worksheet, and a curated set of high-quality buyer-facing screenshots. The workbook contains no macros and is intended to be customized with the buyer’s own operating assumptions and actual data.
Similar ProductsOther customers were also interested in...



 eFinancialModels
Electric Vehicle (EV) Charging Station Financial M...
With this comprehensive 5- or 10-year monthly tool, investors can assess the viability of setting up... Read more

Financial Model for Mobile App | Mobile App Busine...
The Mobile App Financial Plan Template in Excel allows you to develop financial projections when lau... Read more

 HenrySheykin
Food Truck Financial Model Excel Template
The Food Truck Financial Model helps entrepreneurs, founders, business owners, consultants, and anal... Read more

Green Hydrogen Production from Wind Energy Financi...
The Green Hydrogen from Wind Financial Model aims to comprehensively forecast a horizon of 40 years ... Read more

Simple Mutual Non-Disclosure Agreement Template
Protect your business secrets with ease using our Simple Mutual Non-Disclosure Agreement Template. S... Read more

Solar Energy Financial Model
The Solar Energy Financial Model Spreadsheet Template in Excel assists you in preparing a sophistica... Read more

 Peter Graf
The Customer-Centric Financial Model for Restauran...
Starting a restaurant without a financial plan is like driving a car blindfolded. You wouldn´t do i... Read more
You must log in to submit a review.