
0 ITEMS

Restaurant and Cafe Chain Financial Model (Up to 10 Outlets, Monthly 5-Year Forecast, 4-Wall EBITDA, DCF and IRR)
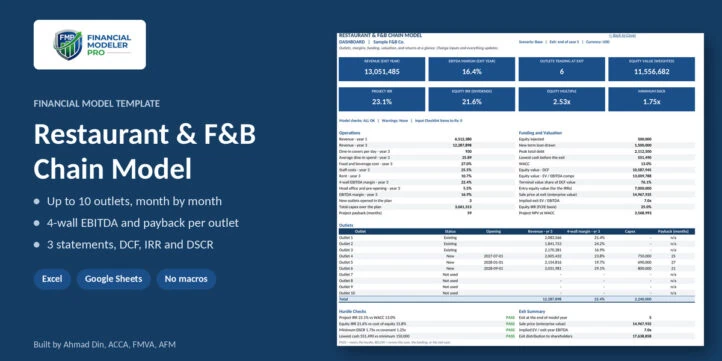
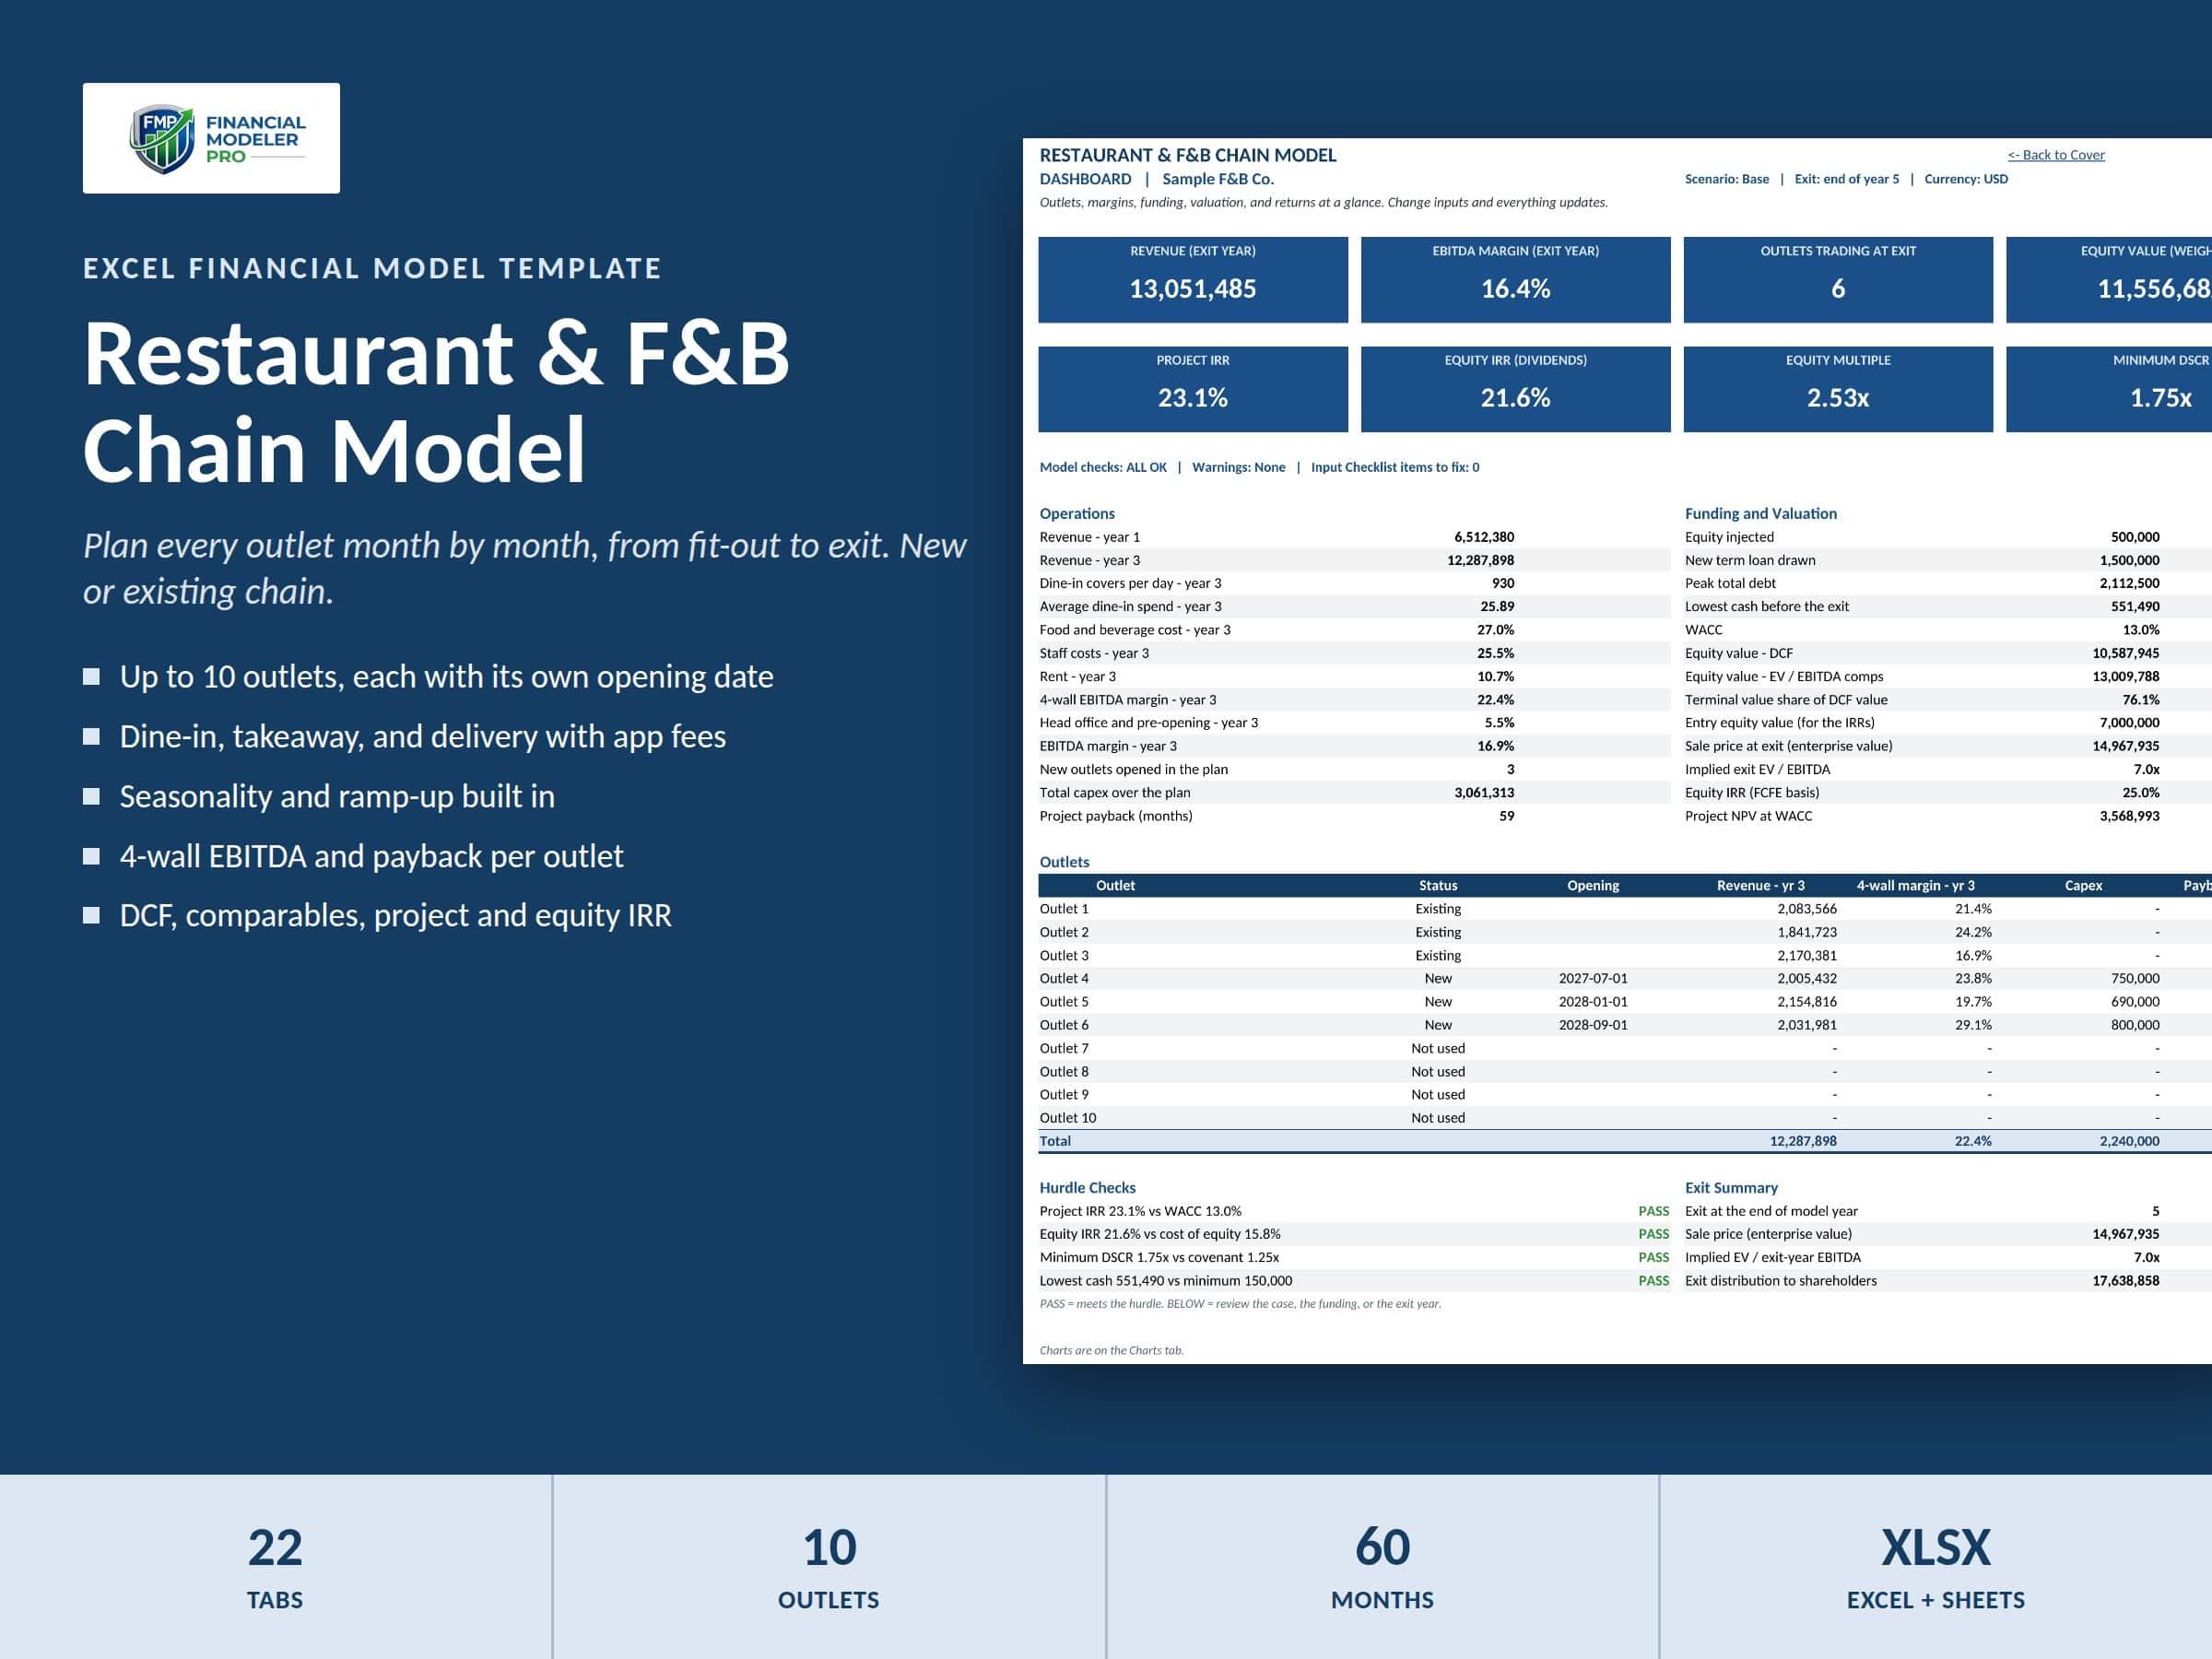
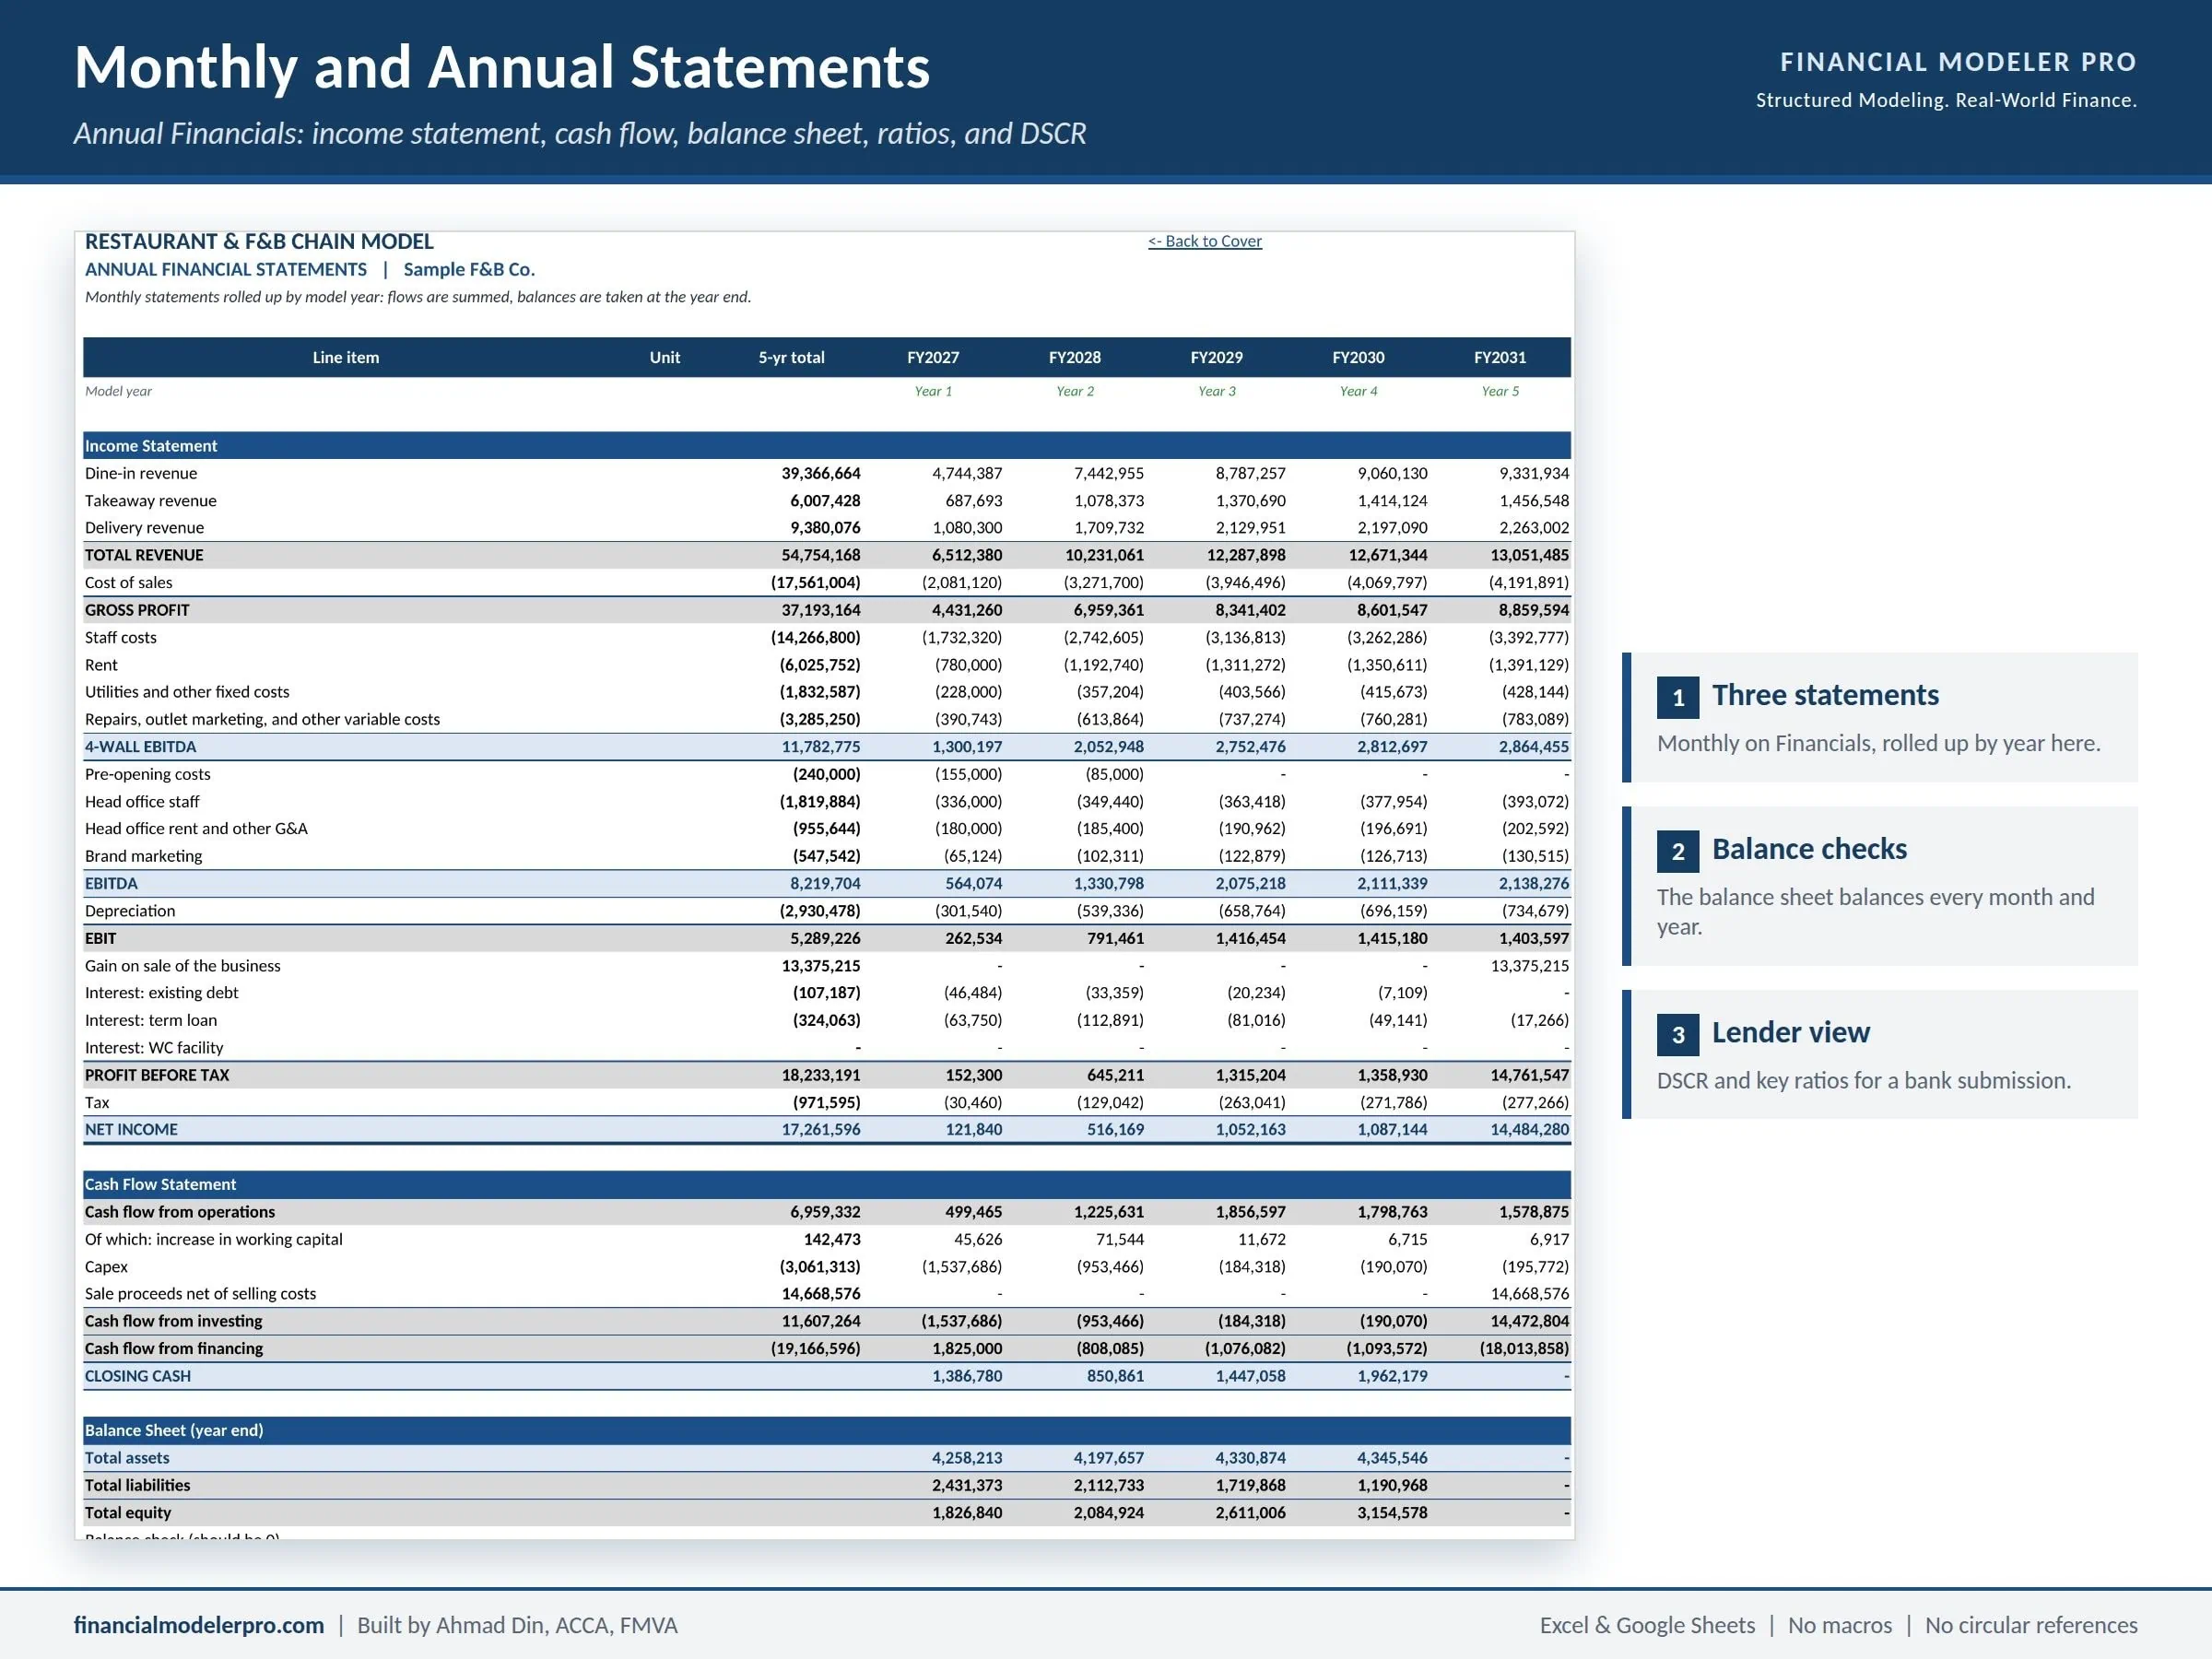
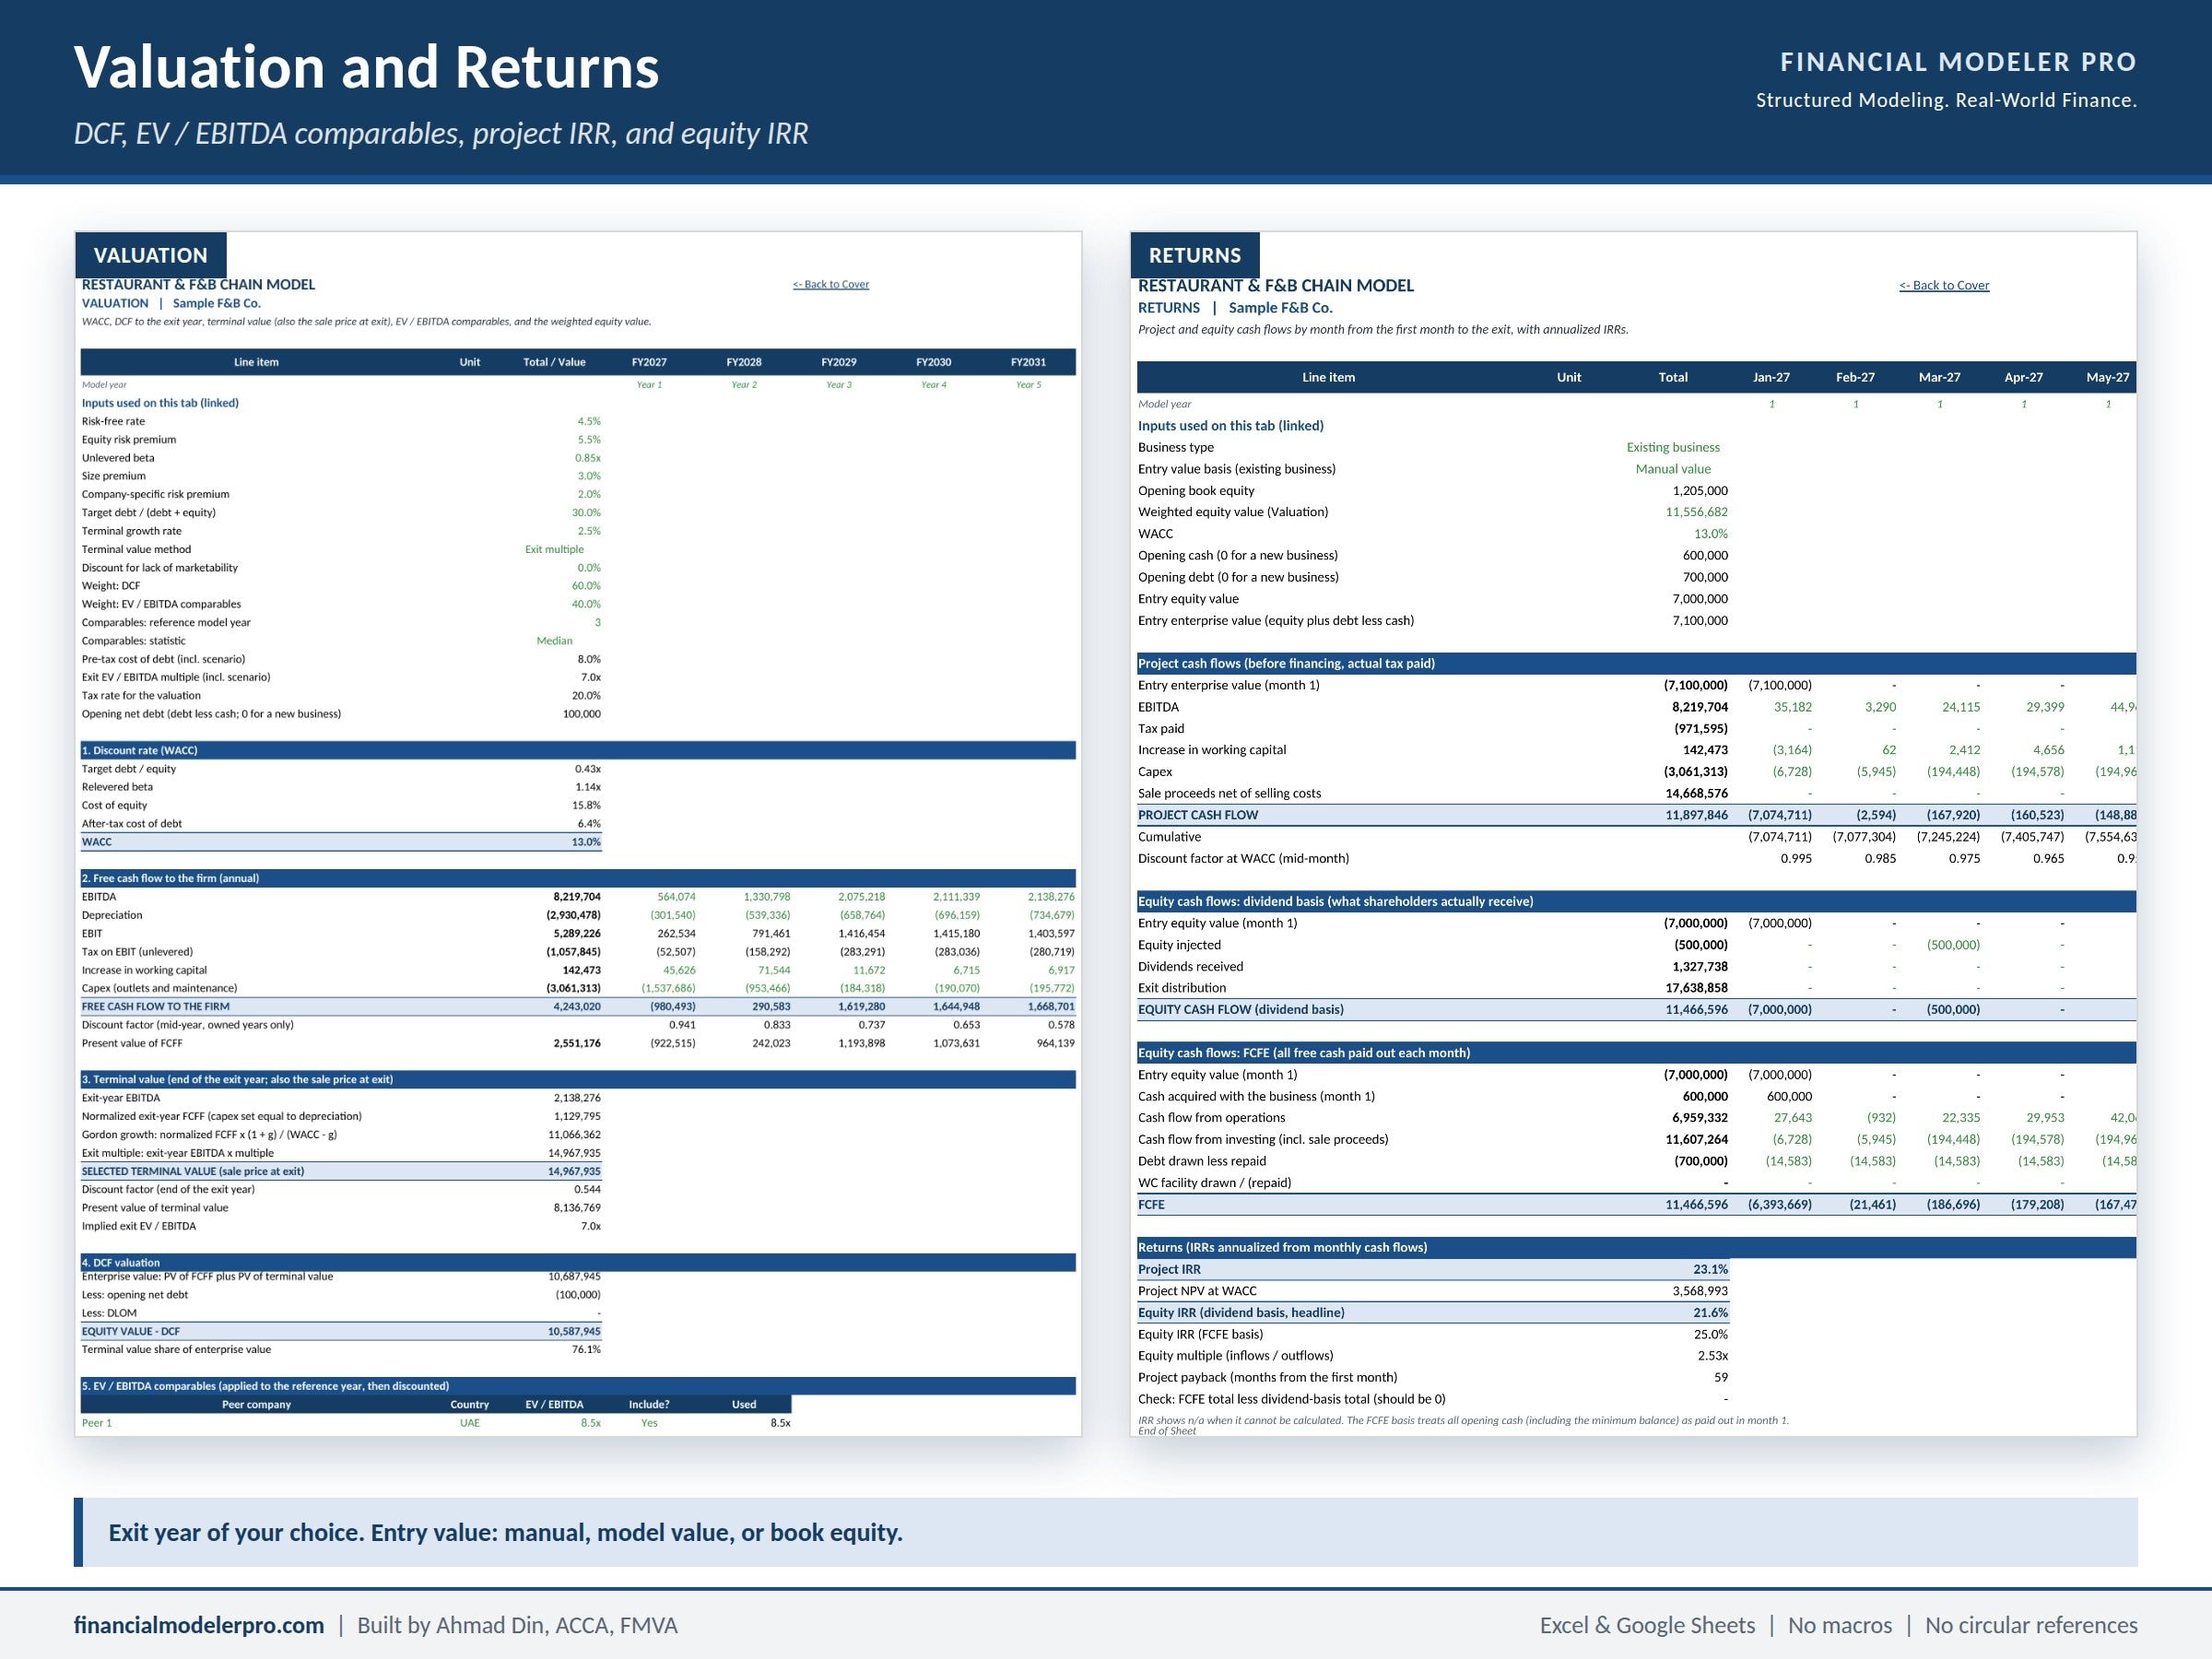
Plan a restaurant, cafe, or quick-service chain of up to 10 outlets, month by month for five years. Each outlet has its own opening date, seats, covers, ramp-up, rent, and staff, and the model shows its 4-wall EBITDA, margin, and payback. Dine-in, takeaway, and delivery are modelled separately, with seasonality and delivery app commission. Outputs include monthly and annual 3-statement financials, a DCF and comparables valuation, and project and equity IRR. Works for a new business or an existing chain, in Excel and Google Sheets, with no macros.
What is this model used for?
This template plans a restaurant business one outlet and one month at a time. It works for a single cafe, a new concept opening its first three sites, or a chain that already trades and wants to add more. You see what every outlet earns on its own, what the whole business looks like, how much cash you need, and what it is worth at exit.
Use it for a business plan, a bank loan, an investor deck, a lease decision on a new site, or a roll-out plan. The sample case is a six-outlet chain in USD with generic names, and every figure can be replaced with your own.
What is included?
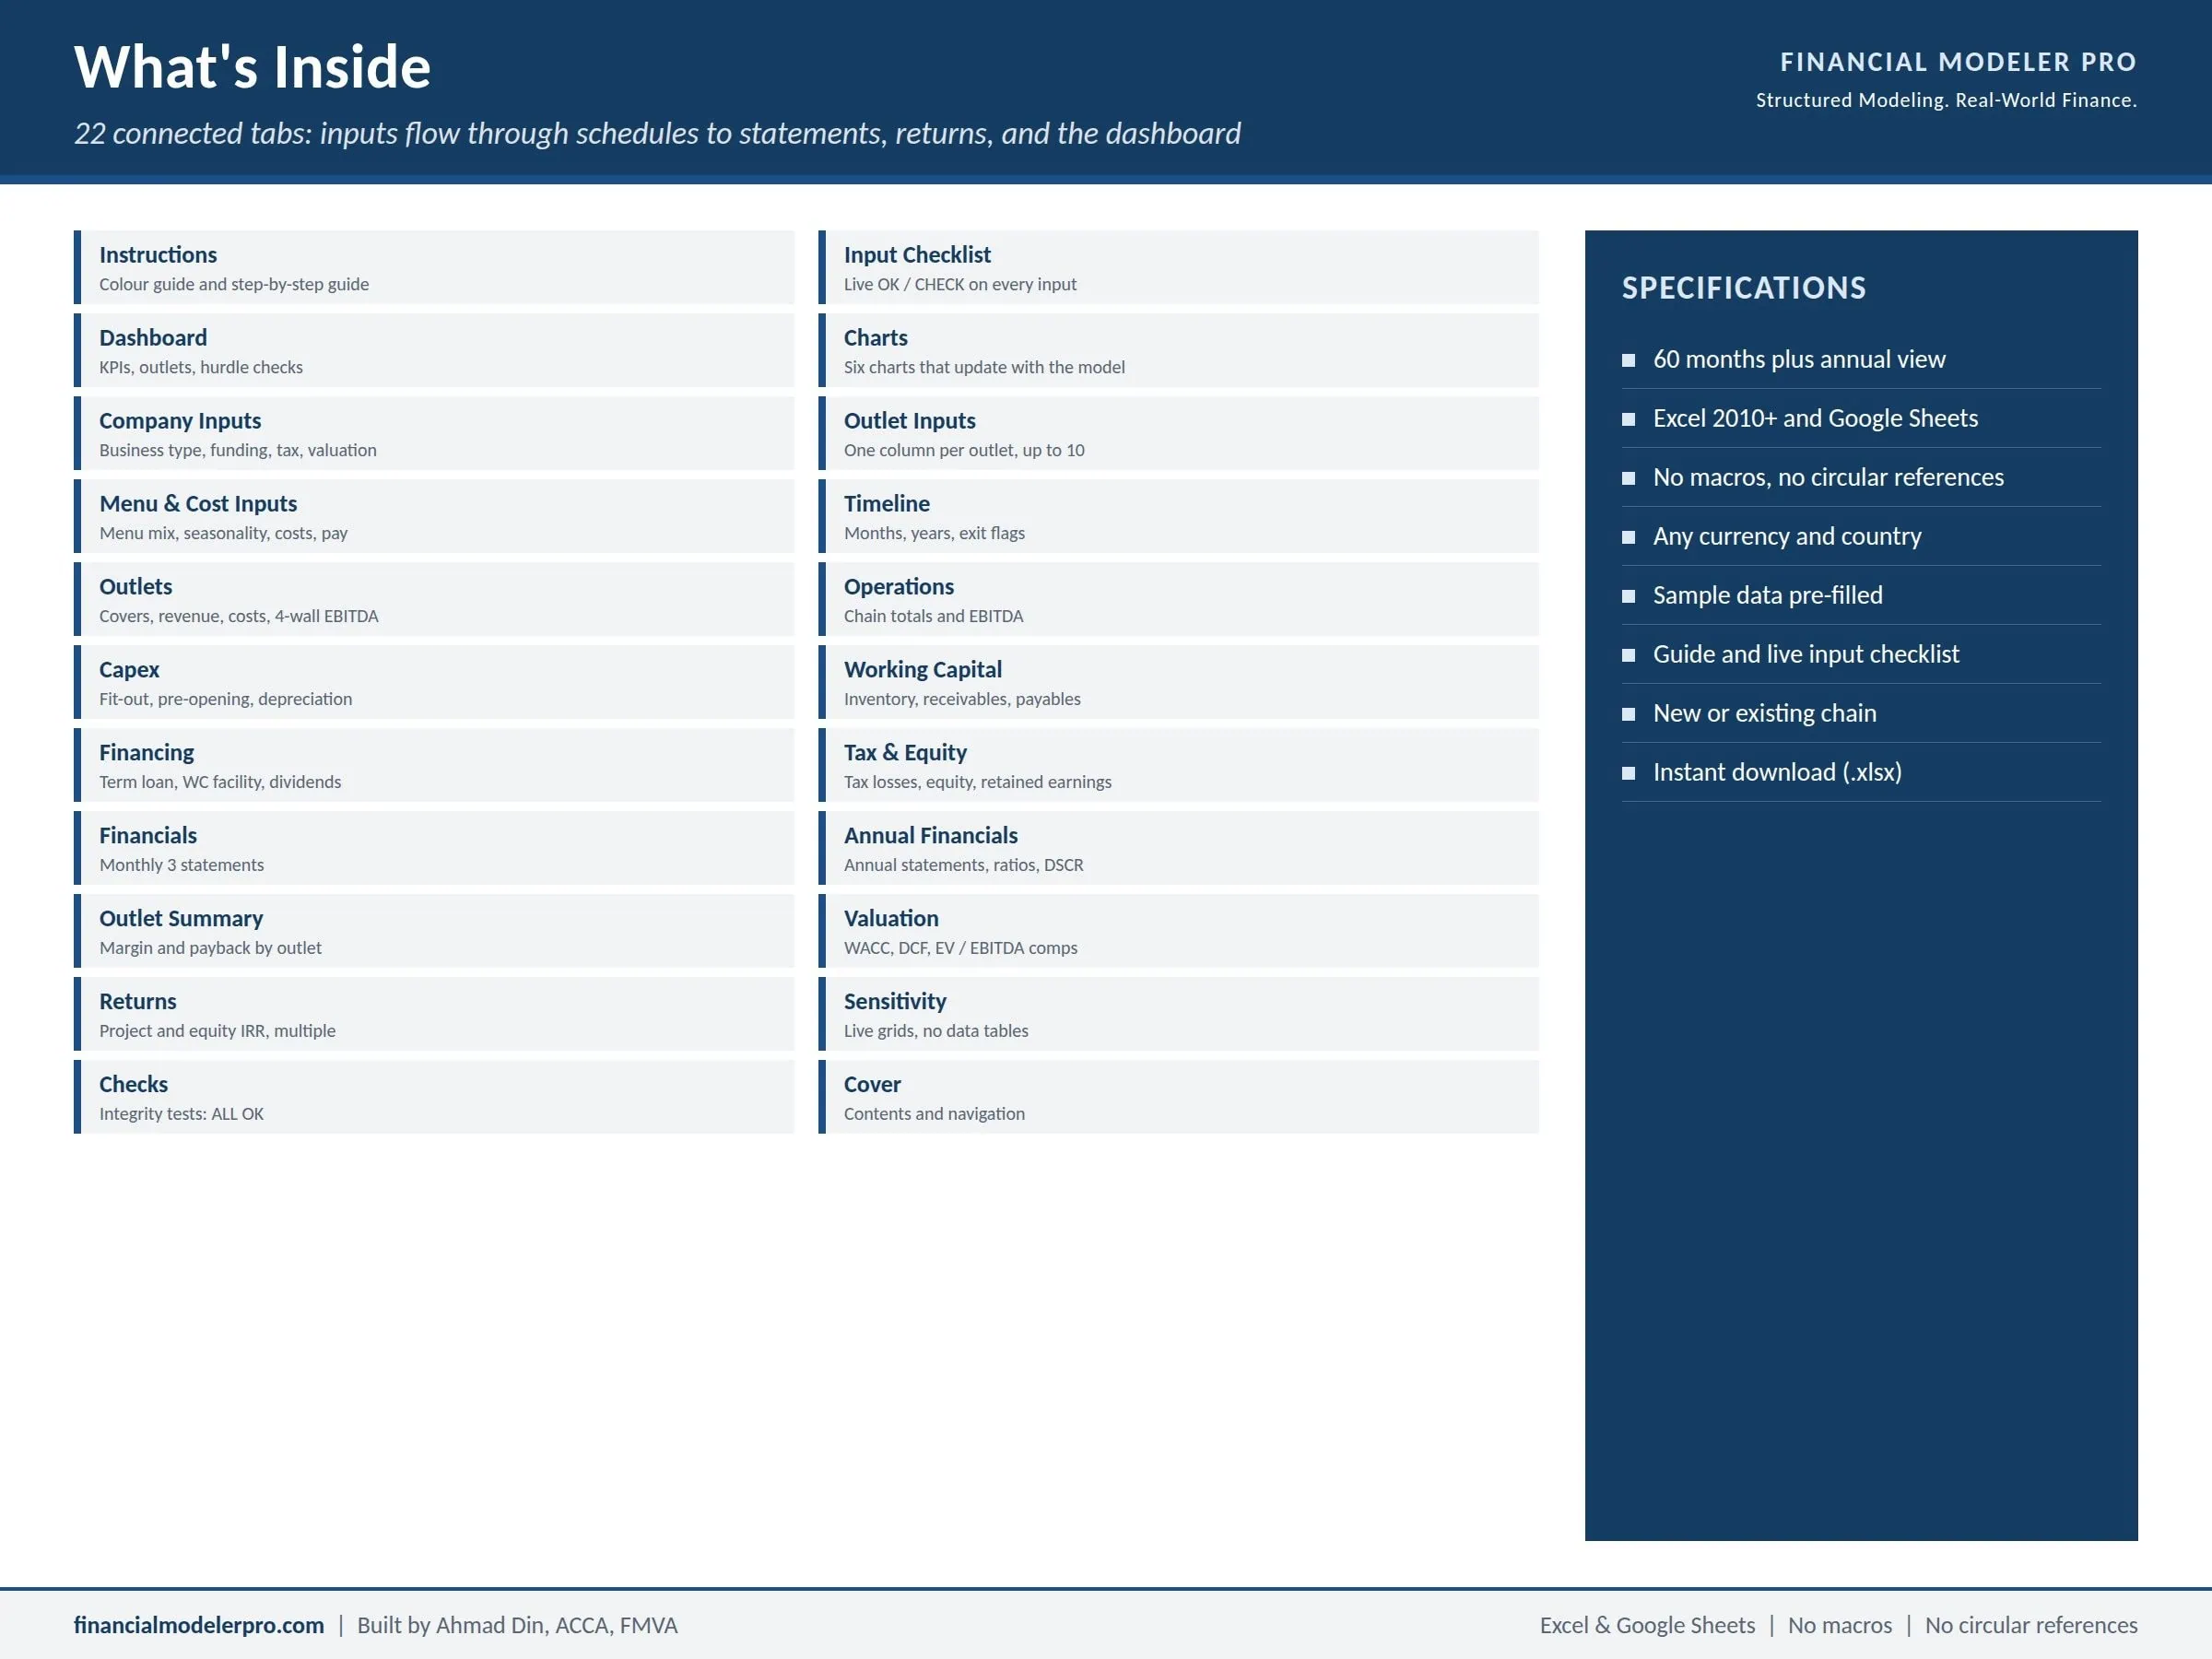
One Excel workbook with 22 linked tabs:
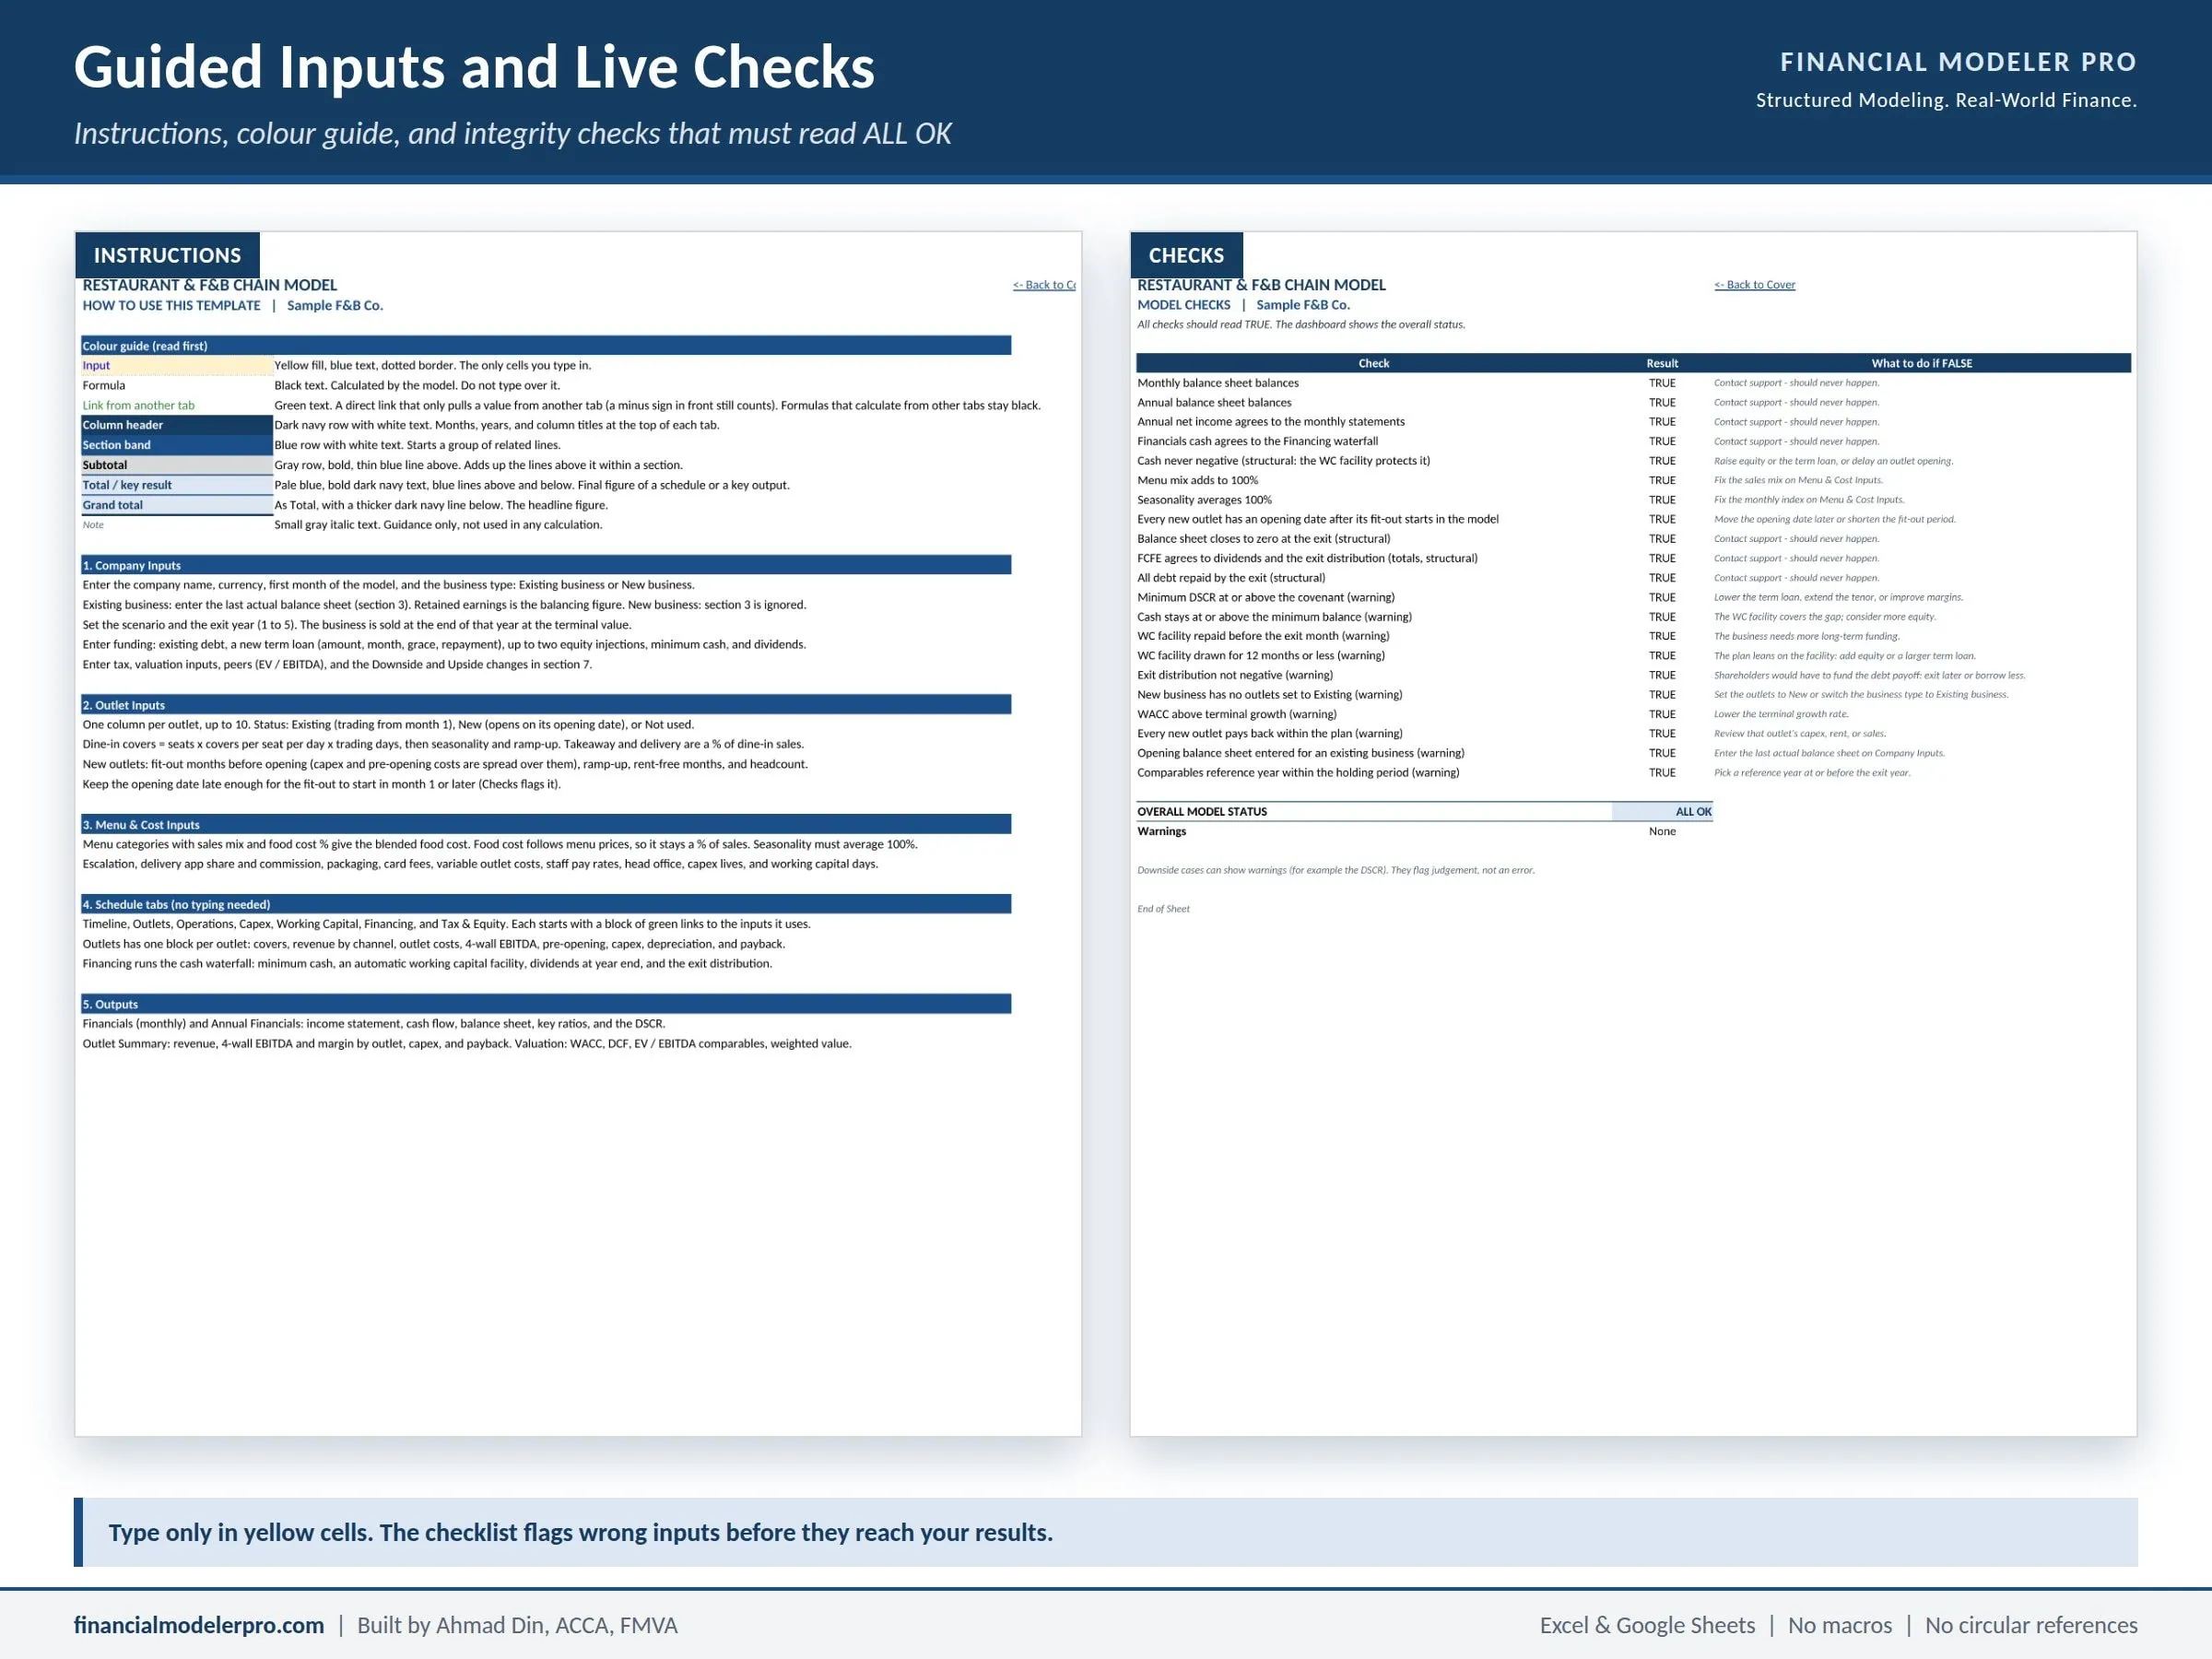
- Cover, Instructions, and an Input Checklist that shows OK or CHECK for each input group
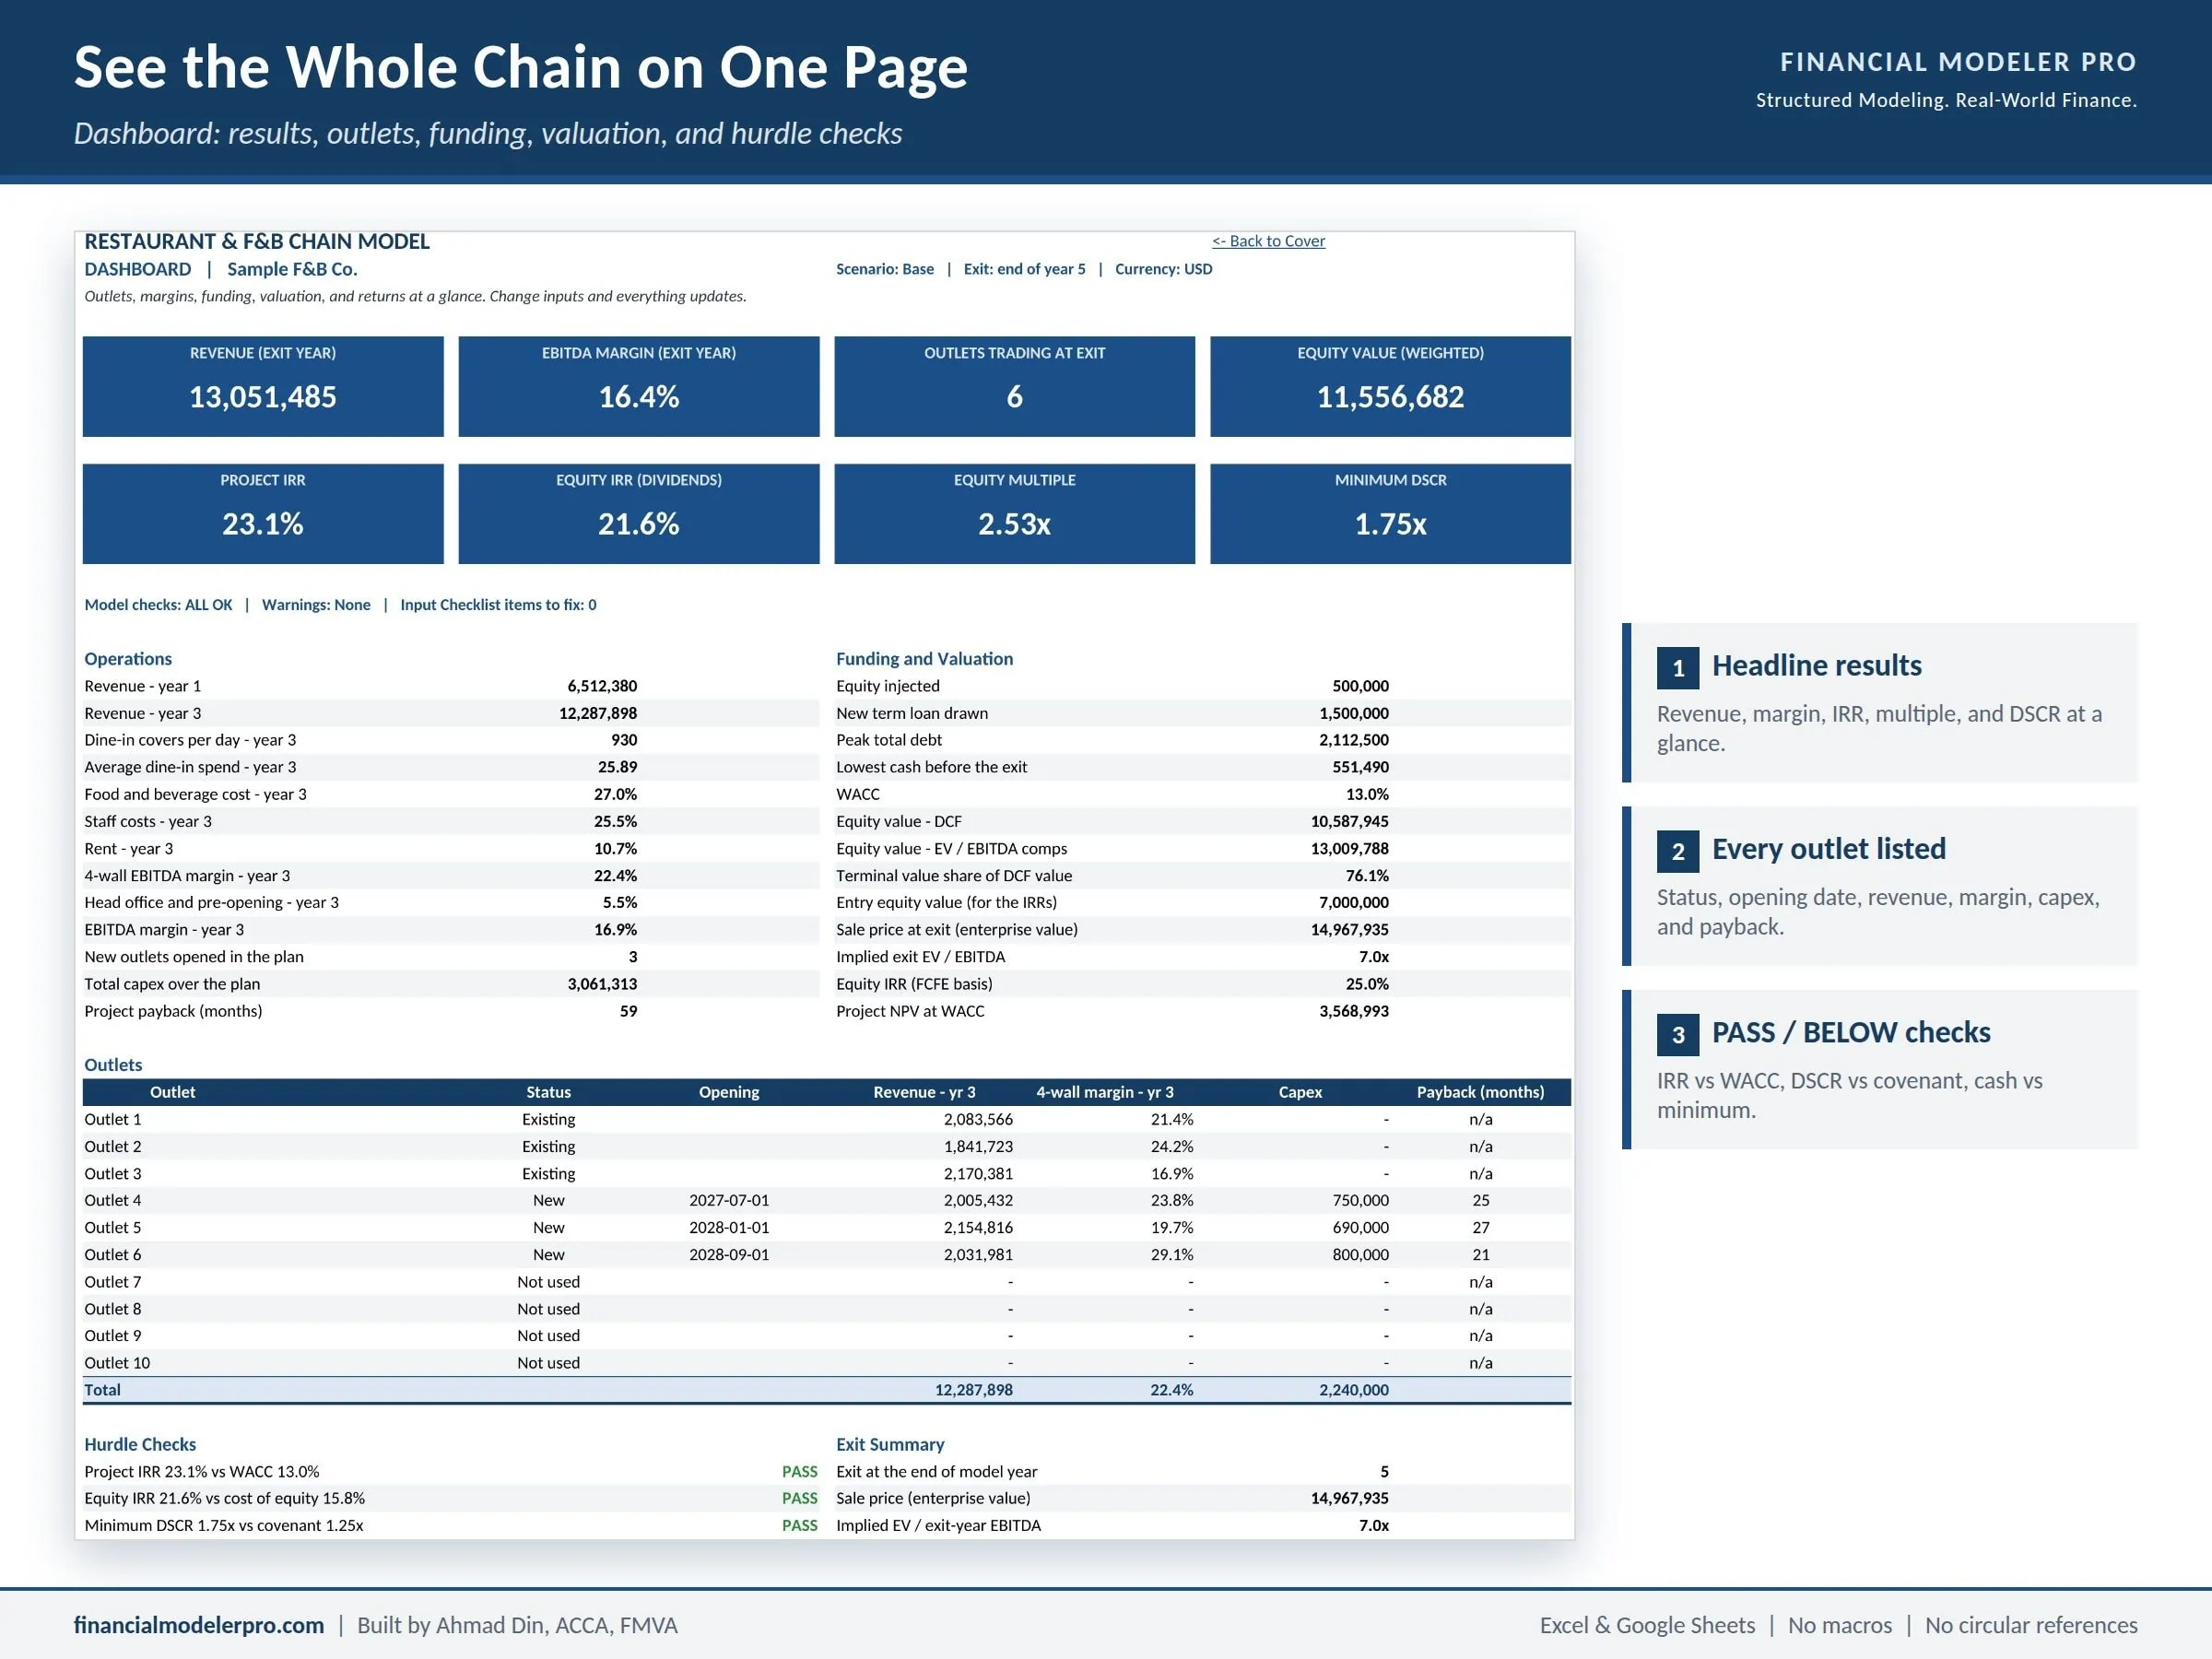
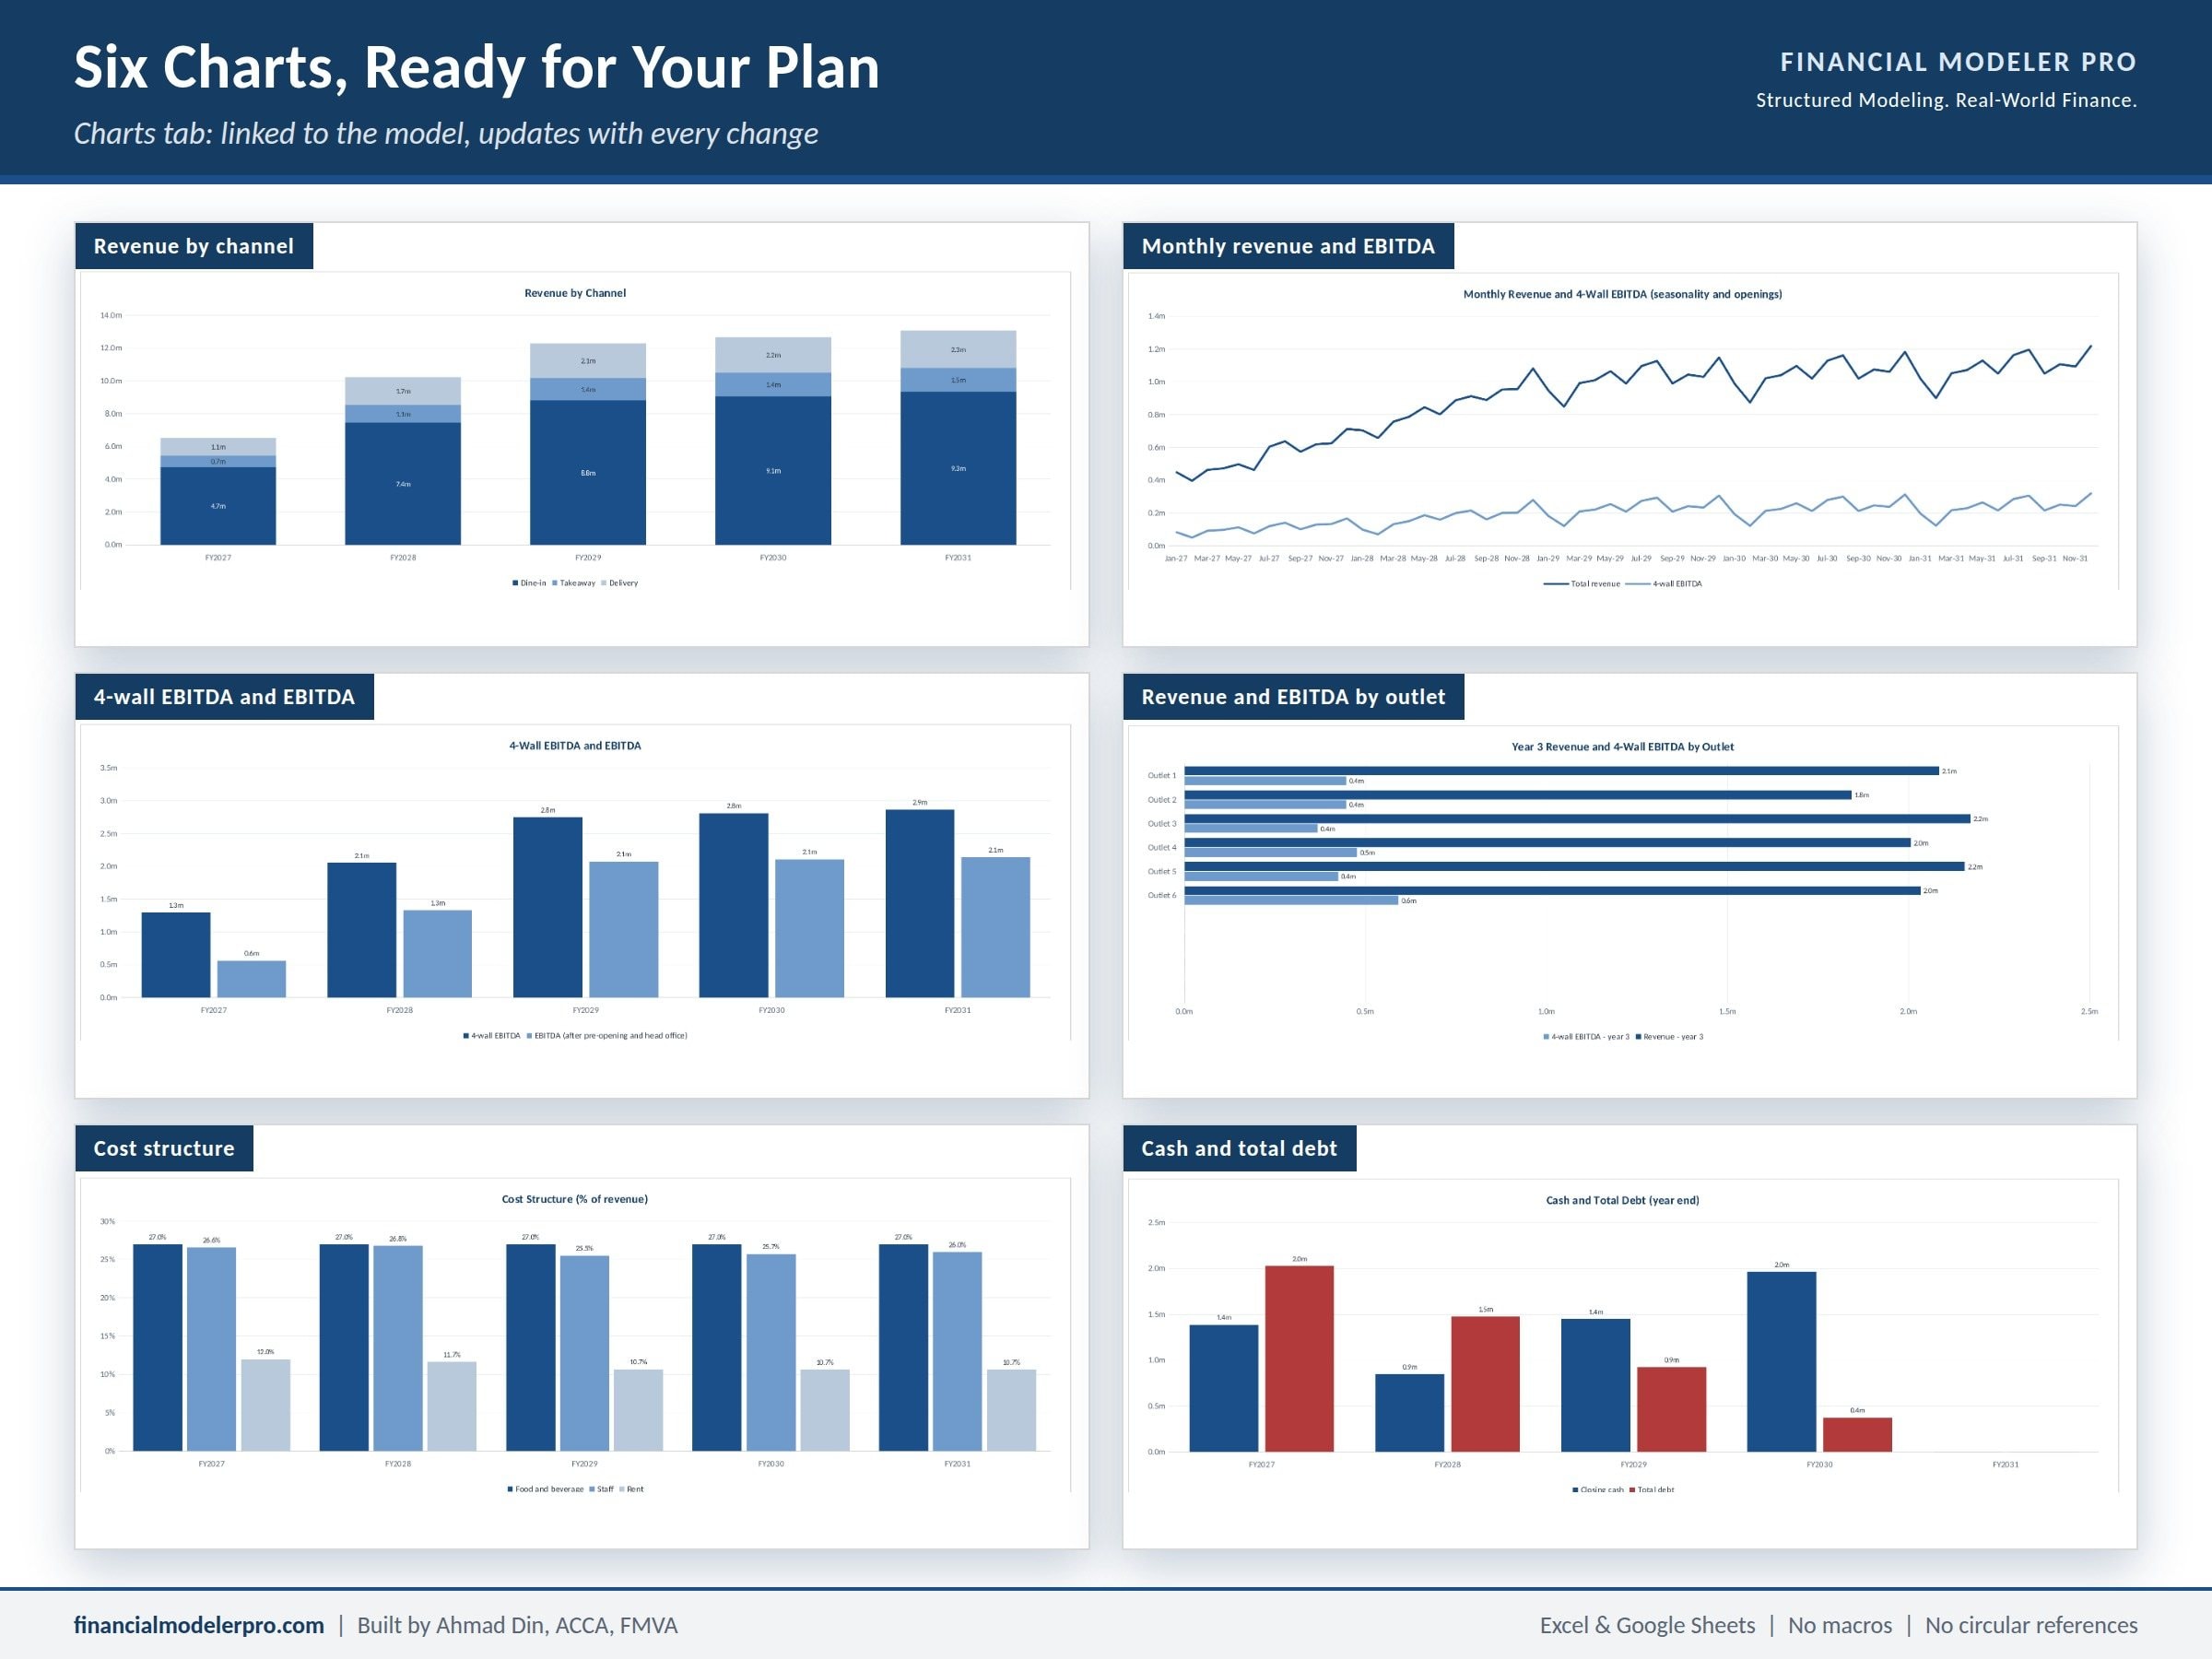
- Dashboard with eight headline KPIs and hurdle checks, plus a Charts tab with six charts
- Company Inputs: business type, scenario, exit year, funding, tax, valuation, and peers
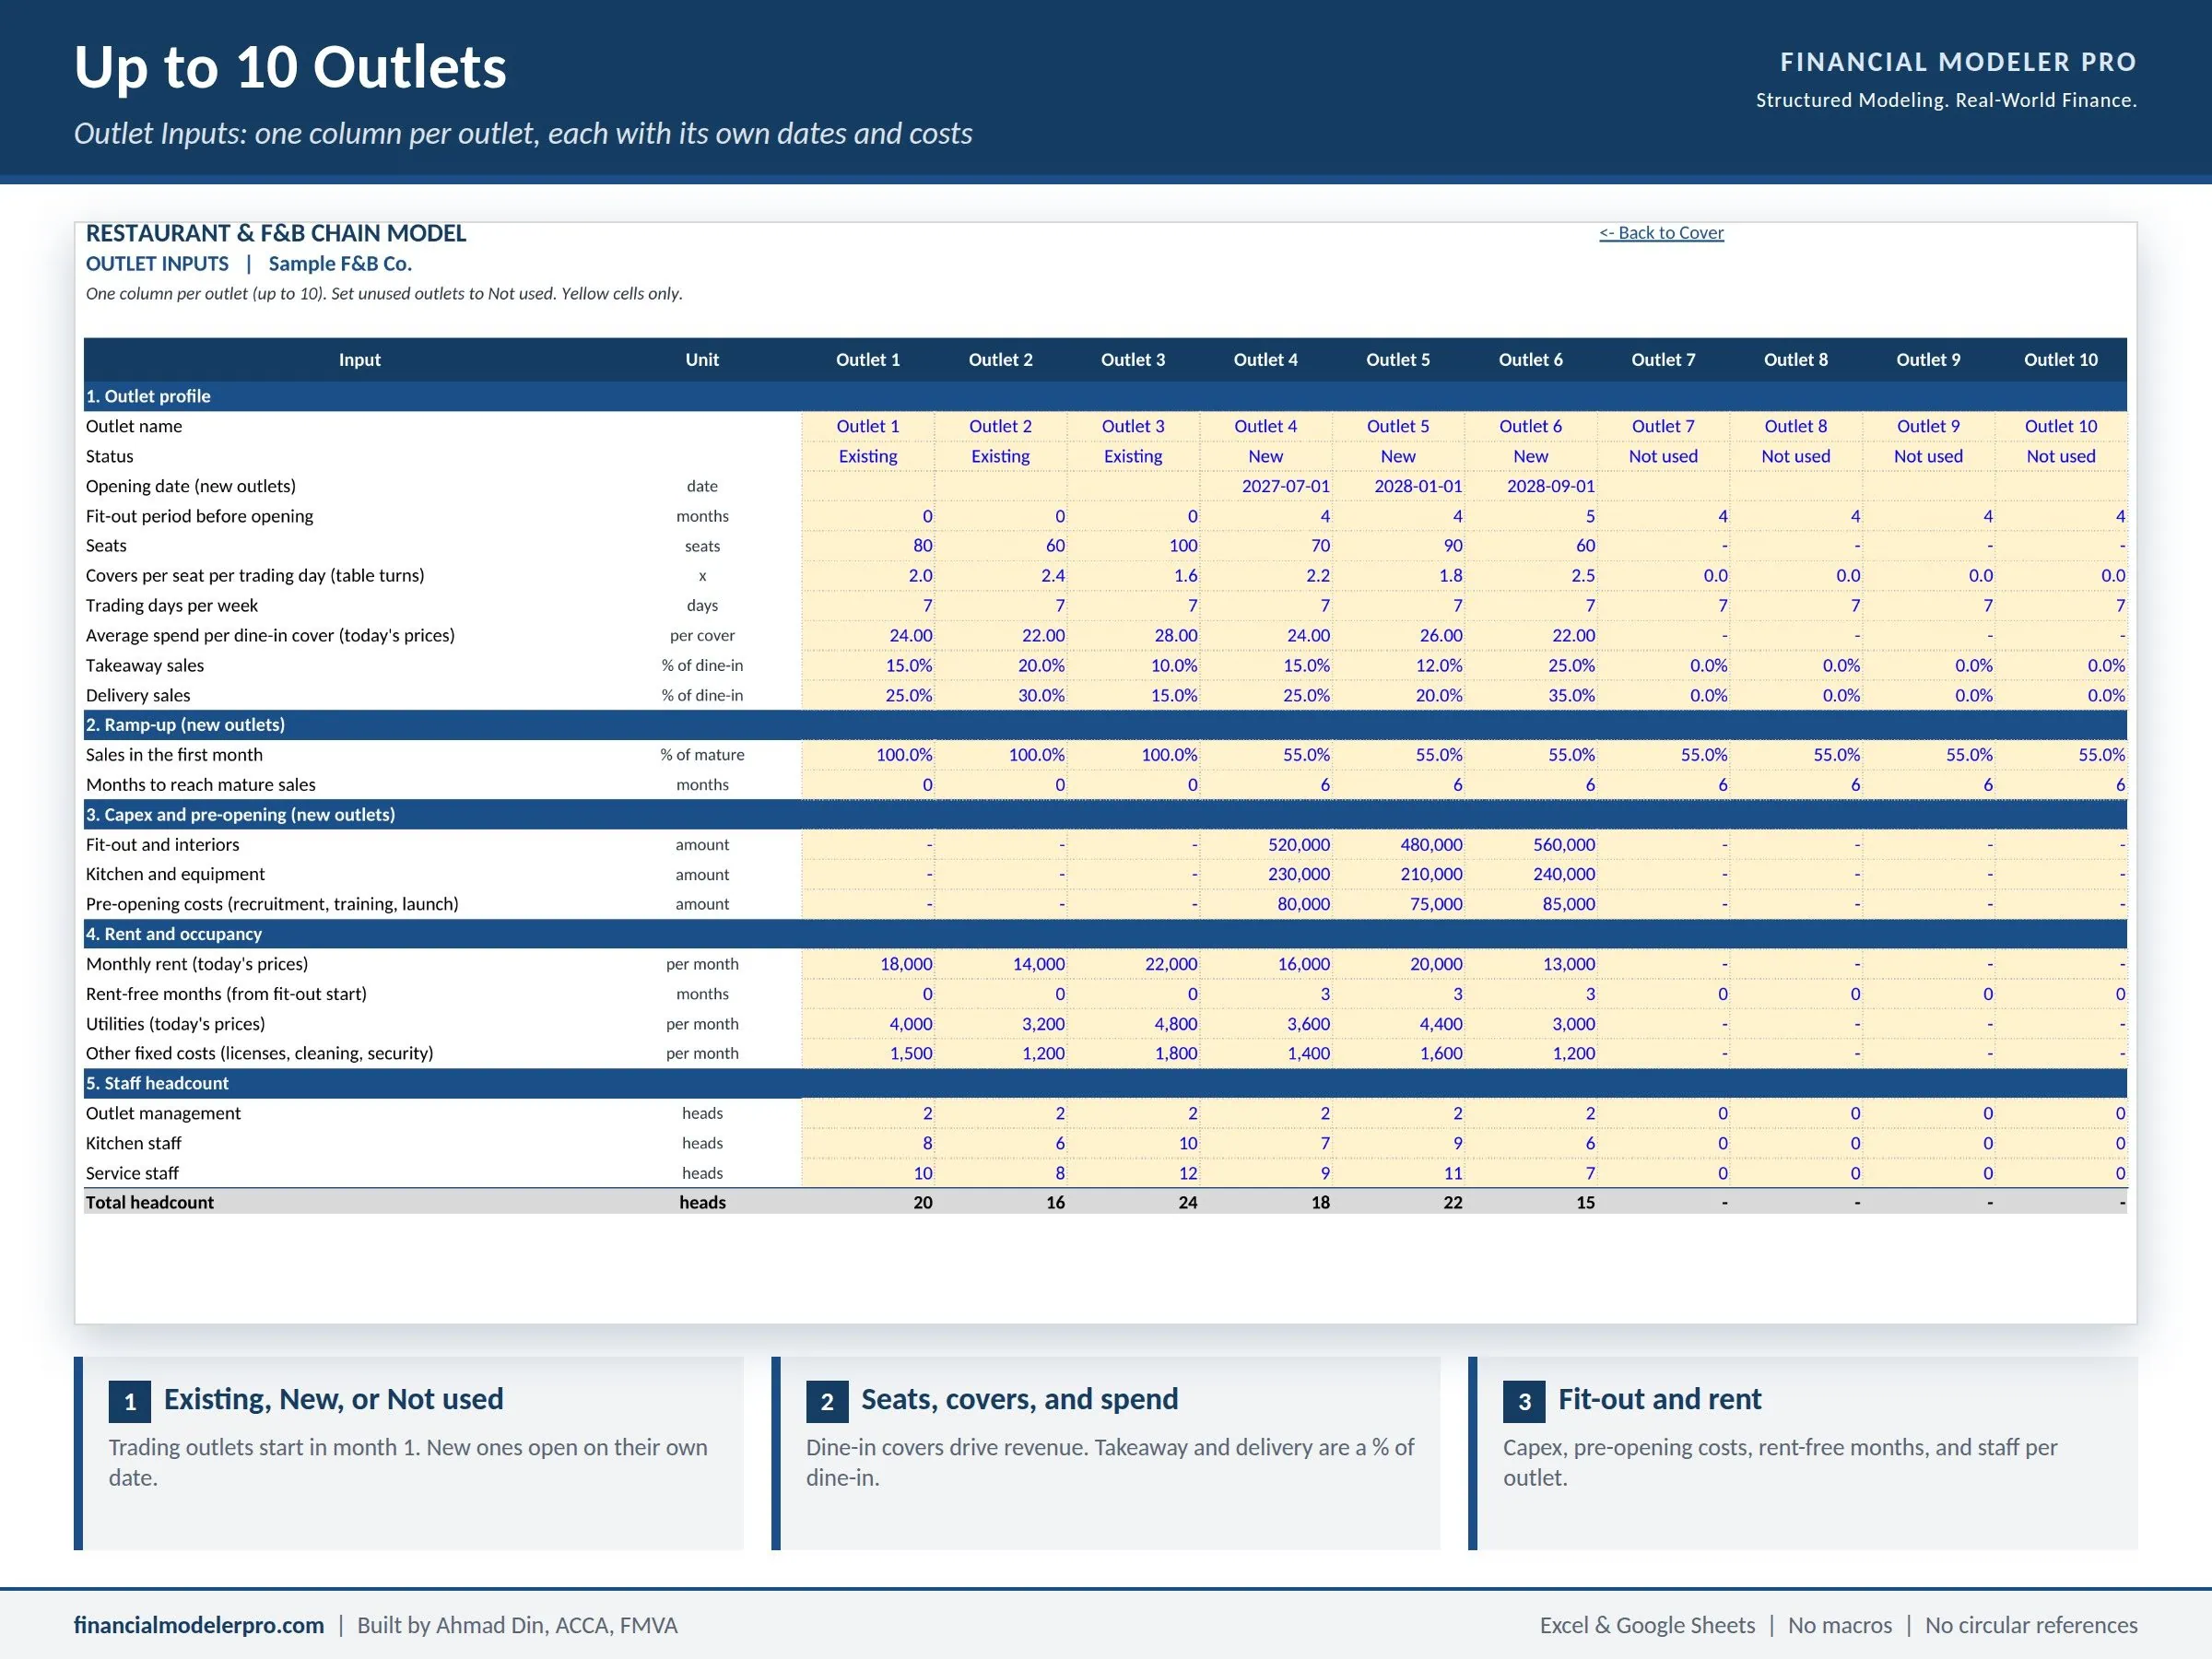
- Outlet Inputs: one column per outlet, up to 10
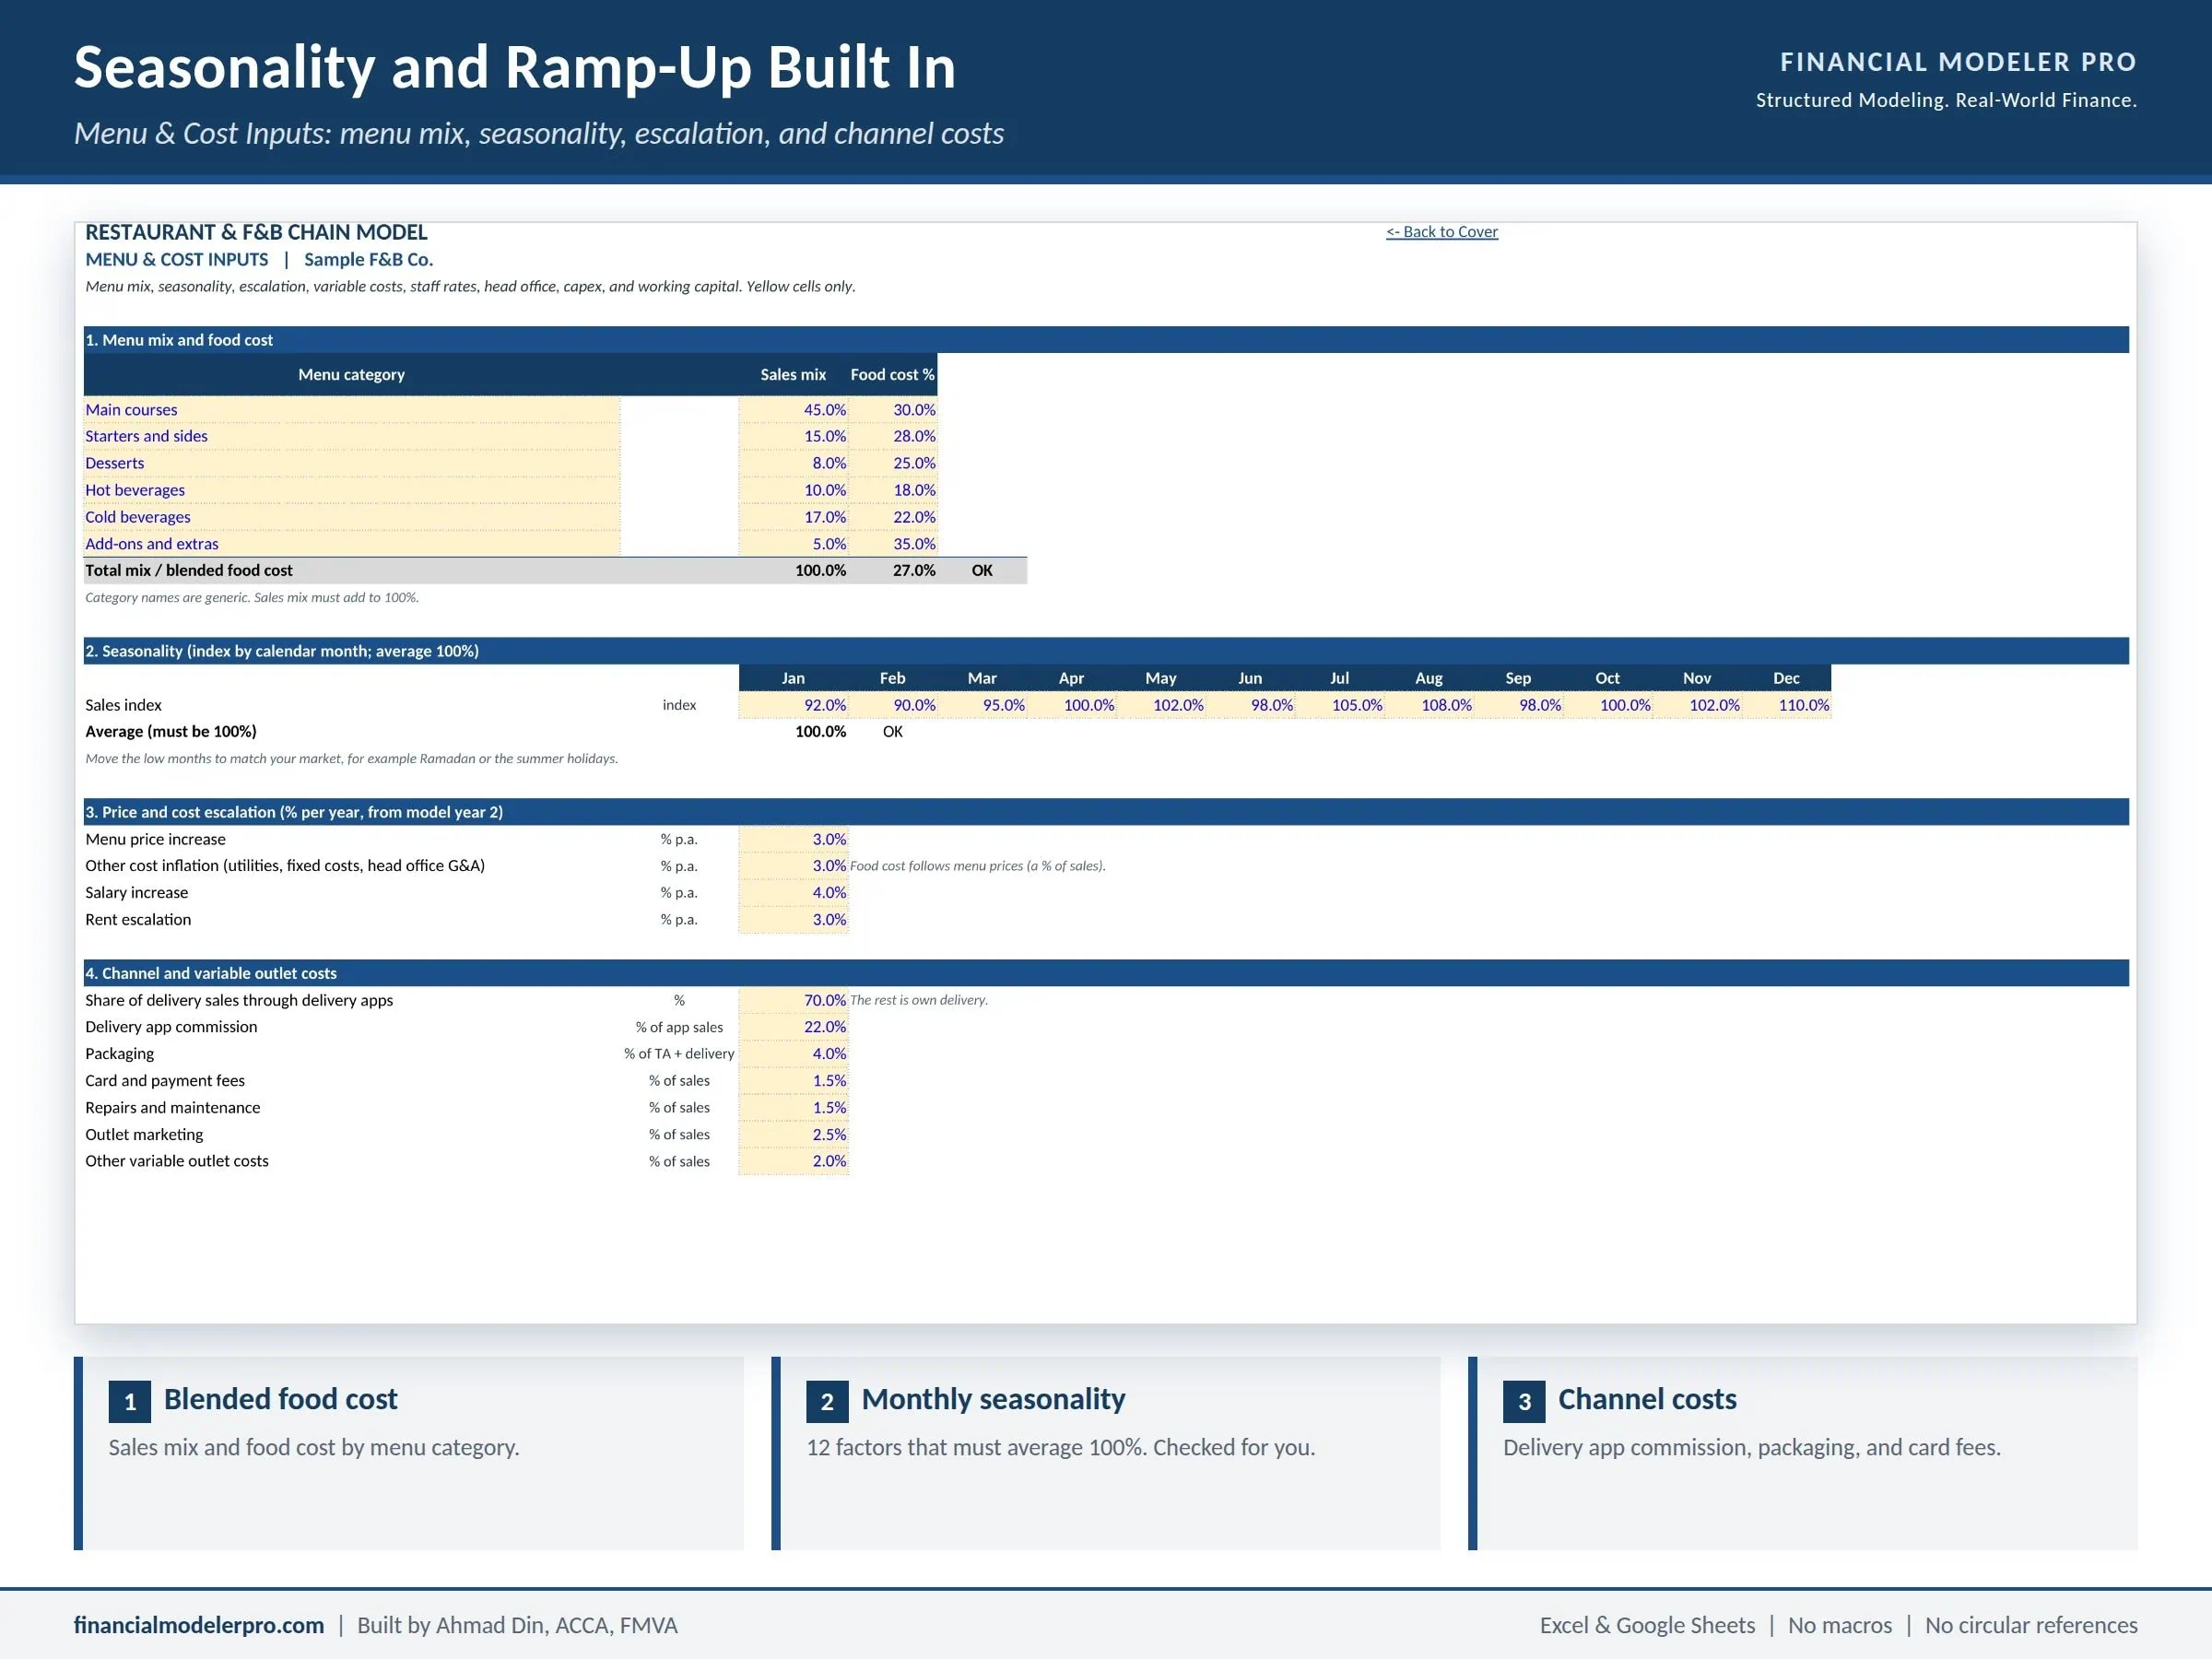
- Menu & Cost Inputs: menu mix, food cost, seasonality, delivery, staff pay, head office, and working capital
- Timeline, Outlets, Operations, Capex, Working Capital, Financing, and Tax & Equity schedules
- Financials (monthly) and Annual Financials: income statement, cash flow, balance sheet, and key ratios
- Outlet Summary, Valuation, Returns, Sensitivity, and Checks
Main features
- Up to 10 outlets, each set as Existing, New, or Not used, with its own opening date
- Dine-in sales built from seats, covers per seat per day, and trading days; takeaway and delivery added on top
- Delivery app share and commission, packaging, and card fees
- Seasonality by month and a ramp-up curve for new outlets
- Menu categories with sales mix and food cost % that give a blended food cost
- Fit-out and pre-opening costs spread over the months before opening, with rent-free months and headcount by outlet
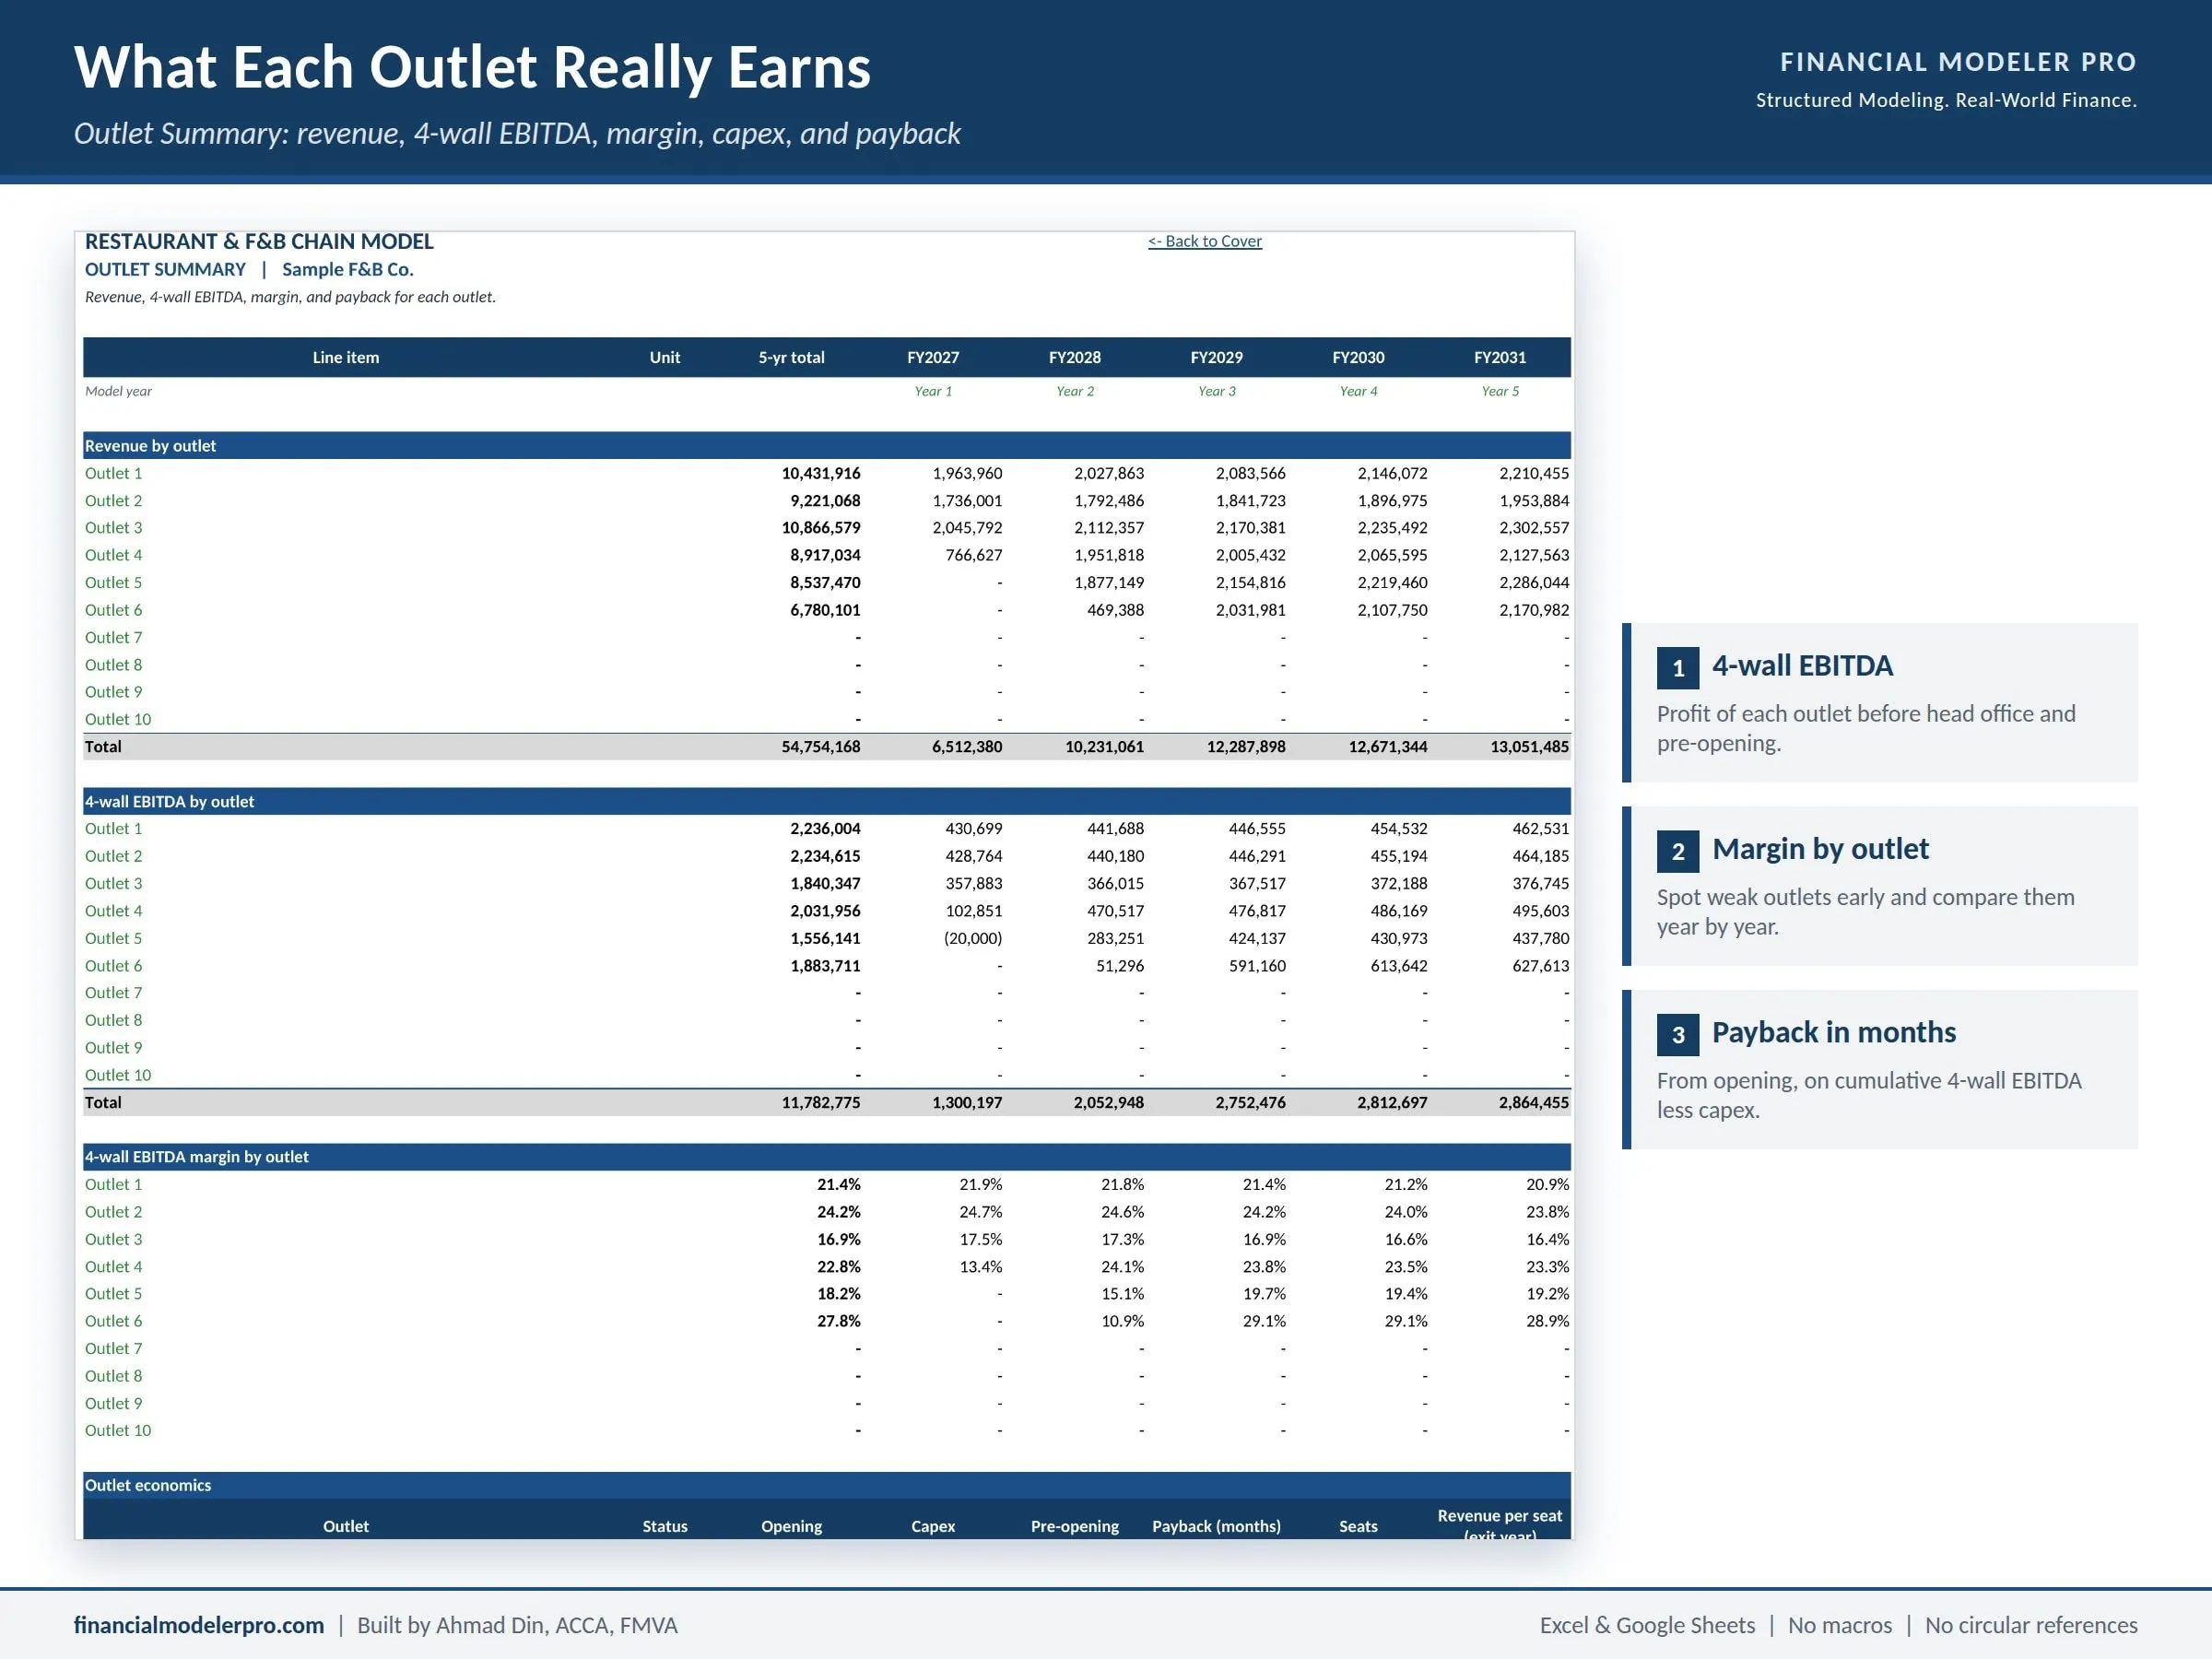
- 4-wall EBITDA, margin, capex, and payback for every outlet, on one summary tab
- New business or existing business: an existing chain starts from its last actual balance sheet
- Term loan with grace and repayment, up to two equity injections, minimum cash, an automatic working capital facility, dividends, and DSCR
- DCF and EV / EBITDA comparables, blended into one equity value
- Project IRR and equity IRR on both dividend and FCFE bases, with multiple and payback, to an exit year you choose (1 to 5)
- Base, Downside, and Upside scenarios switched from one cell, plus live sensitivity grids with no data tables
- Corporate tax or Zakat, and integrity checks that must read ALL OK
How to work with the template
- Save a copy and read the Instructions tab. Set the business type on Company Inputs: New business or Existing business.
- Fill one column per outlet on Outlet Inputs, then the menu, costs, and seasonality on Menu & Cost Inputs. You type in yellow cells only.
- Confirm the Checks tab reads ALL OK. It also warns if the working capital facility is drawn for too long, which means the plan needs more equity.
- Read the Outlet Summary first, then the Dashboard, Annual Financials, and Returns.
The Instructions tab lists typical ranges to compare against: food cost 25% to 35%, staff 25% to 35%, rent 8% to 15%, and 4-wall EBITDA 15% to 25% of revenue. All formulas are visible and no cell is locked.
Why you need this model
A chain can look healthy in total while one or two sites quietly lose money. This model keeps every outlet visible, so you can see which sites pay back, which ones drag, and how many new openings your cash can carry. Because it runs monthly, it also shows the cash dip during fit-out and ramp-up, which is where most new restaurant plans go wrong.
Technical notes
- 60 monthly periods, with annual summaries
- Excel 2010 or later and Google Sheets
- No macros, no circular references, no external links, no merged cells
- Rent is expensed as paid; lease accounting under IFRS 16 is not included
- Sample data is illustrative; replace it with your own
Licences
- Free PDF Preview: shows the layout and outputs before you buy
- Excel Model, Business Licence: for use inside your own company
- Excel Model, Consulting Licence: for use on client engagements
About the author
Built by Ahmad Din, ACCA, FMVA, AFM, a corporate finance and transaction advisory practitioner with 12+ years of experience across Saudi Arabia, the GCC, and Pakistan, and the founder of Financial Modeler Pro. Custom versions of this model are available on request through eFinancialModels.
Similar ProductsOther customers were also interested in...



 eFinancialModels
Electric Vehicle (EV) Charging Station Financial M...
With this comprehensive 5- or 10-year monthly tool, investors can assess the viability of setting up... Read more

Financial Model for Mobile App | Mobile App Busine...
The Mobile App Financial Plan Template in Excel allows you to develop financial projections when lau... Read more

 HenrySheykin
Food Truck Financial Model Excel Template
The Food Truck Financial Model helps entrepreneurs, founders, business owners, consultants, and anal... Read more

Green Hydrogen Production from Wind Energy Financi...
The Green Hydrogen from Wind Financial Model aims to comprehensively forecast a horizon of 40 years ... Read more

Simple Mutual Non-Disclosure Agreement Template
Protect your business secrets with ease using our Simple Mutual Non-Disclosure Agreement Template. S... Read more

Solar Energy Financial Model
The Solar Energy Financial Model Spreadsheet Template in Excel assists you in preparing a sophistica... Read more
 Peter Graf
The Customer-Centric Financial Model for Restauran...
Starting a restaurant without a financial plan is like driving a car blindfolded. You wouldn´t do i... Read more
You must log in to submit a review.