
0 ITEMS

Rental Property Spreadsheet Template
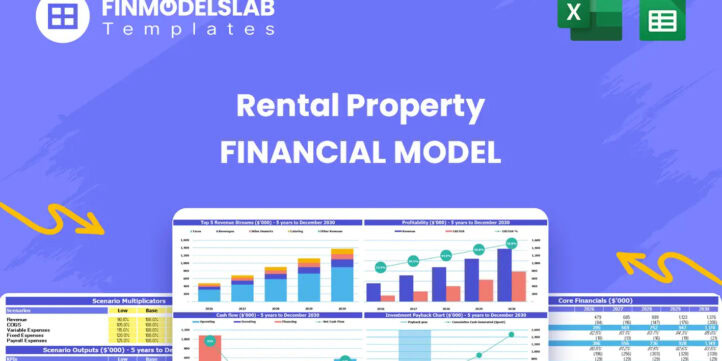
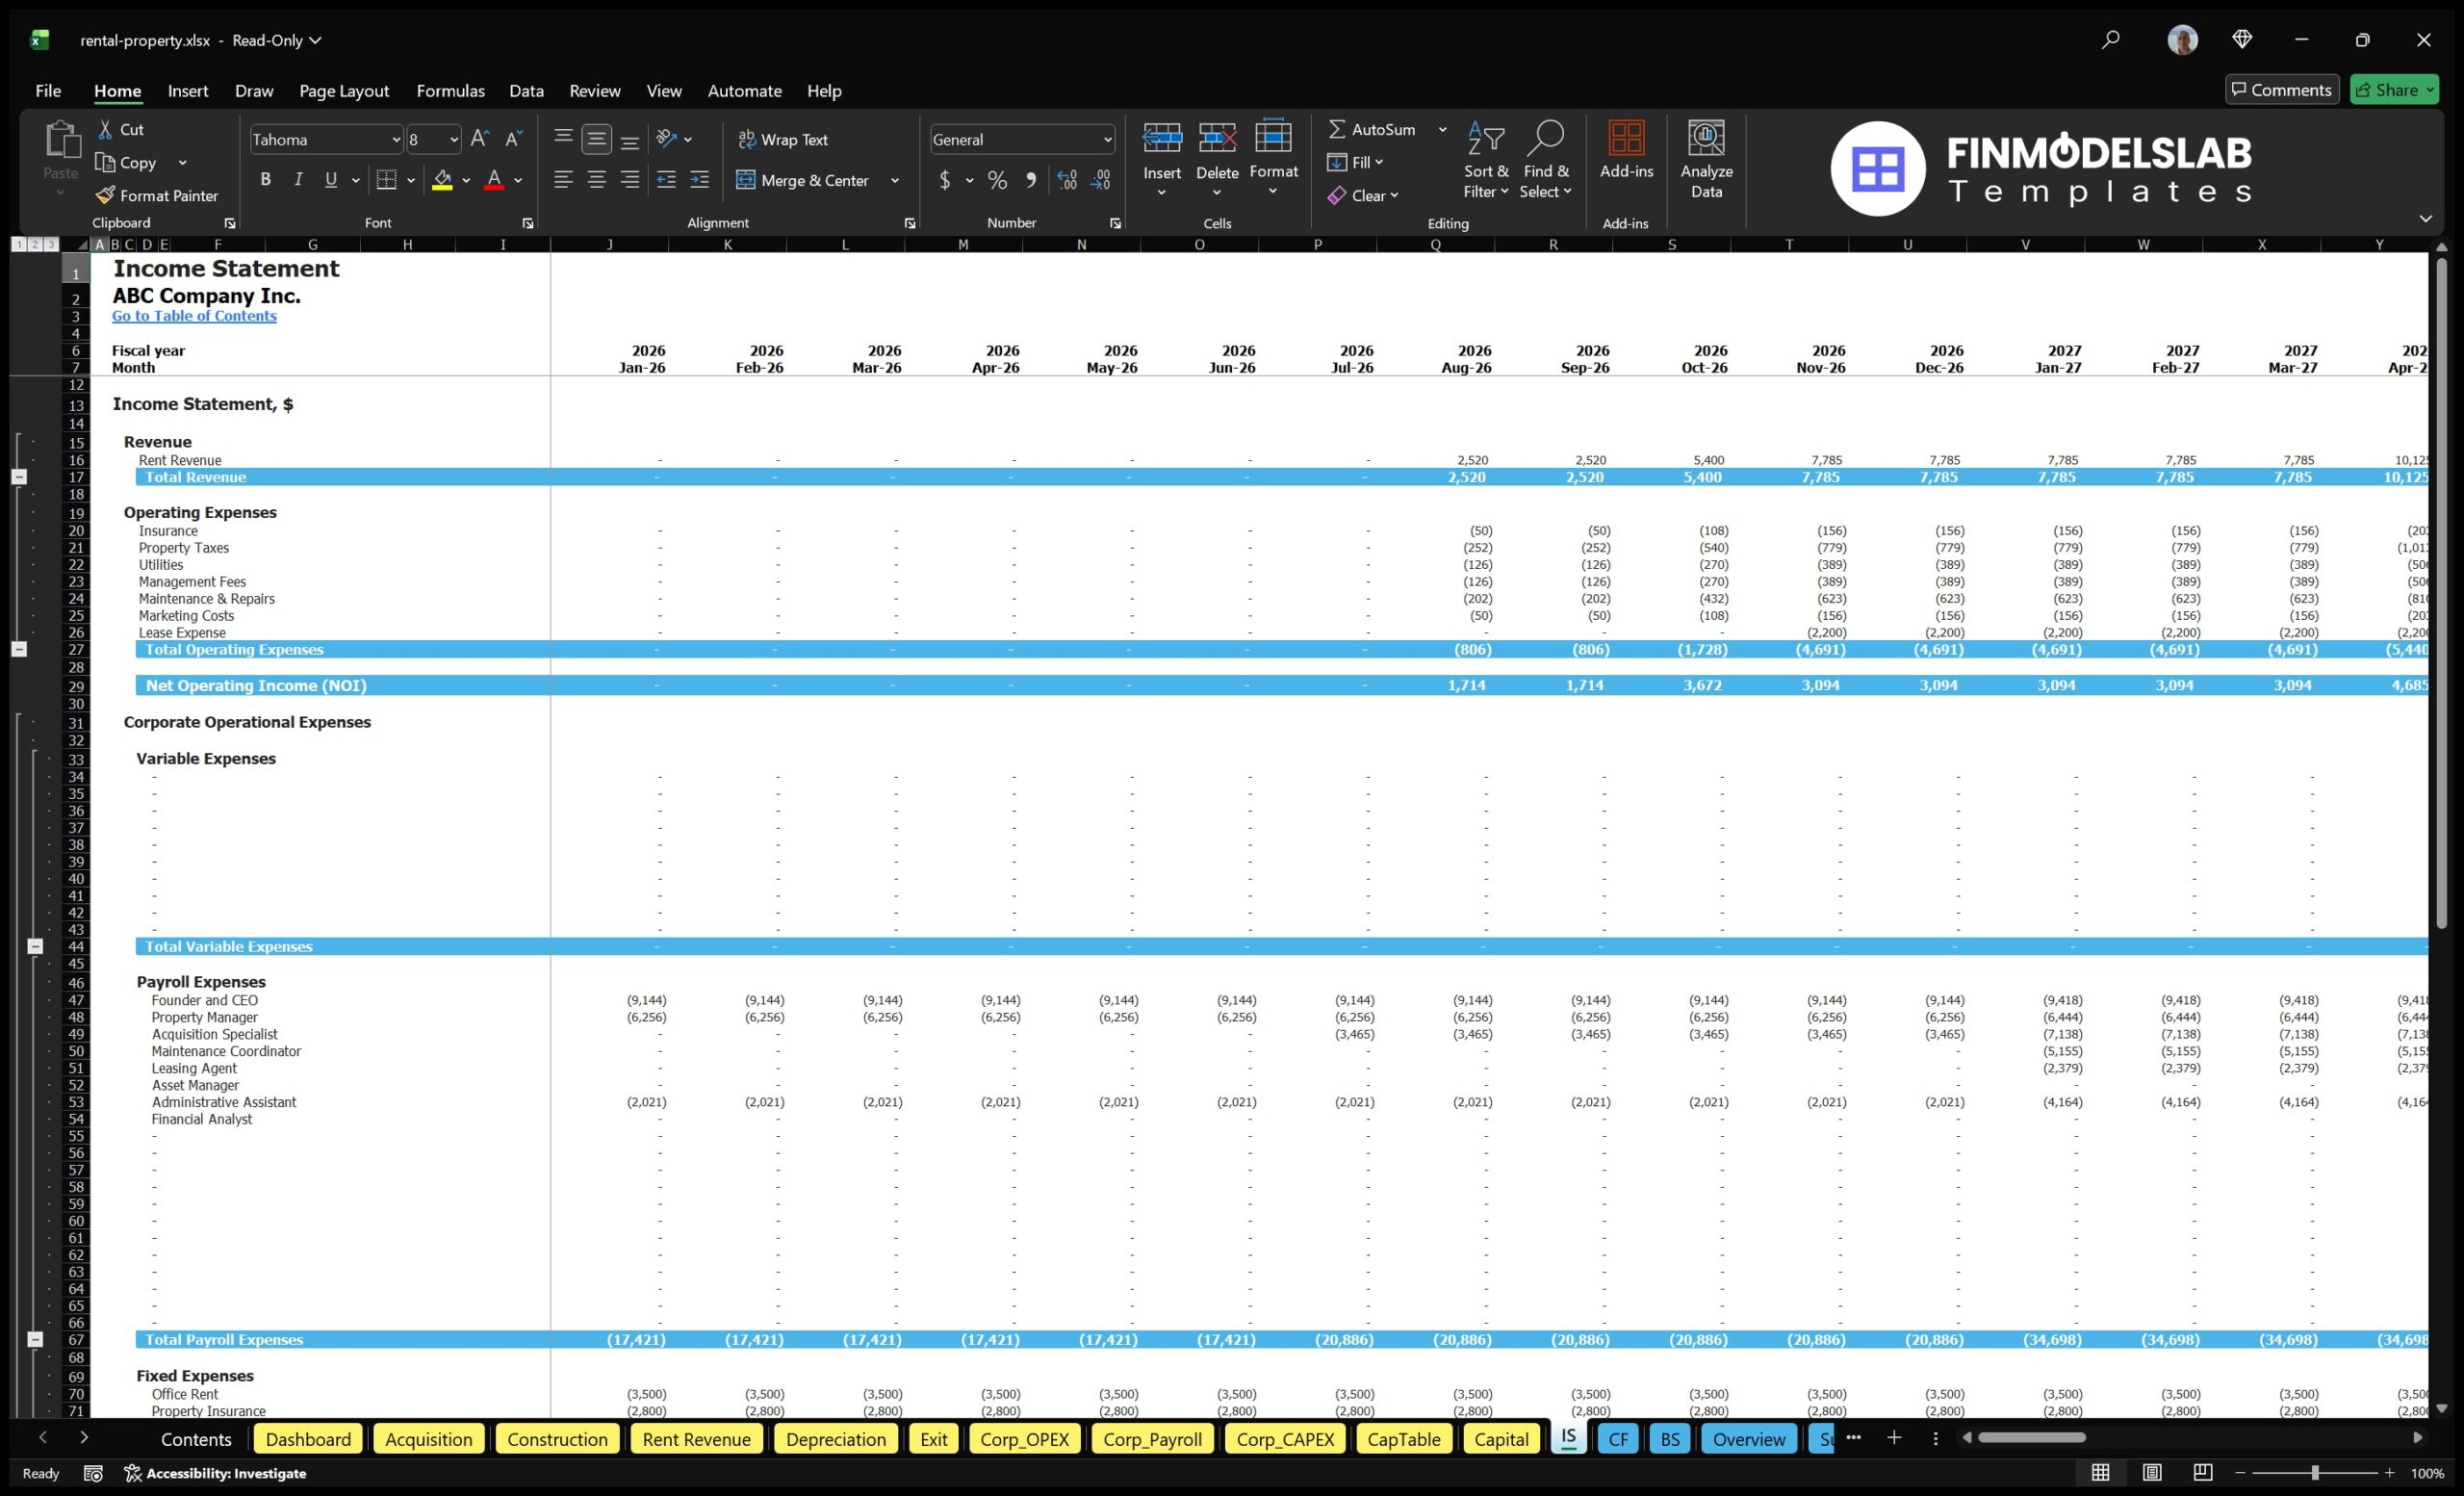
This Rental Property Financial Model Financial Model Template helps investors, founders, property owners, consultants, and business planners evaluate the financial performance of a rental property portfolio before committing capital. It provides a structured way to estimate acquisition costs, renovation budgets, rental income, operating expenses, financing needs, cash flow, profitability, and investor returns across a multi-year forecast. Instead of building a real estate pro forma from scratch, users can work from a ready-to-use model designed around the realities of acquiring, improving, leasing, managing, and eventually selling rental properties. The template is built for financial planning, funding preparation, lender discussions, investor presentations, and internal decision-making. Users can adjust revenue assumptions such as monthly rent, occupancy, lease-up timing, ancillary income, one-time fees, and exit proceeds, then see how those assumptions affect the overall forecast. It also helps organize startup costs, capital expenditures, property-level costs, payroll, administrative overhead, debt service, and ongoing operating expenses so the full cash requirement is visible from the beginning. This is especially useful for rental property projects where early cash outflows can be significant before rental income stabilizes. The model supports a practical view of profitability by connecting assumptions to financial outputs such as revenue forecasts, profit and loss summaries, cash flow projections, return metrics, and break-even analysis. Users can review how long it may take for cumulative revenue to cover cumulative costs, whether cash reserves are sufficient, and how changes in rent growth, vacancy, renovation timing, or financing terms may influence performance. The structure is suitable for both startup rental property ventures and established operators planning acquisitions, refinancing, portfolio expansion, or investor reporting. Designed to be editable and presentation-ready, the Rental Property Financial Model can be customized in Microsoft Excel or Google Sheets to match a specific deal, location, financing structure, or investment strategy. It helps users replace guesswork with organized assumptions, clear outputs, and professional financial reports. Whether preparing a business plan, evaluating a potential acquisition, comparing scenarios, or presenting to lenders and partners, the template gives decision-makers a clearer view of capital needs, risk, return potential, cash flow pressure, and the path toward sustainable profitability.
Financial Model Overview
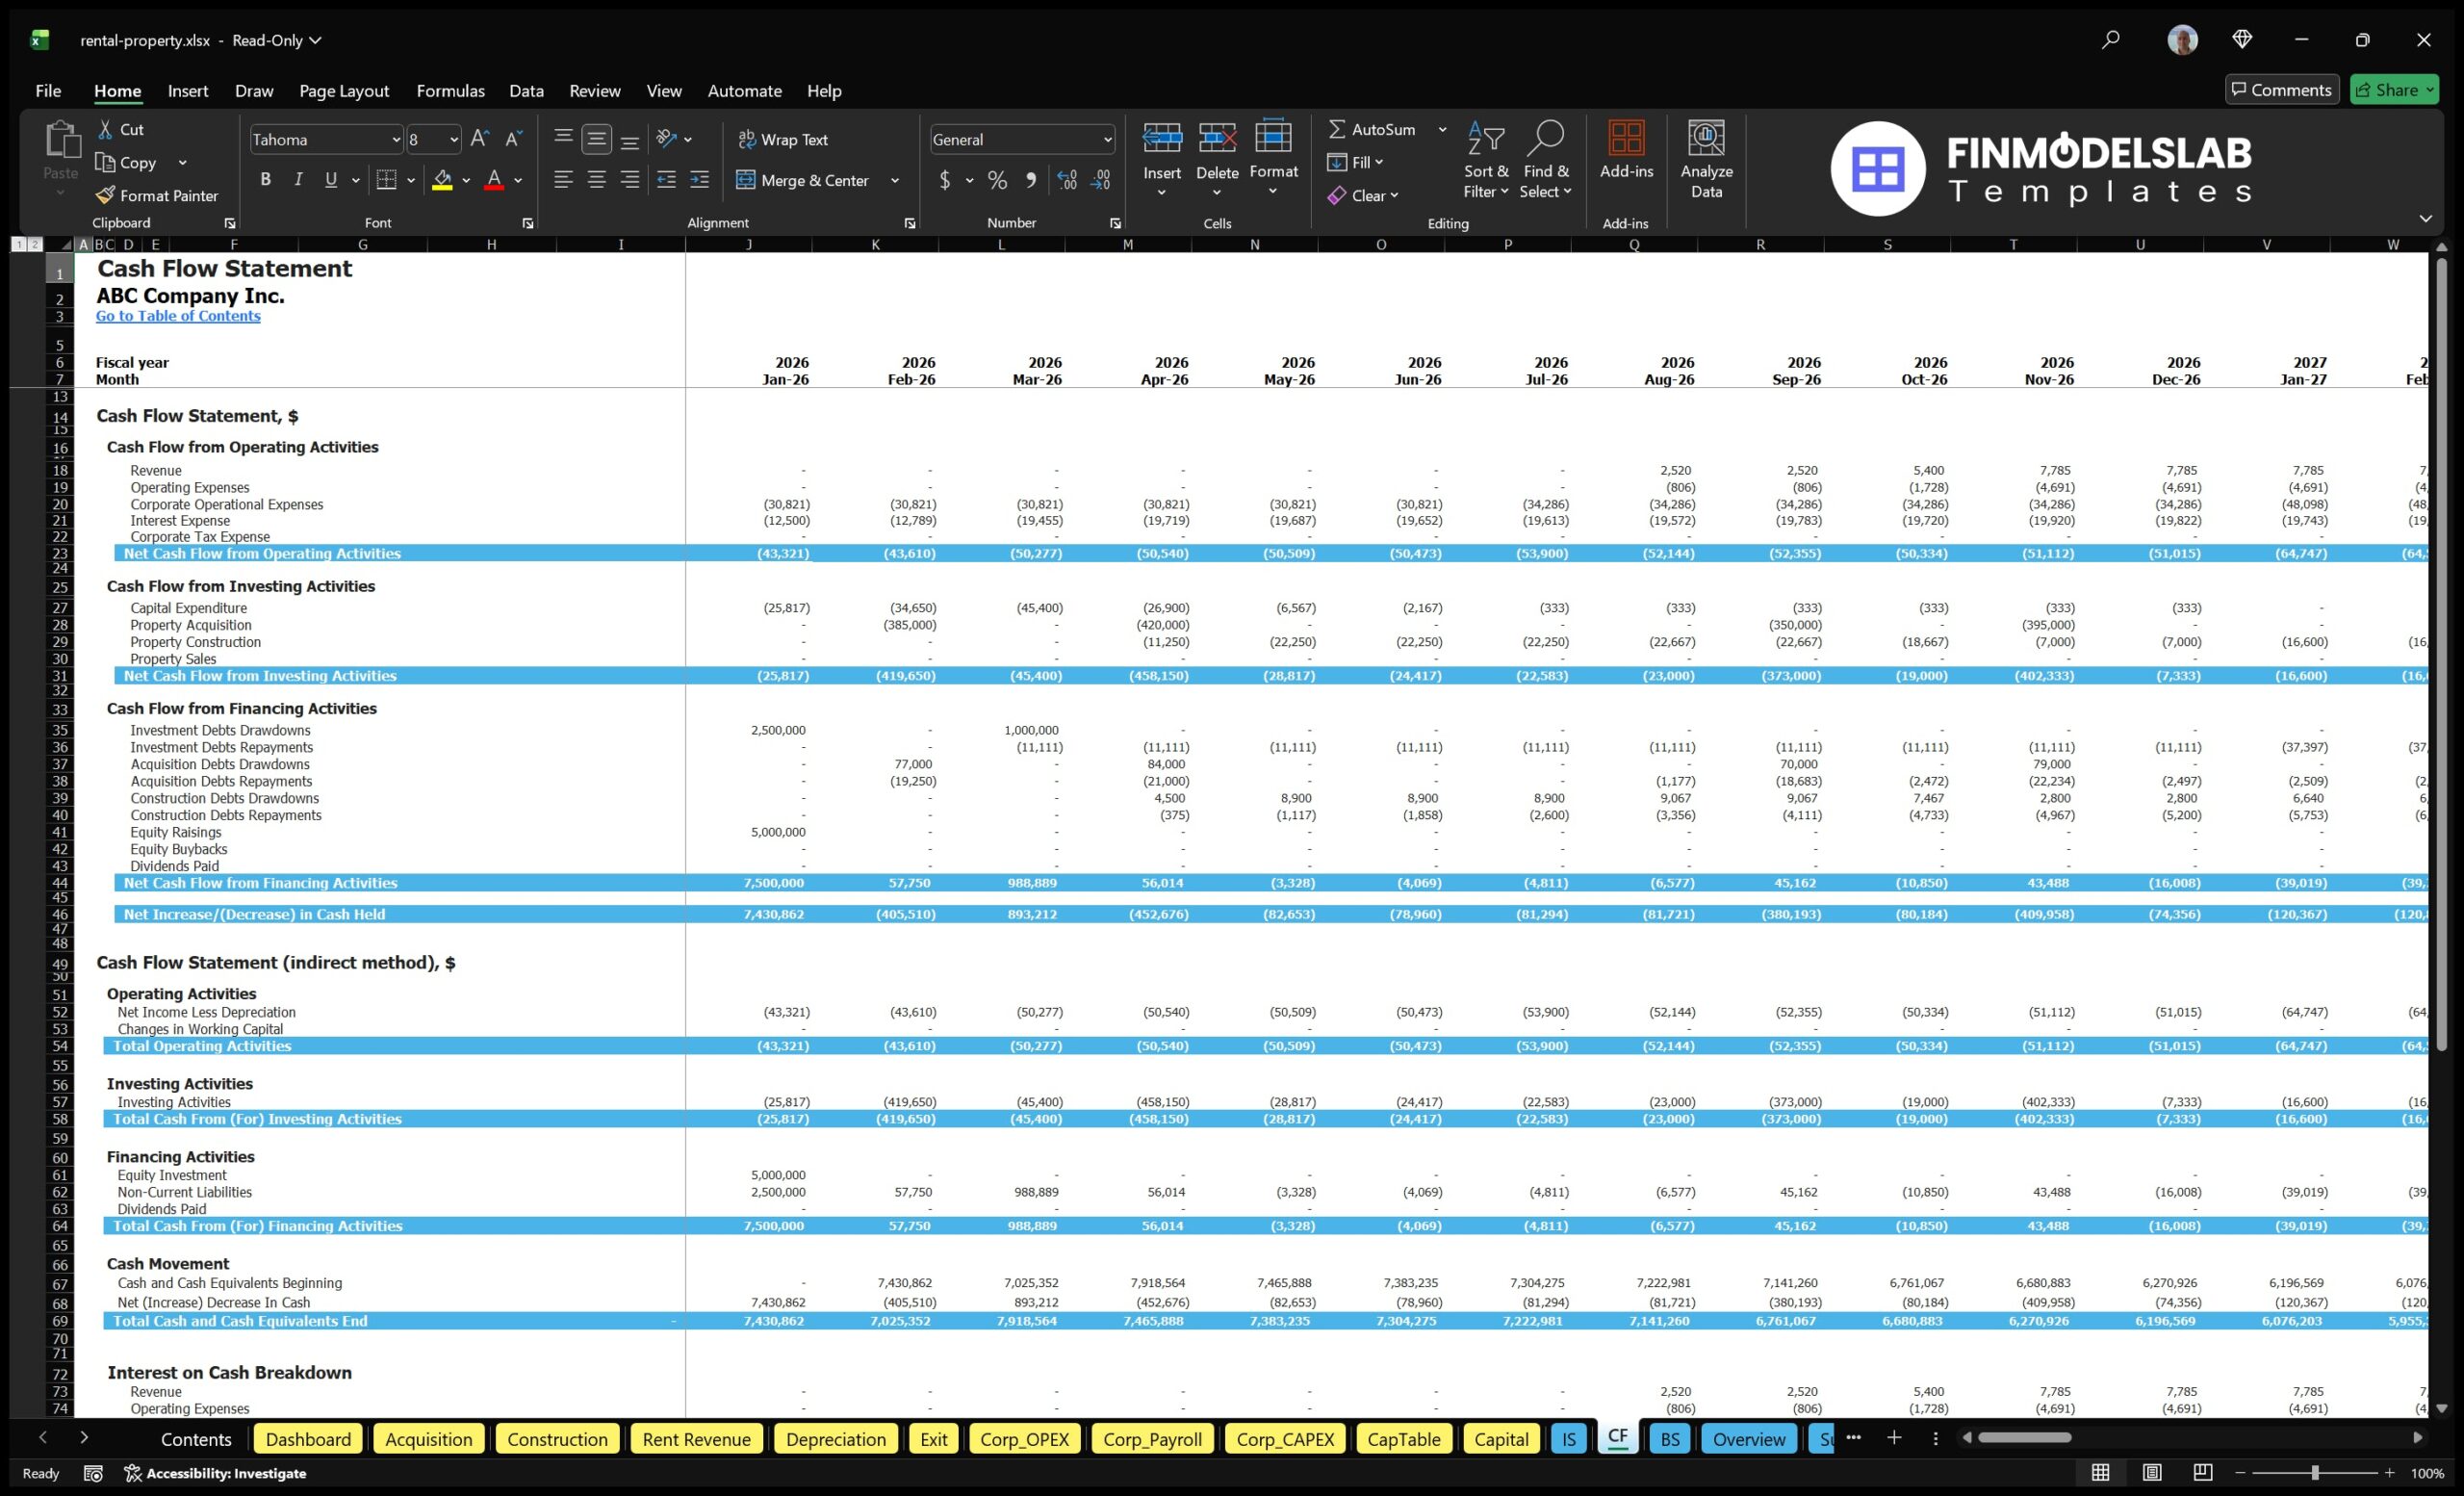
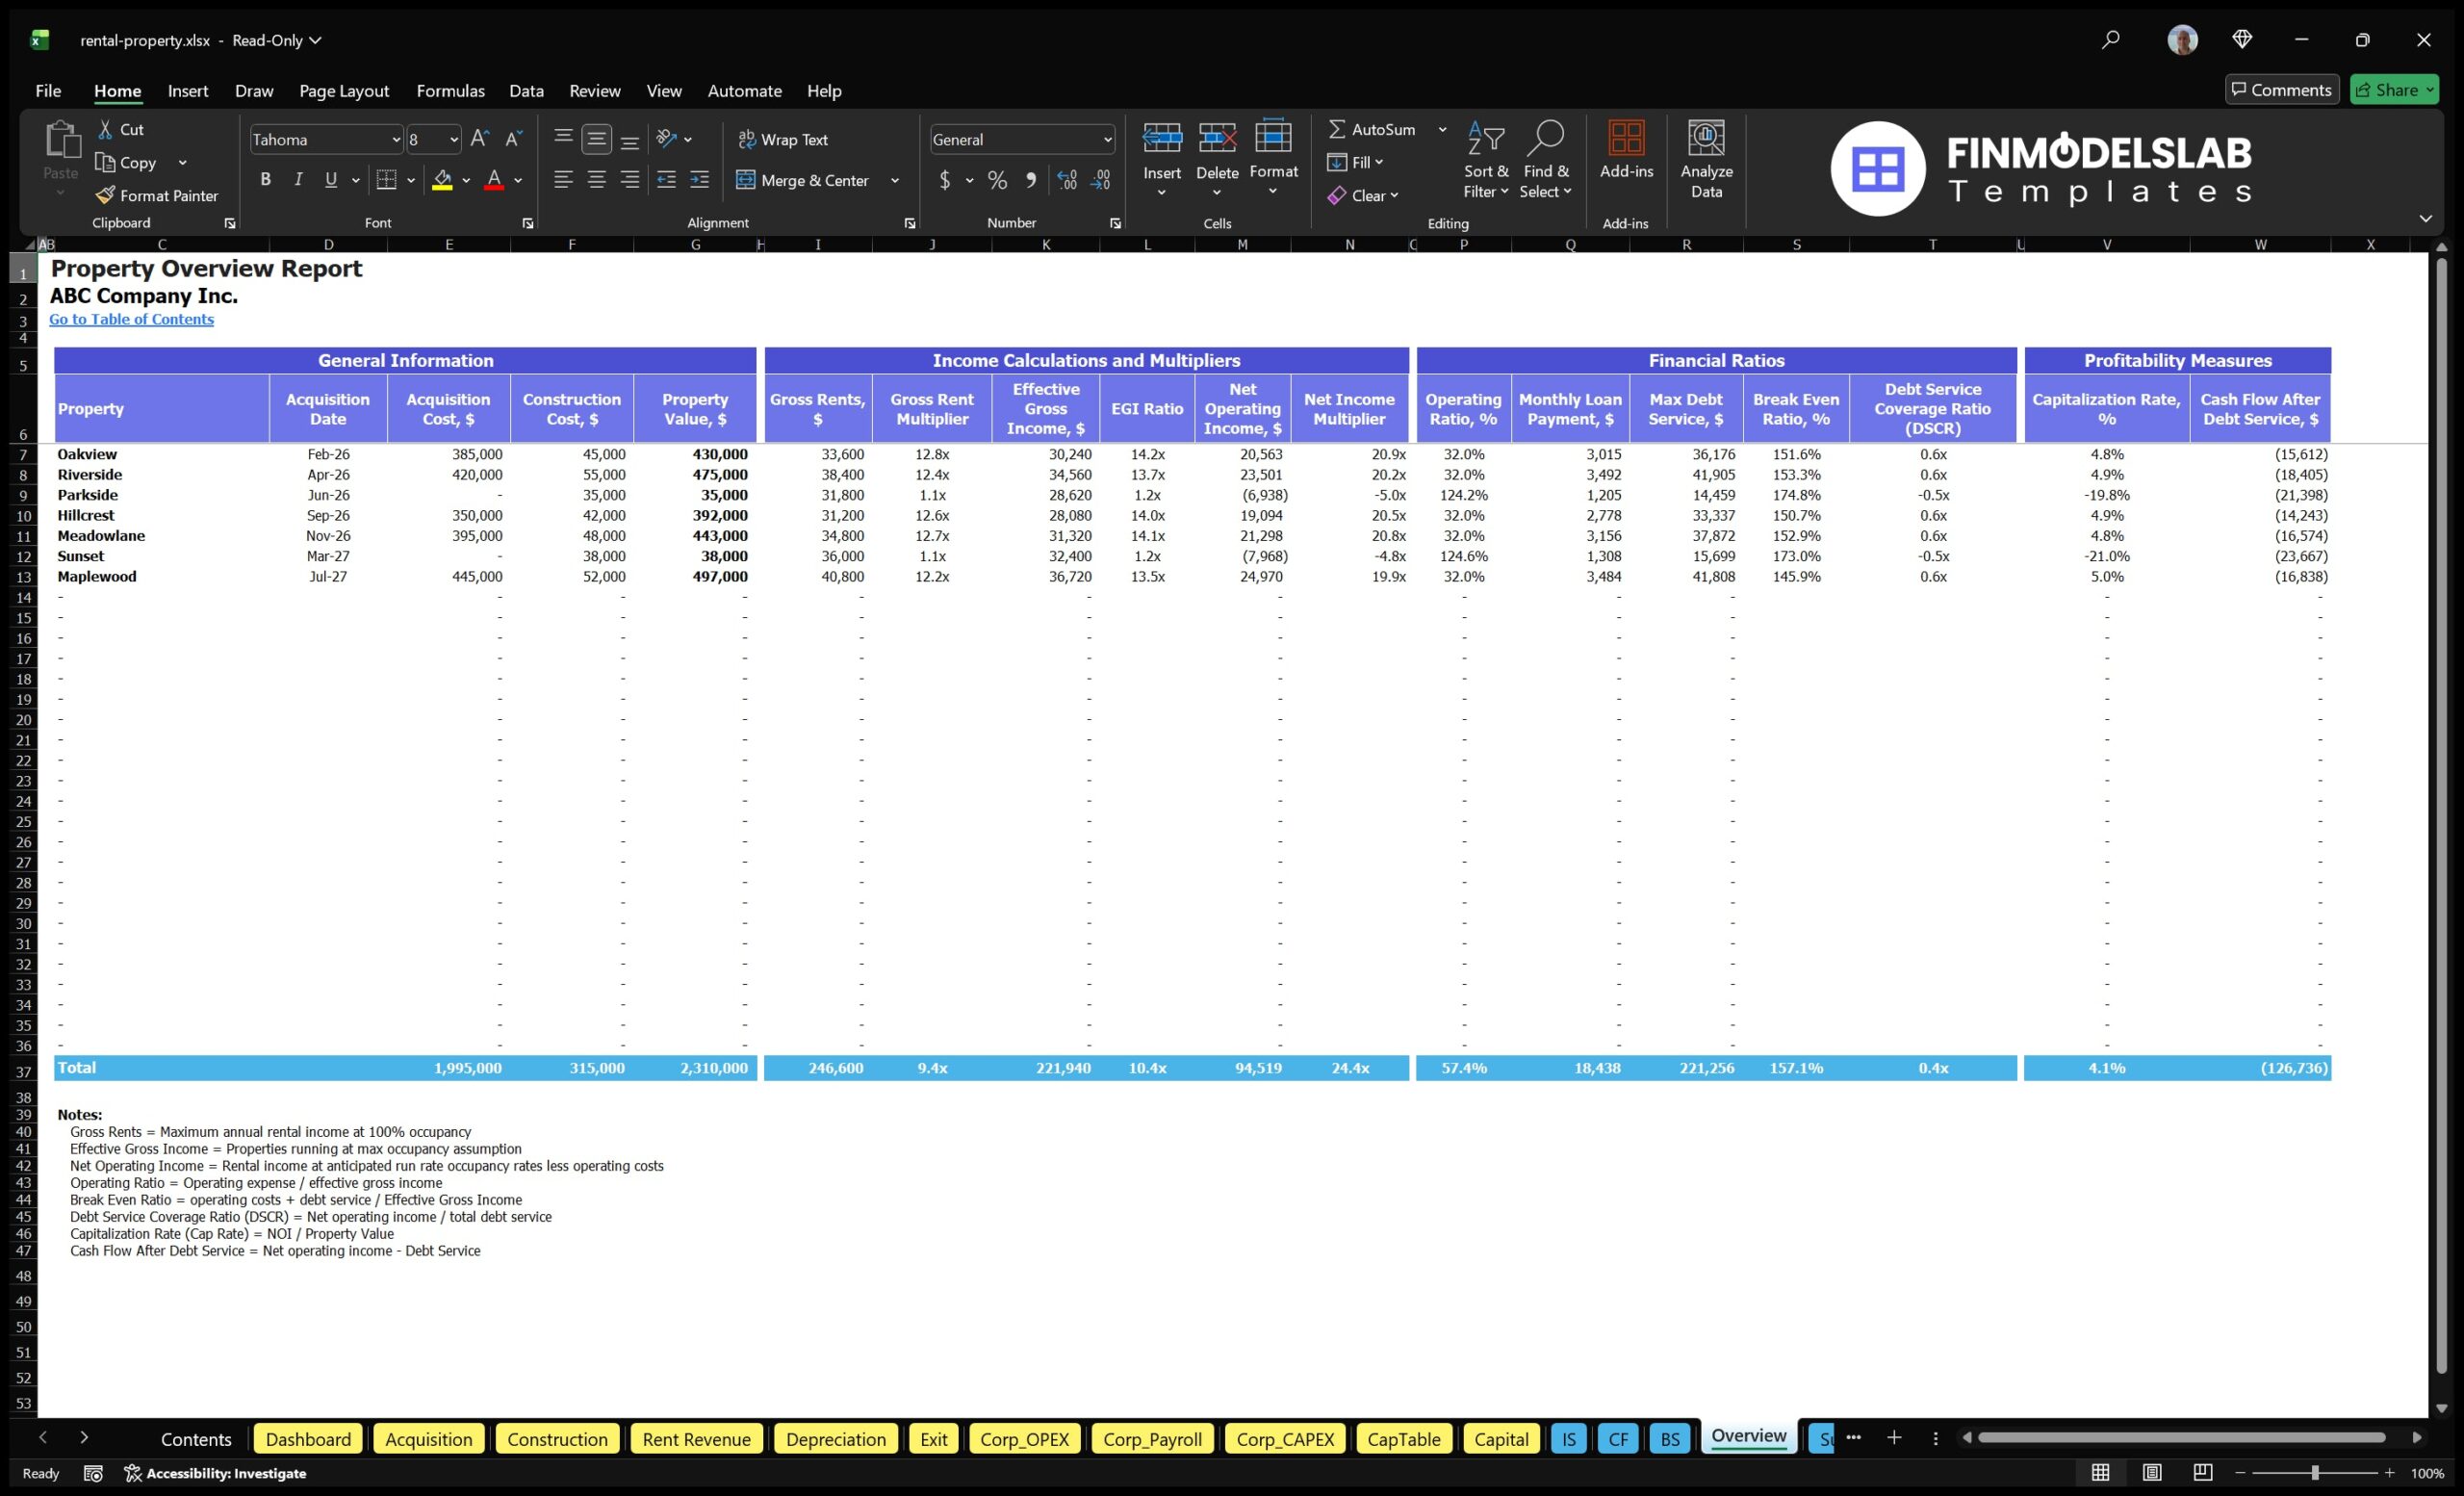
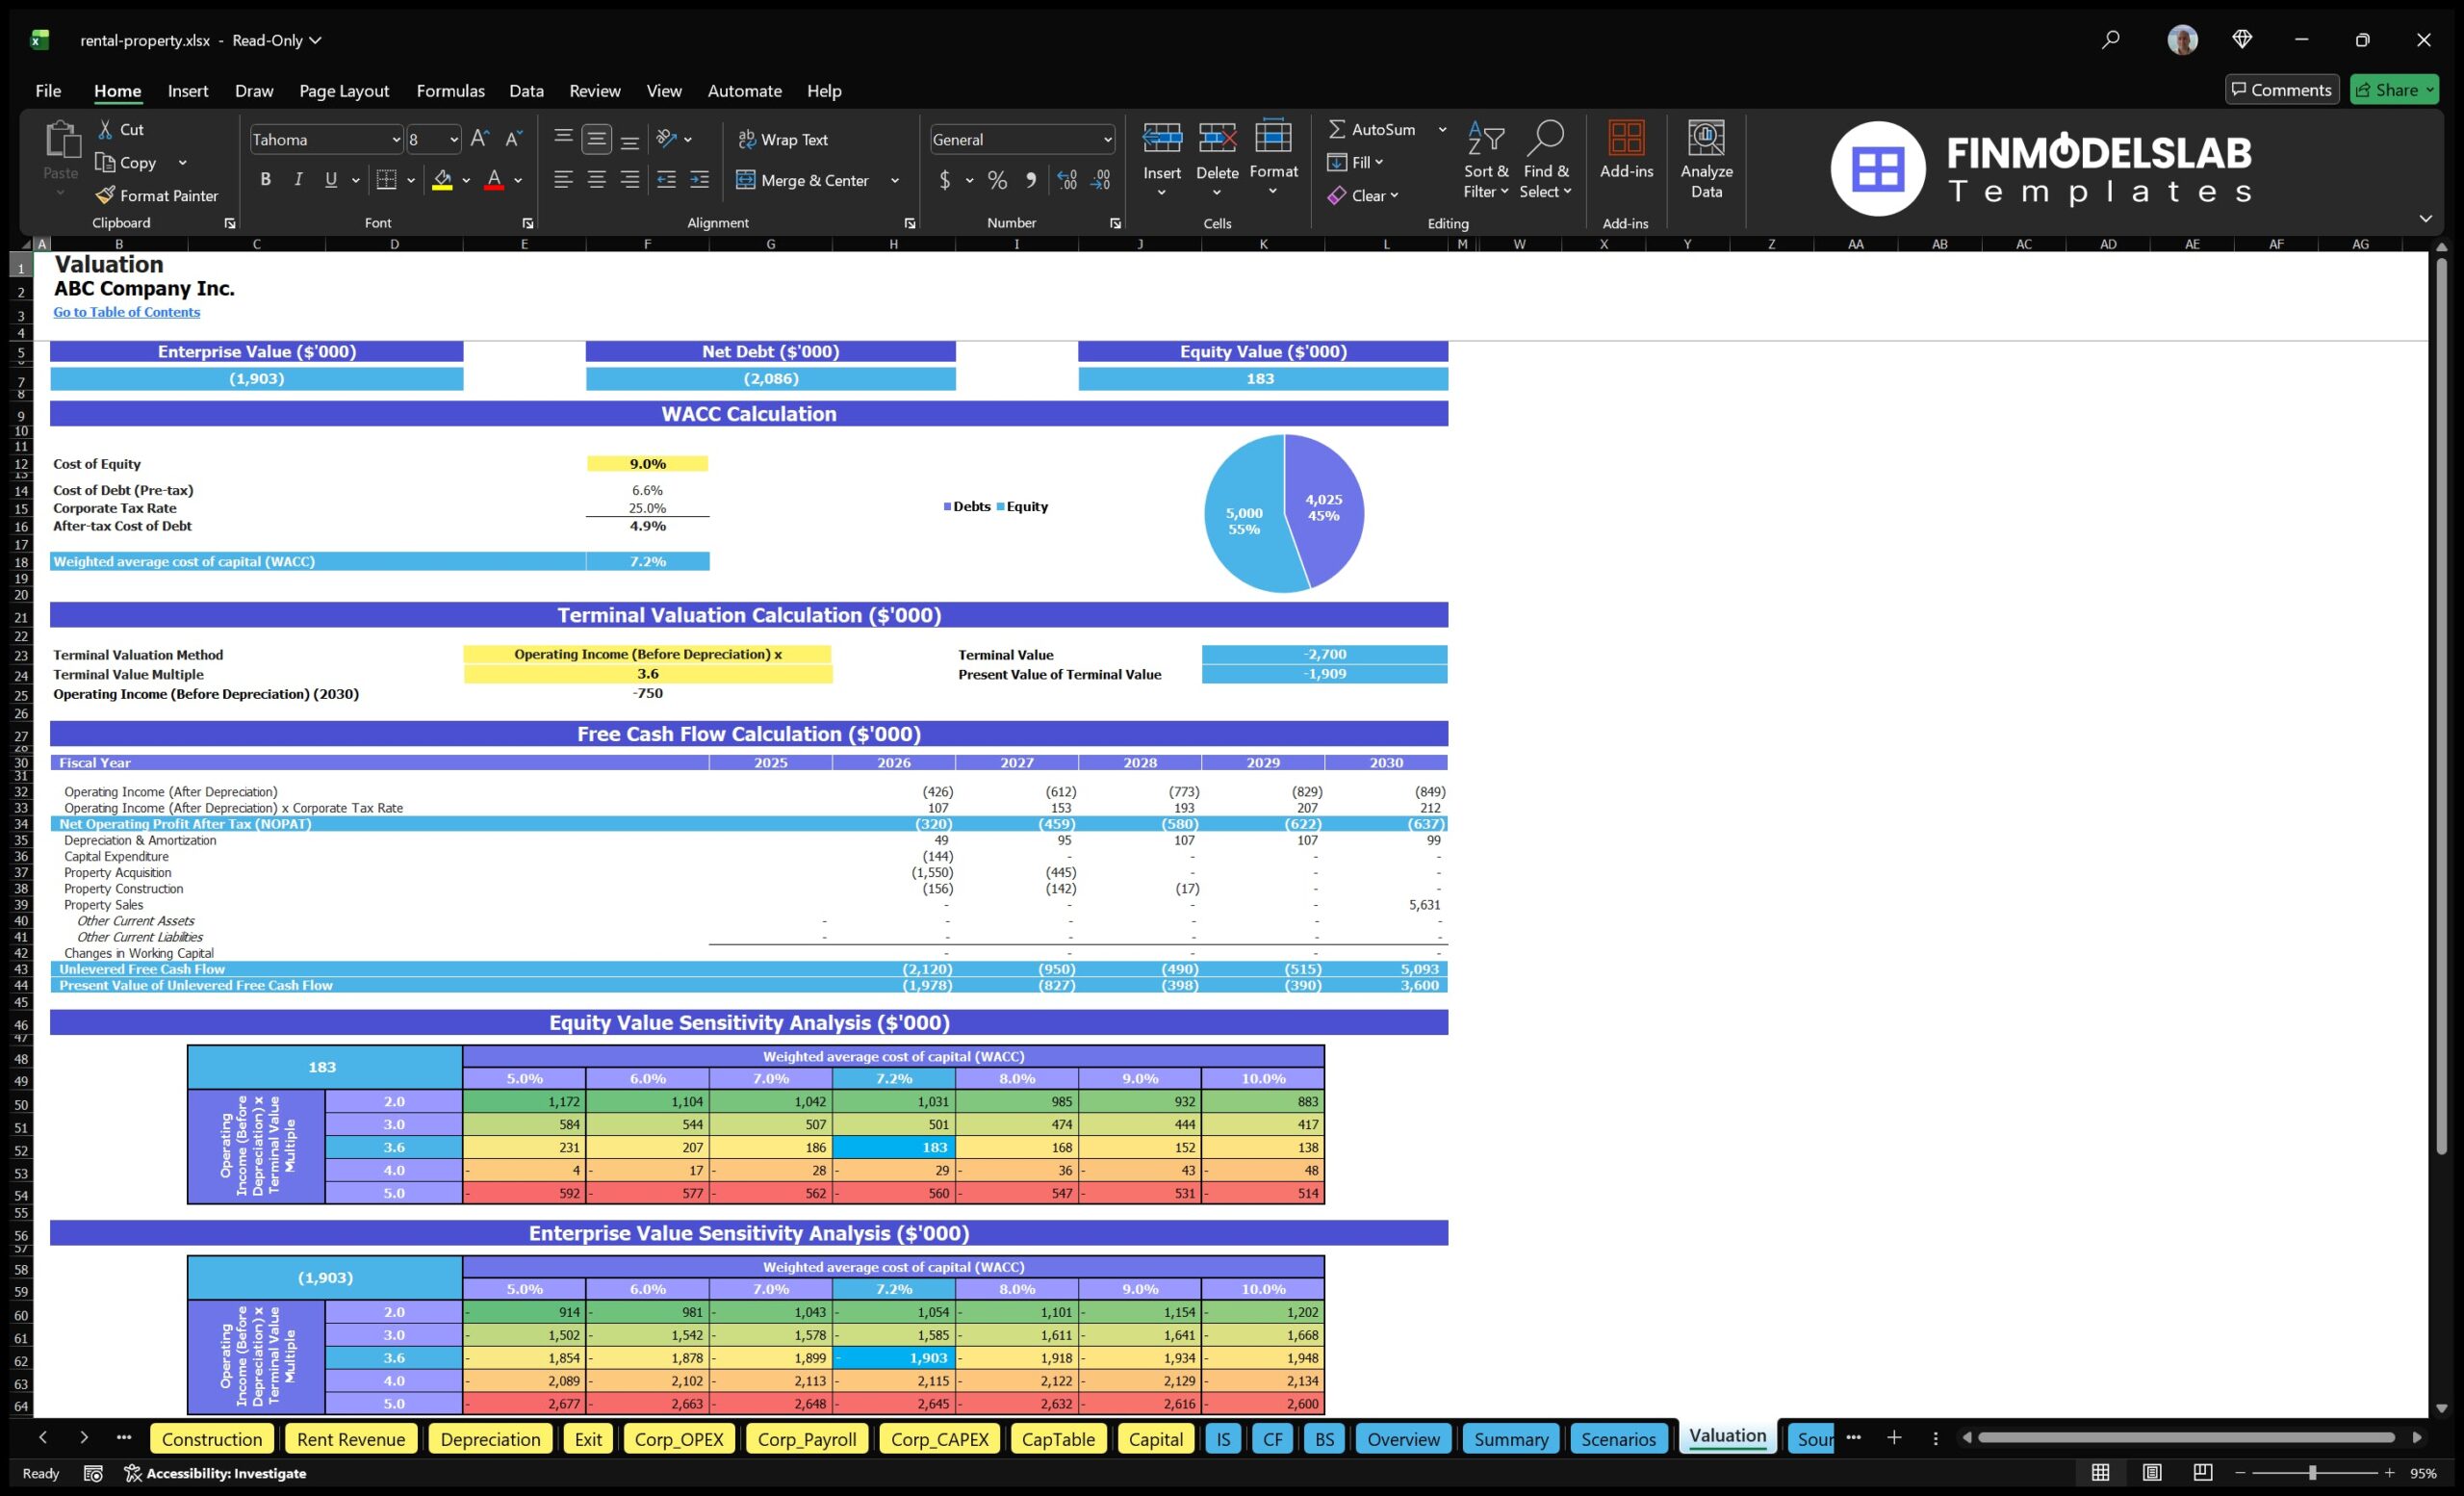
The Rental Property Financial Model Financial Model Template is a ready-to-use planning tool for evaluating the economics of acquiring, renovating, leasing, managing, and selling rental properties. It is designed for real estate entrepreneurs, investors, property owners, analysts, consultants, and founders preparing business plans, loan packages, investor materials, or internal acquisition reviews. The model brings together the major drivers of a rental property business, including purchase prices, renovation costs, rental assumptions, occupancy, operating expenses, payroll, debt service, cash reserves, and exit value. Because rental property investments often require significant upfront capital before rental income fully ramps up, the template helps users understand not only projected profitability but also the timing of cash needs. It can be used to evaluate a single property strategy or a staged portfolio acquisition plan, giving users a structured way to test assumptions, identify funding gaps, review performance metrics, and make more confident decisions before committing capital.
All-in-One Dashboard
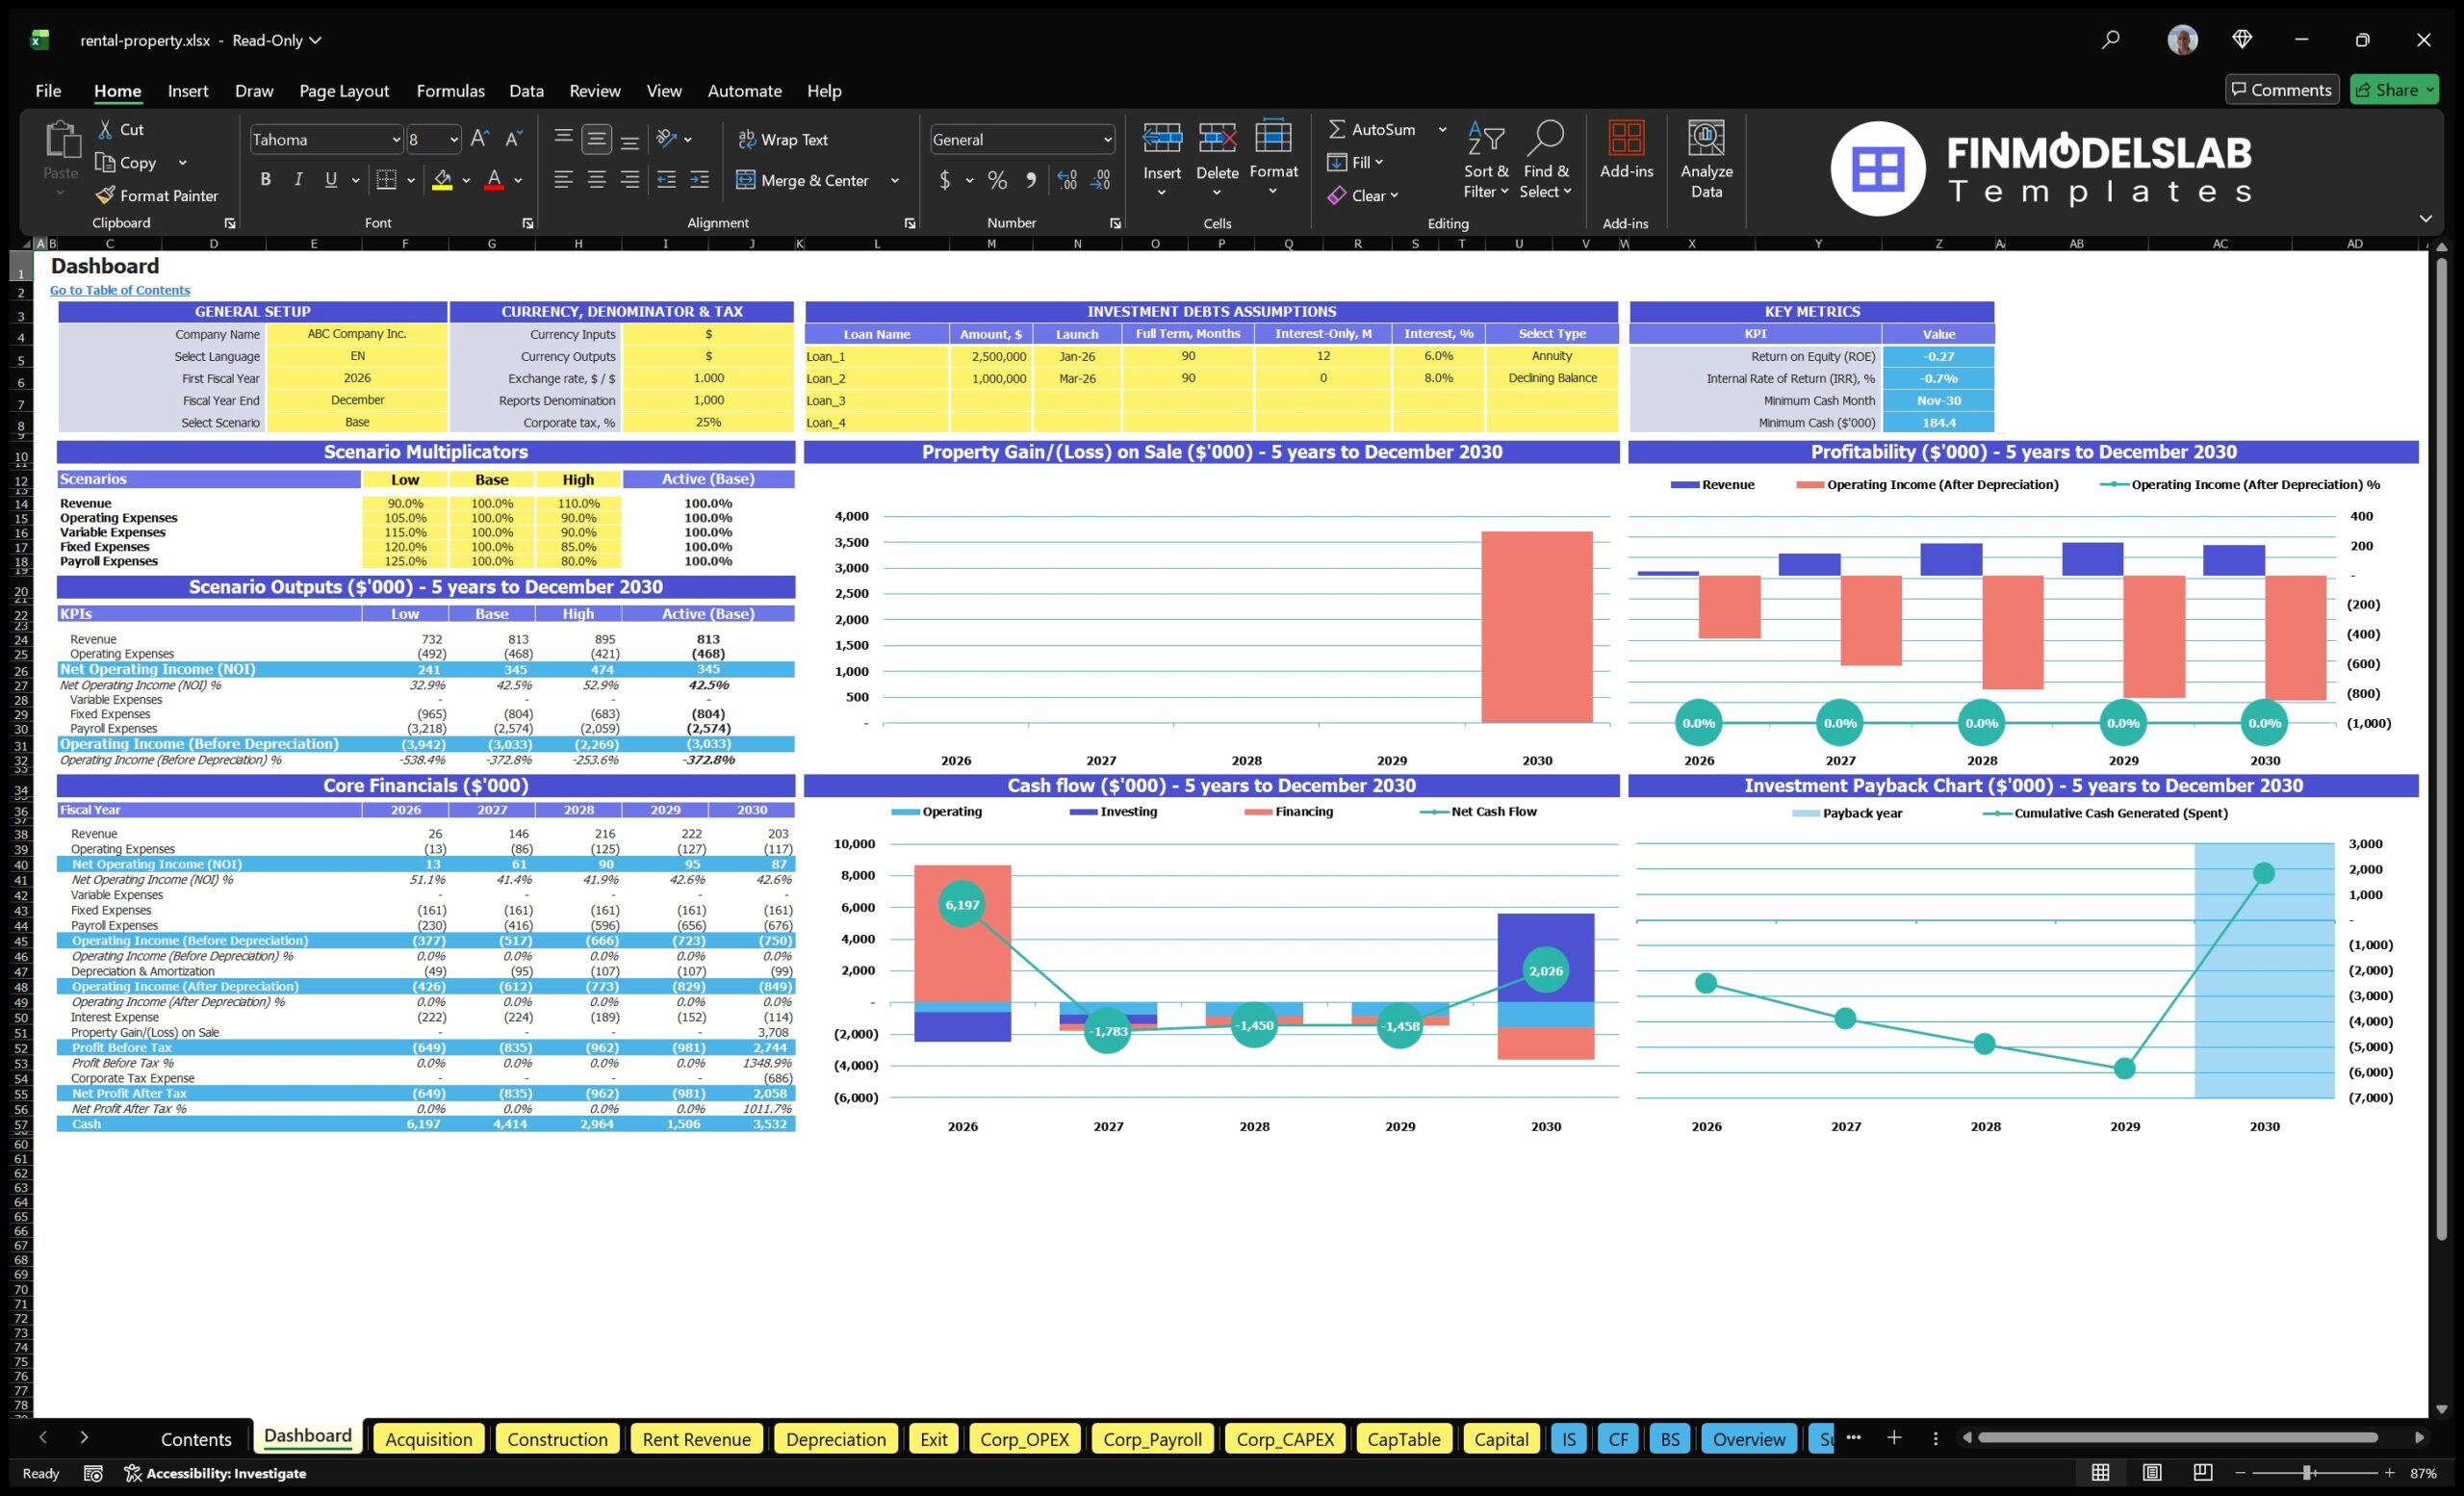
The all-in-one dashboard gives users a centralized view of the core inputs and core outputs that drive the Rental Property Financial Model. Instead of moving through disconnected calculations, users can review the most important assumptions and results in one place, such as property acquisition timing, purchase costs, renovation budgets, rental rates, occupancy expectations, debt assumptions, revenue projections, cash flow, profitability, and return metrics. This section is useful because rental property planning involves many moving parts, and small changes in rent, vacancy, financing, or repairs can materially affect the outcome. A consolidated dashboard helps users quickly understand whether the project is financially viable, whether cash reserves are adequate, and whether the expected return profile supports the investment thesis. It also makes the model easier to present to partners, lenders, or investors because the dashboard summarizes the story behind the numbers without requiring stakeholders to inspect every worksheet or calculation.
Low, Base, and High Scenario Analysis
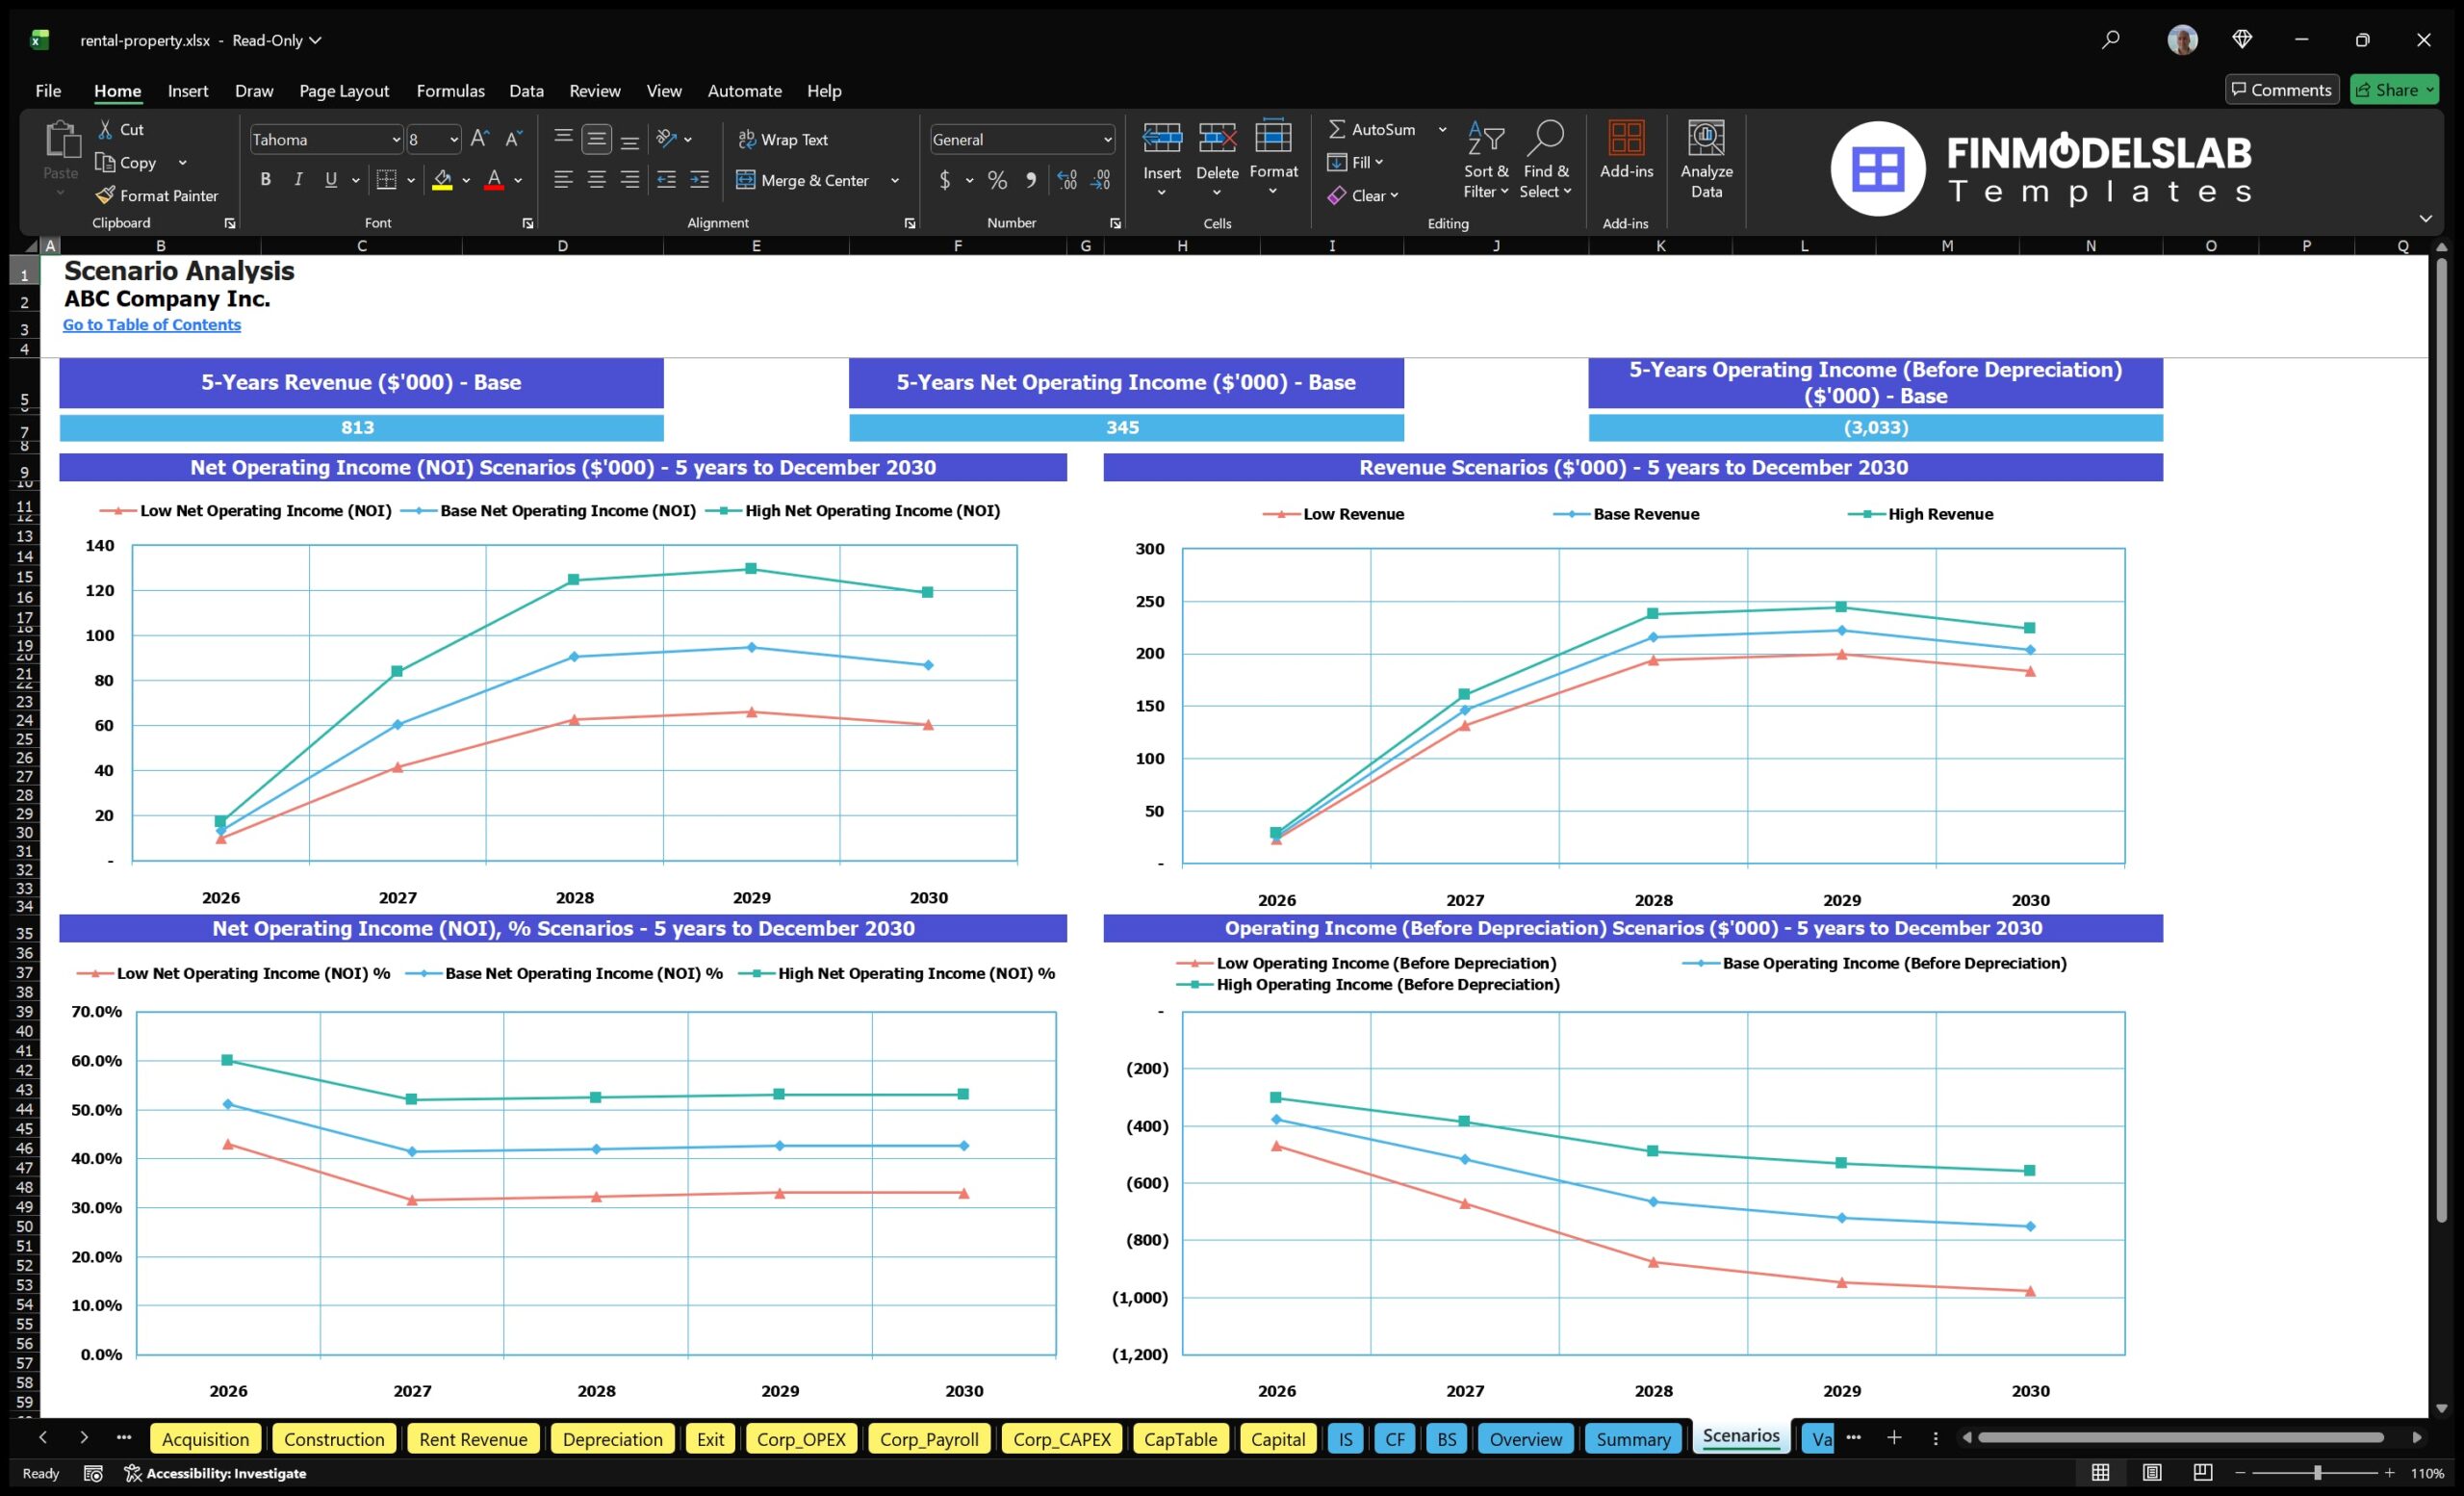
The low, base, and high scenario analysis section helps users evaluate how the rental property investment may perform under different market and operating conditions. The base case can reflect the most realistic plan, while the low case may test downside risks such as slower lease-up, higher vacancy, lower rent growth, increased repairs, delayed renovations, or weaker exit pricing. The high case can show upside potential from stronger rental demand, faster stabilization, lower operating costs, better financing terms, or higher property appreciation. This component is especially valuable for real estate planning because rental property returns depend heavily on assumptions that may change over time. By comparing scenarios, users can see the impact on cash flow, profitability, IRR, equity returns, DSCR, and funding needs. This helps investors and operators prepare contingency plans, evaluate risk tolerance, negotiate financing more effectively, and decide whether the project remains attractive even when assumptions move against the original plan.
Professional Charts
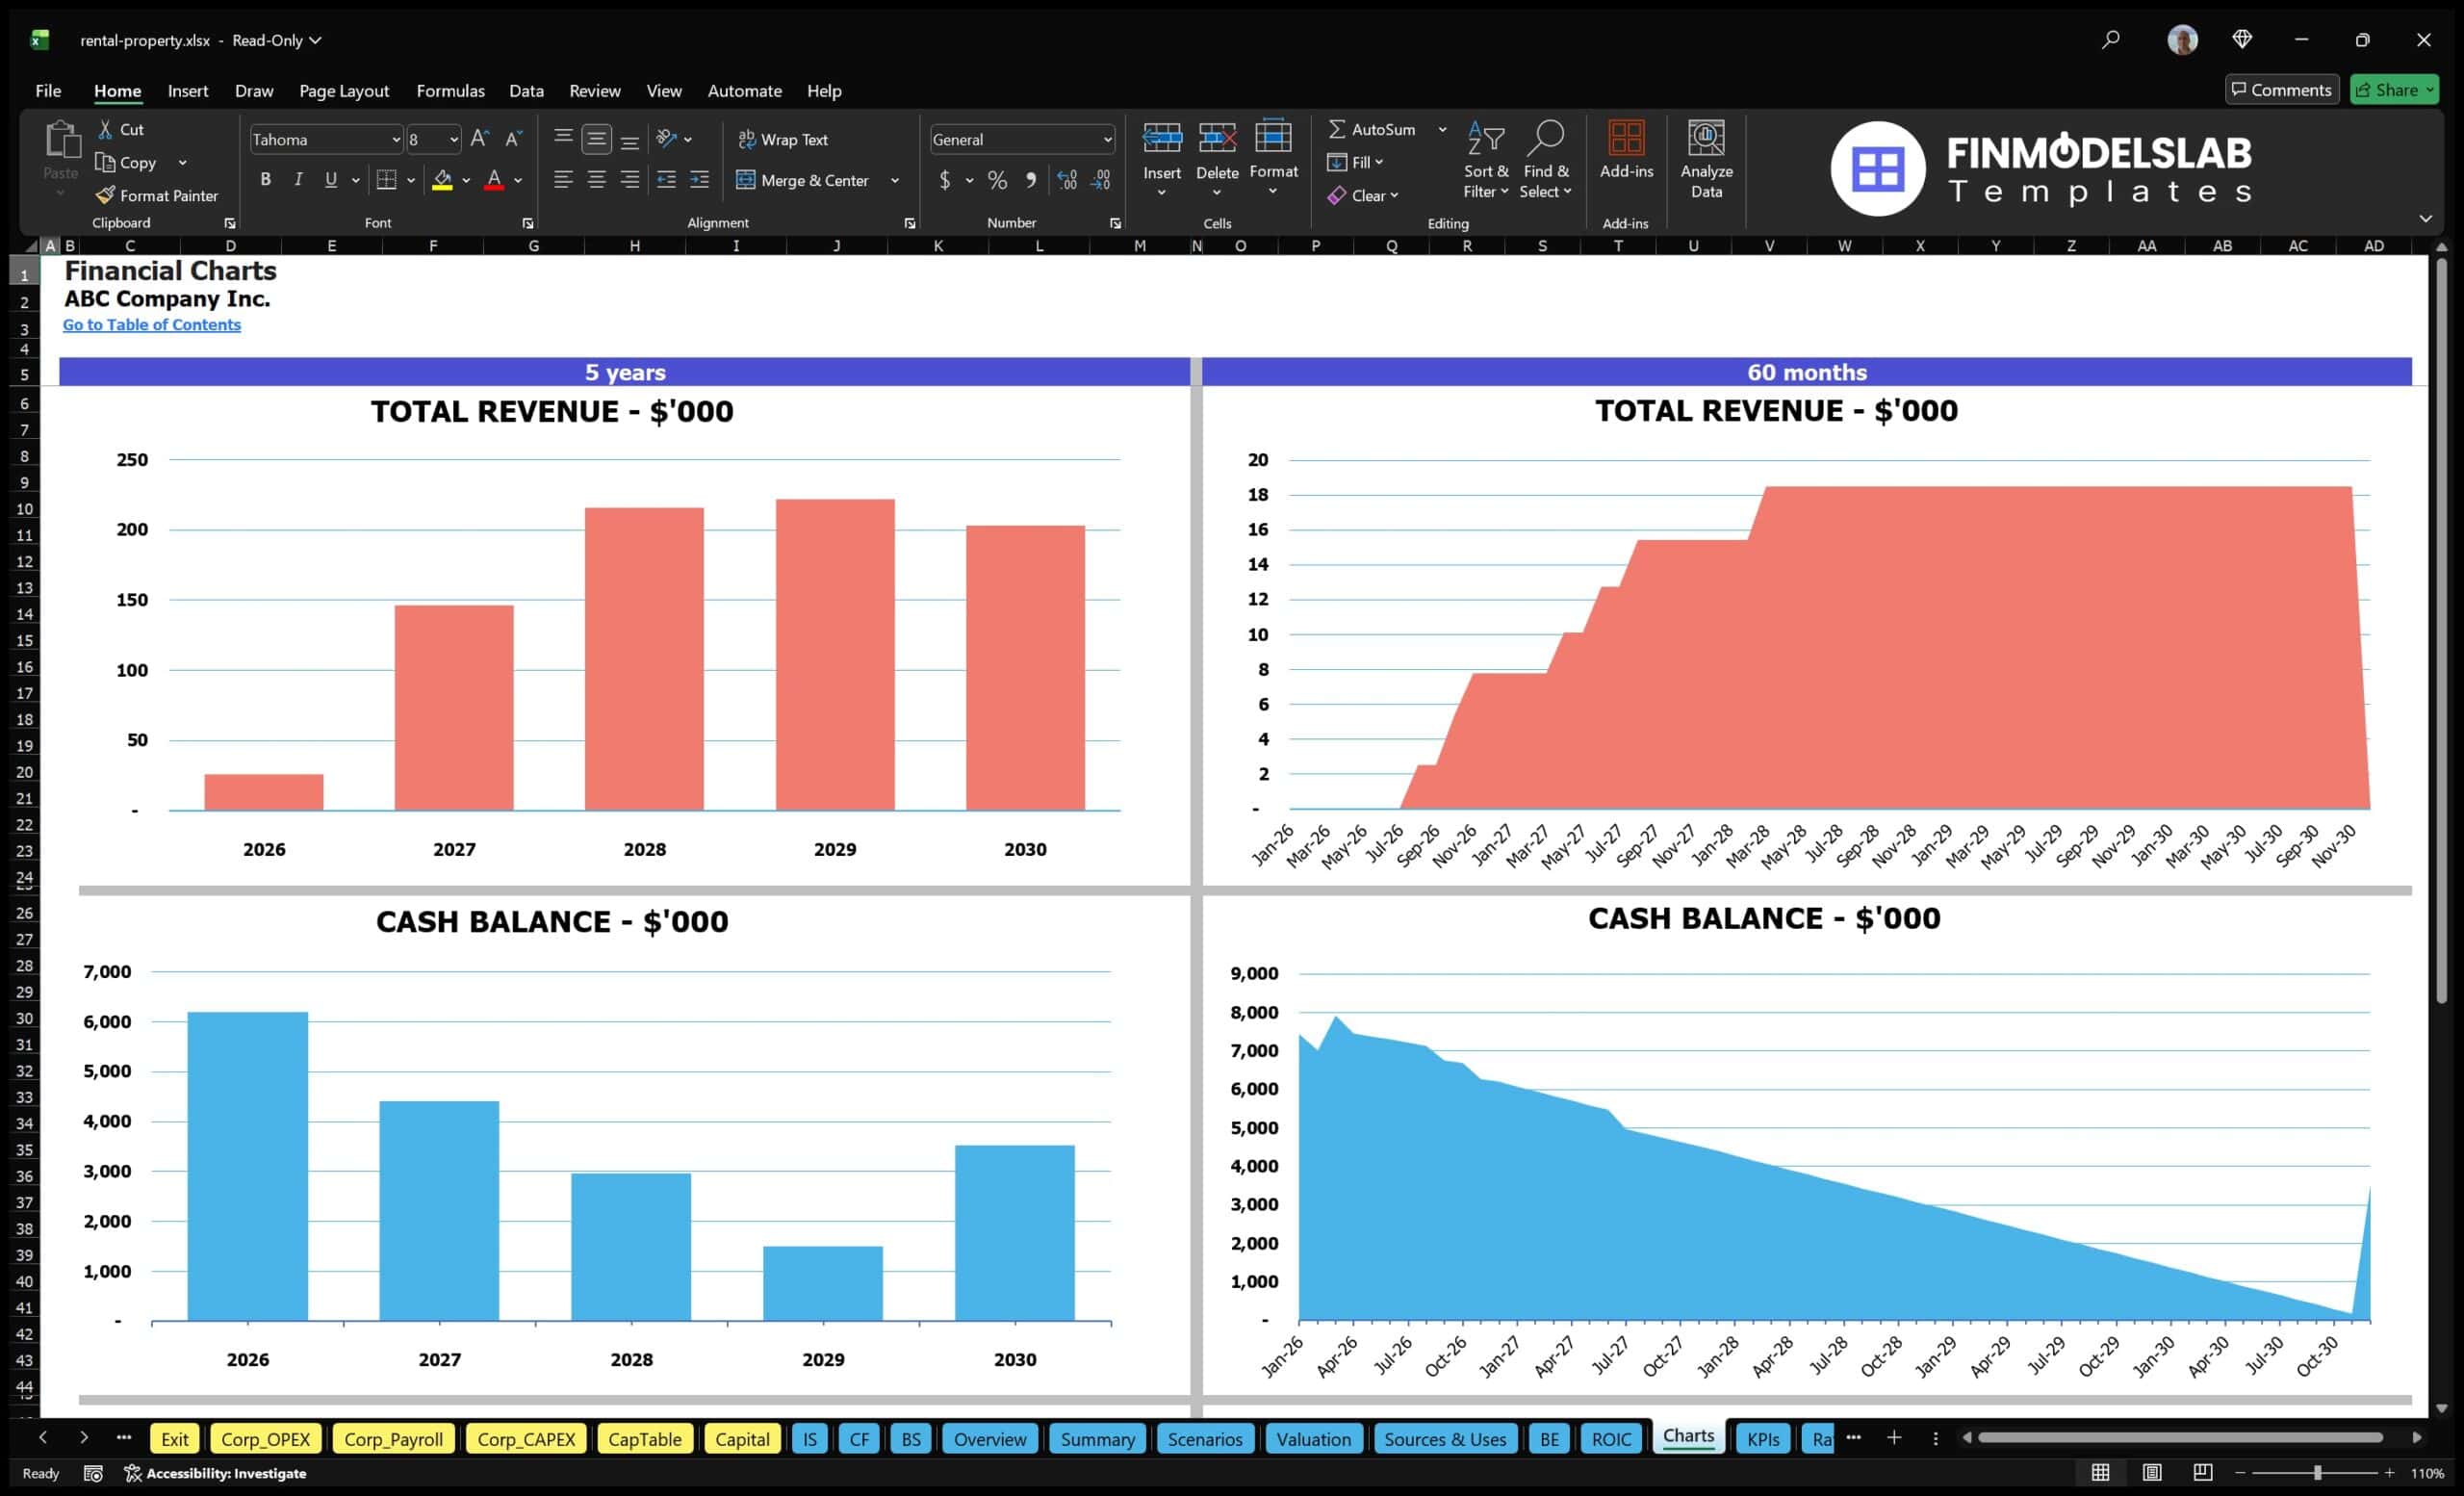
The professional charts section turns the financial model’s calculations into clear visual outputs that can be used for presentations, internal reviews, lender discussions, or investor updates. It may include charts for revenue growth, expense trends, cash flow movement, net operating income, debt service, profitability, equity returns, and ending cash balances. Rental property financials can become complex because the user may need to explain acquisition timing, renovation spending, leasing ramp-up, operating costs, financing costs, and eventual sale proceeds over several years. Charts make those trends easier to understand at a glance. This component is useful for communicating the investment narrative, showing where cash pressure occurs, highlighting when rental income stabilizes, and illustrating how long-term value may develop. For users preparing a business plan or pitch deck, these visual reports help convert spreadsheet data into presentation-ready insights that are easier for stakeholders to interpret and discuss.
ROE Components and DuPont Analysis
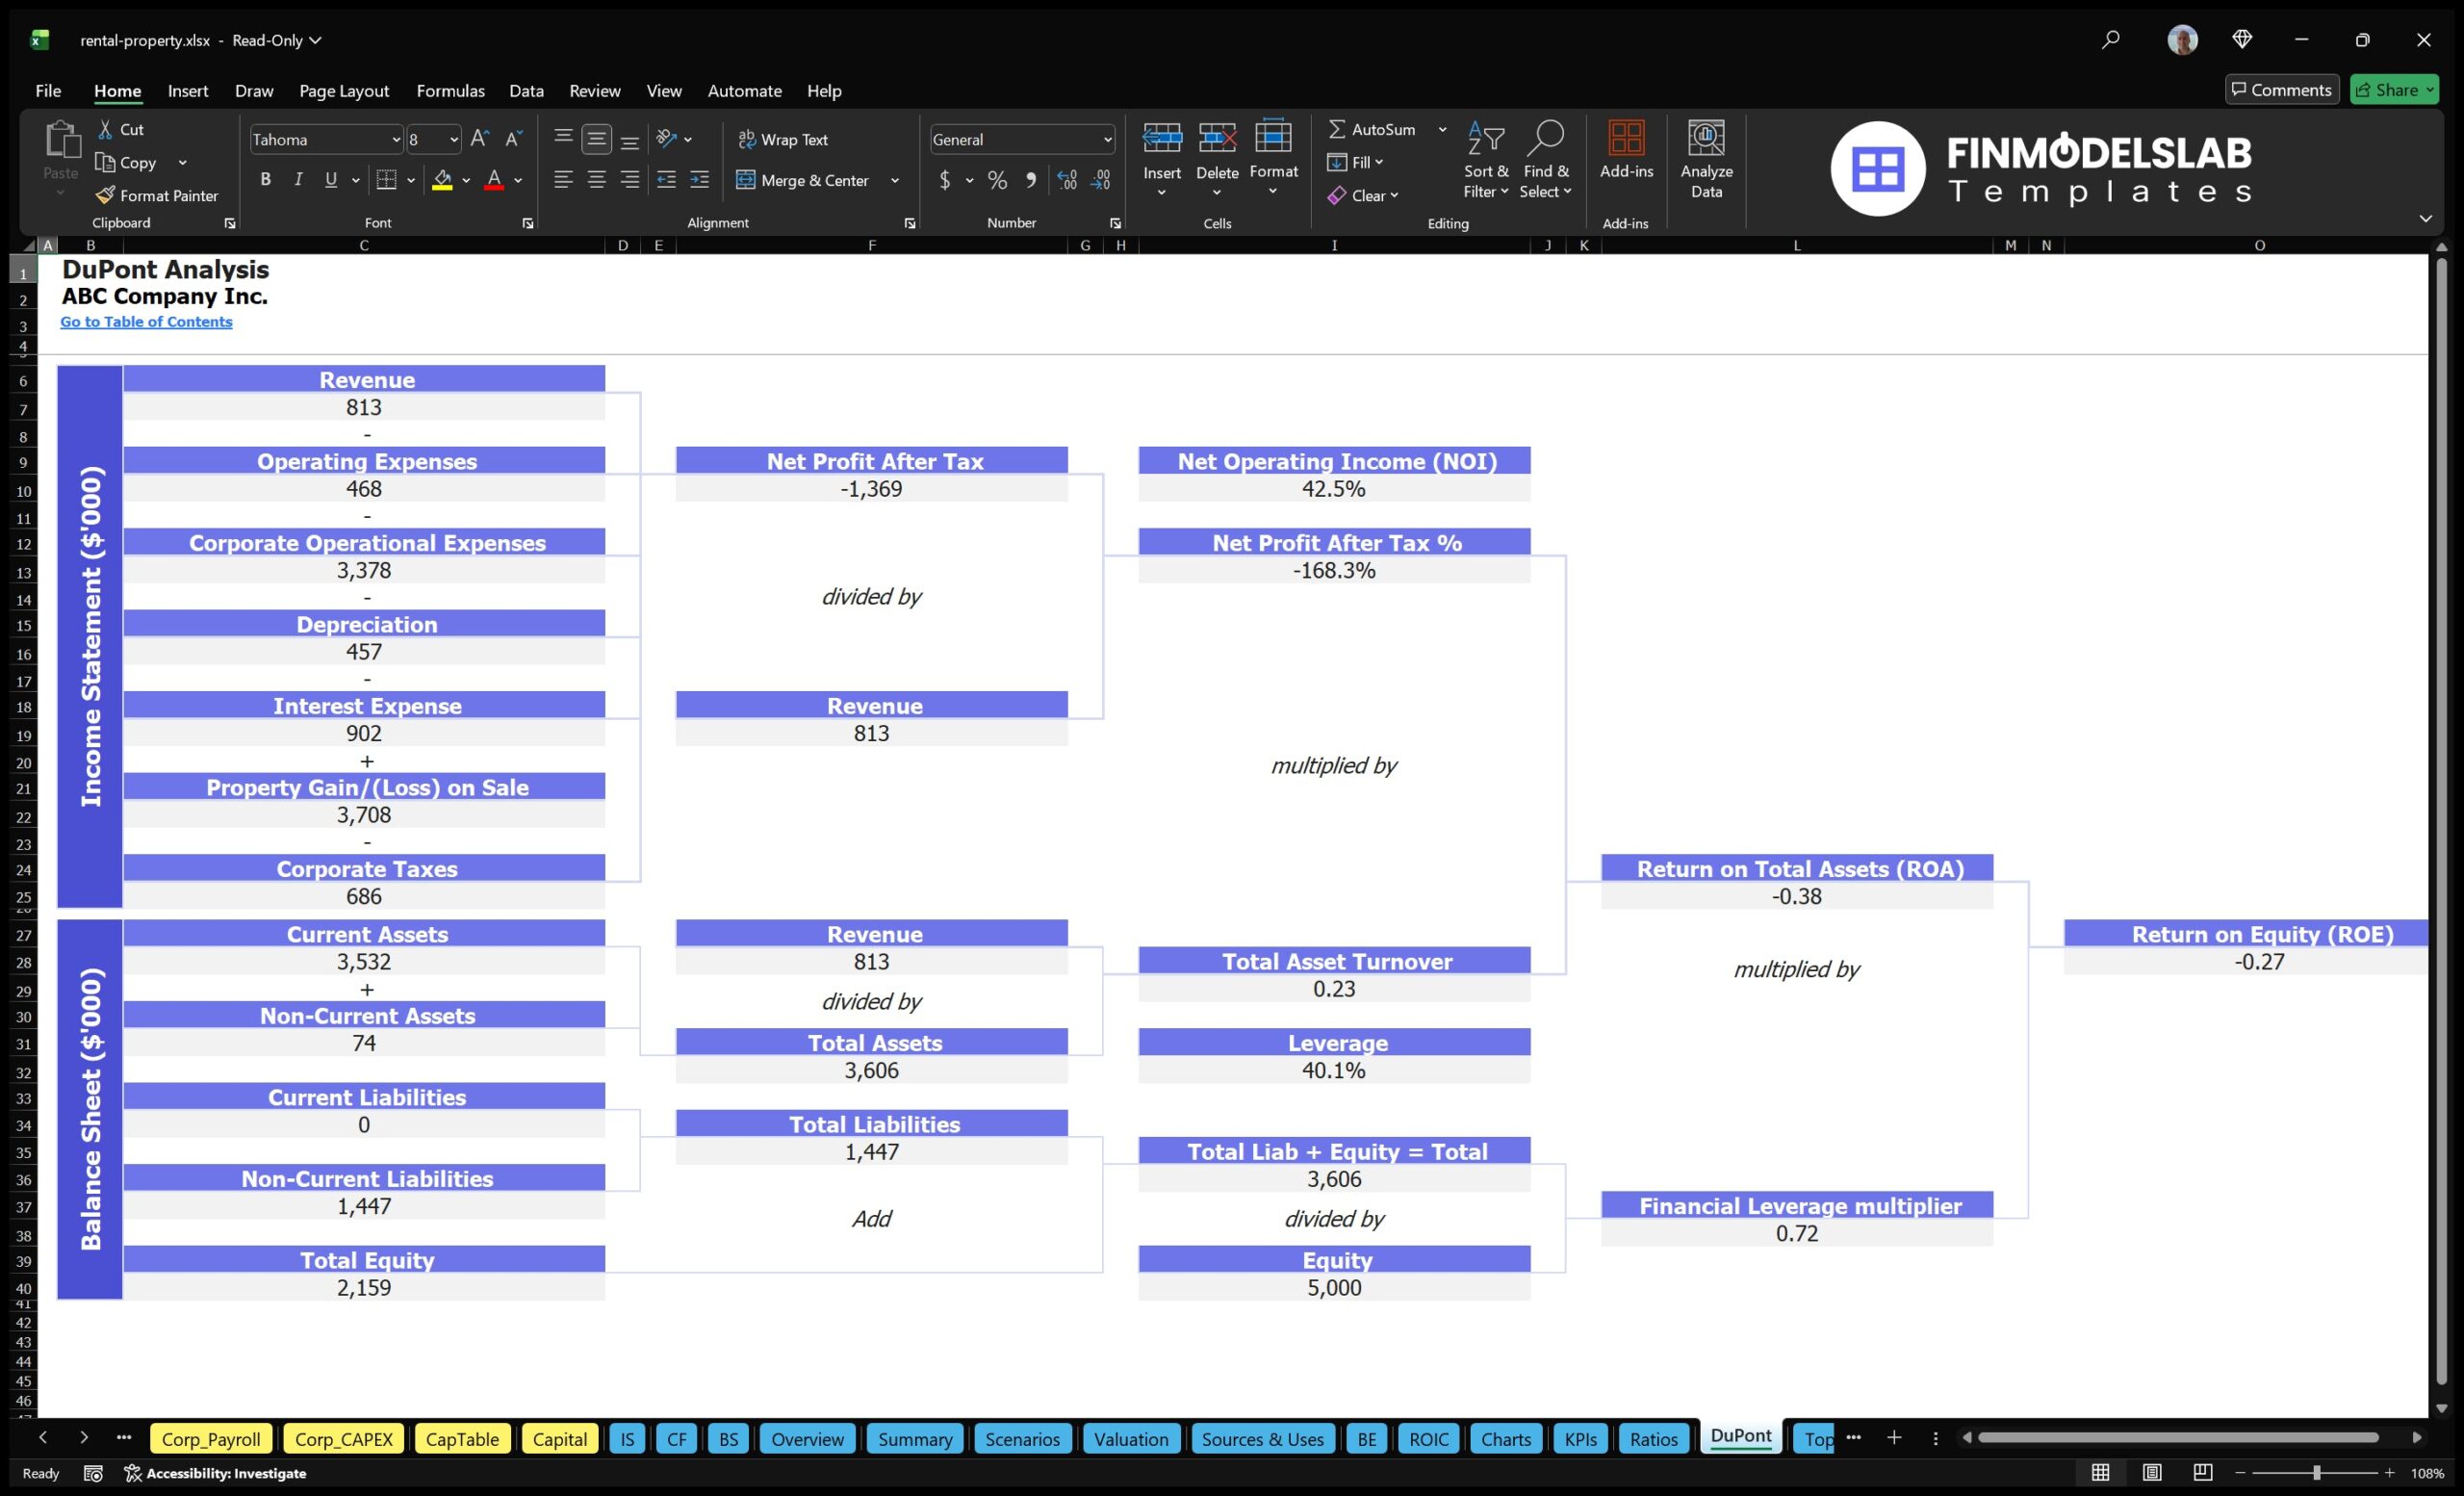
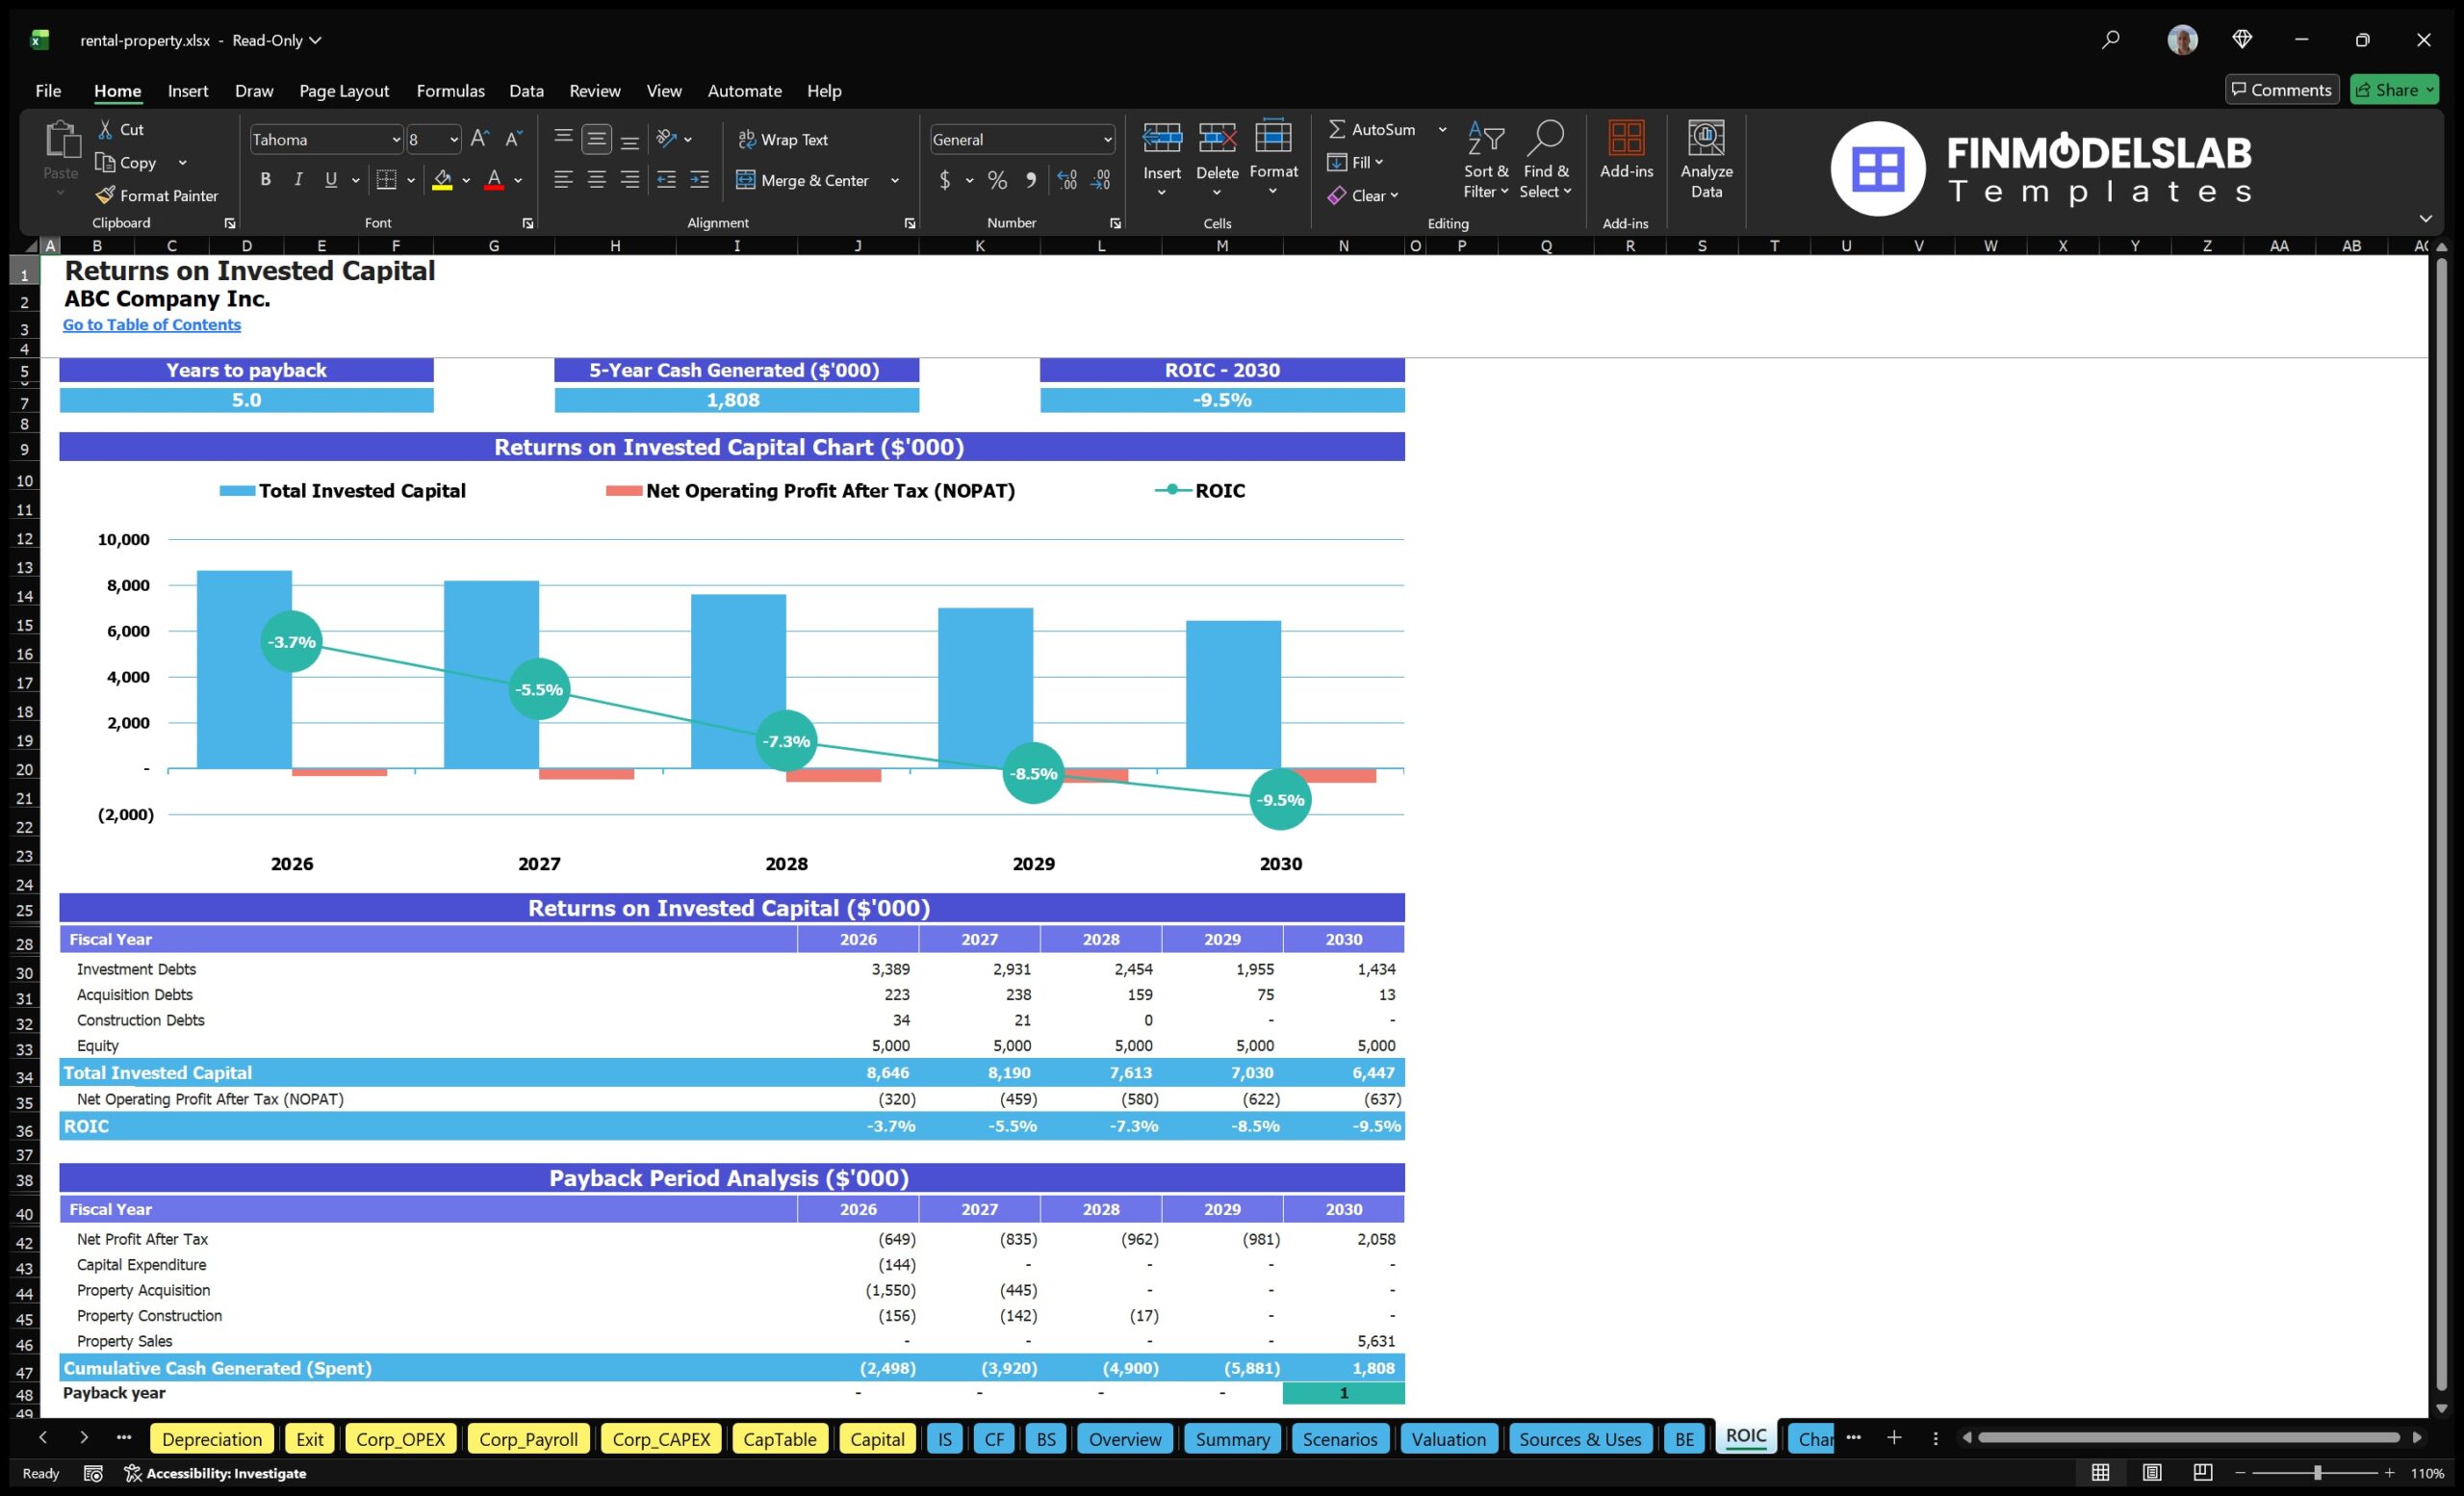
The ROE components and DuPont analysis section helps users understand what is driving return on equity rather than simply viewing the final return percentage. In a rental property model, equity returns may be affected by operating margin, asset productivity, leverage, debt service, appreciation, sale timing, and the amount of owner or investor capital required. This component can break return on equity into meaningful parts, allowing users to see whether performance is being driven by rental operations, financing structure, asset value growth, or the efficient use of capital. For rental property investments, this is important because an investment may show weak operating returns during the hold period but depend on appreciation and exit proceeds for final investor returns. By analyzing ROE drivers, users can identify whether the plan is too dependent on leverage, whether operating income is sufficient, and whether changes to acquisition pricing, renovation strategy, rent levels, or financing assumptions could improve the investment profile.
Revenue Inputs
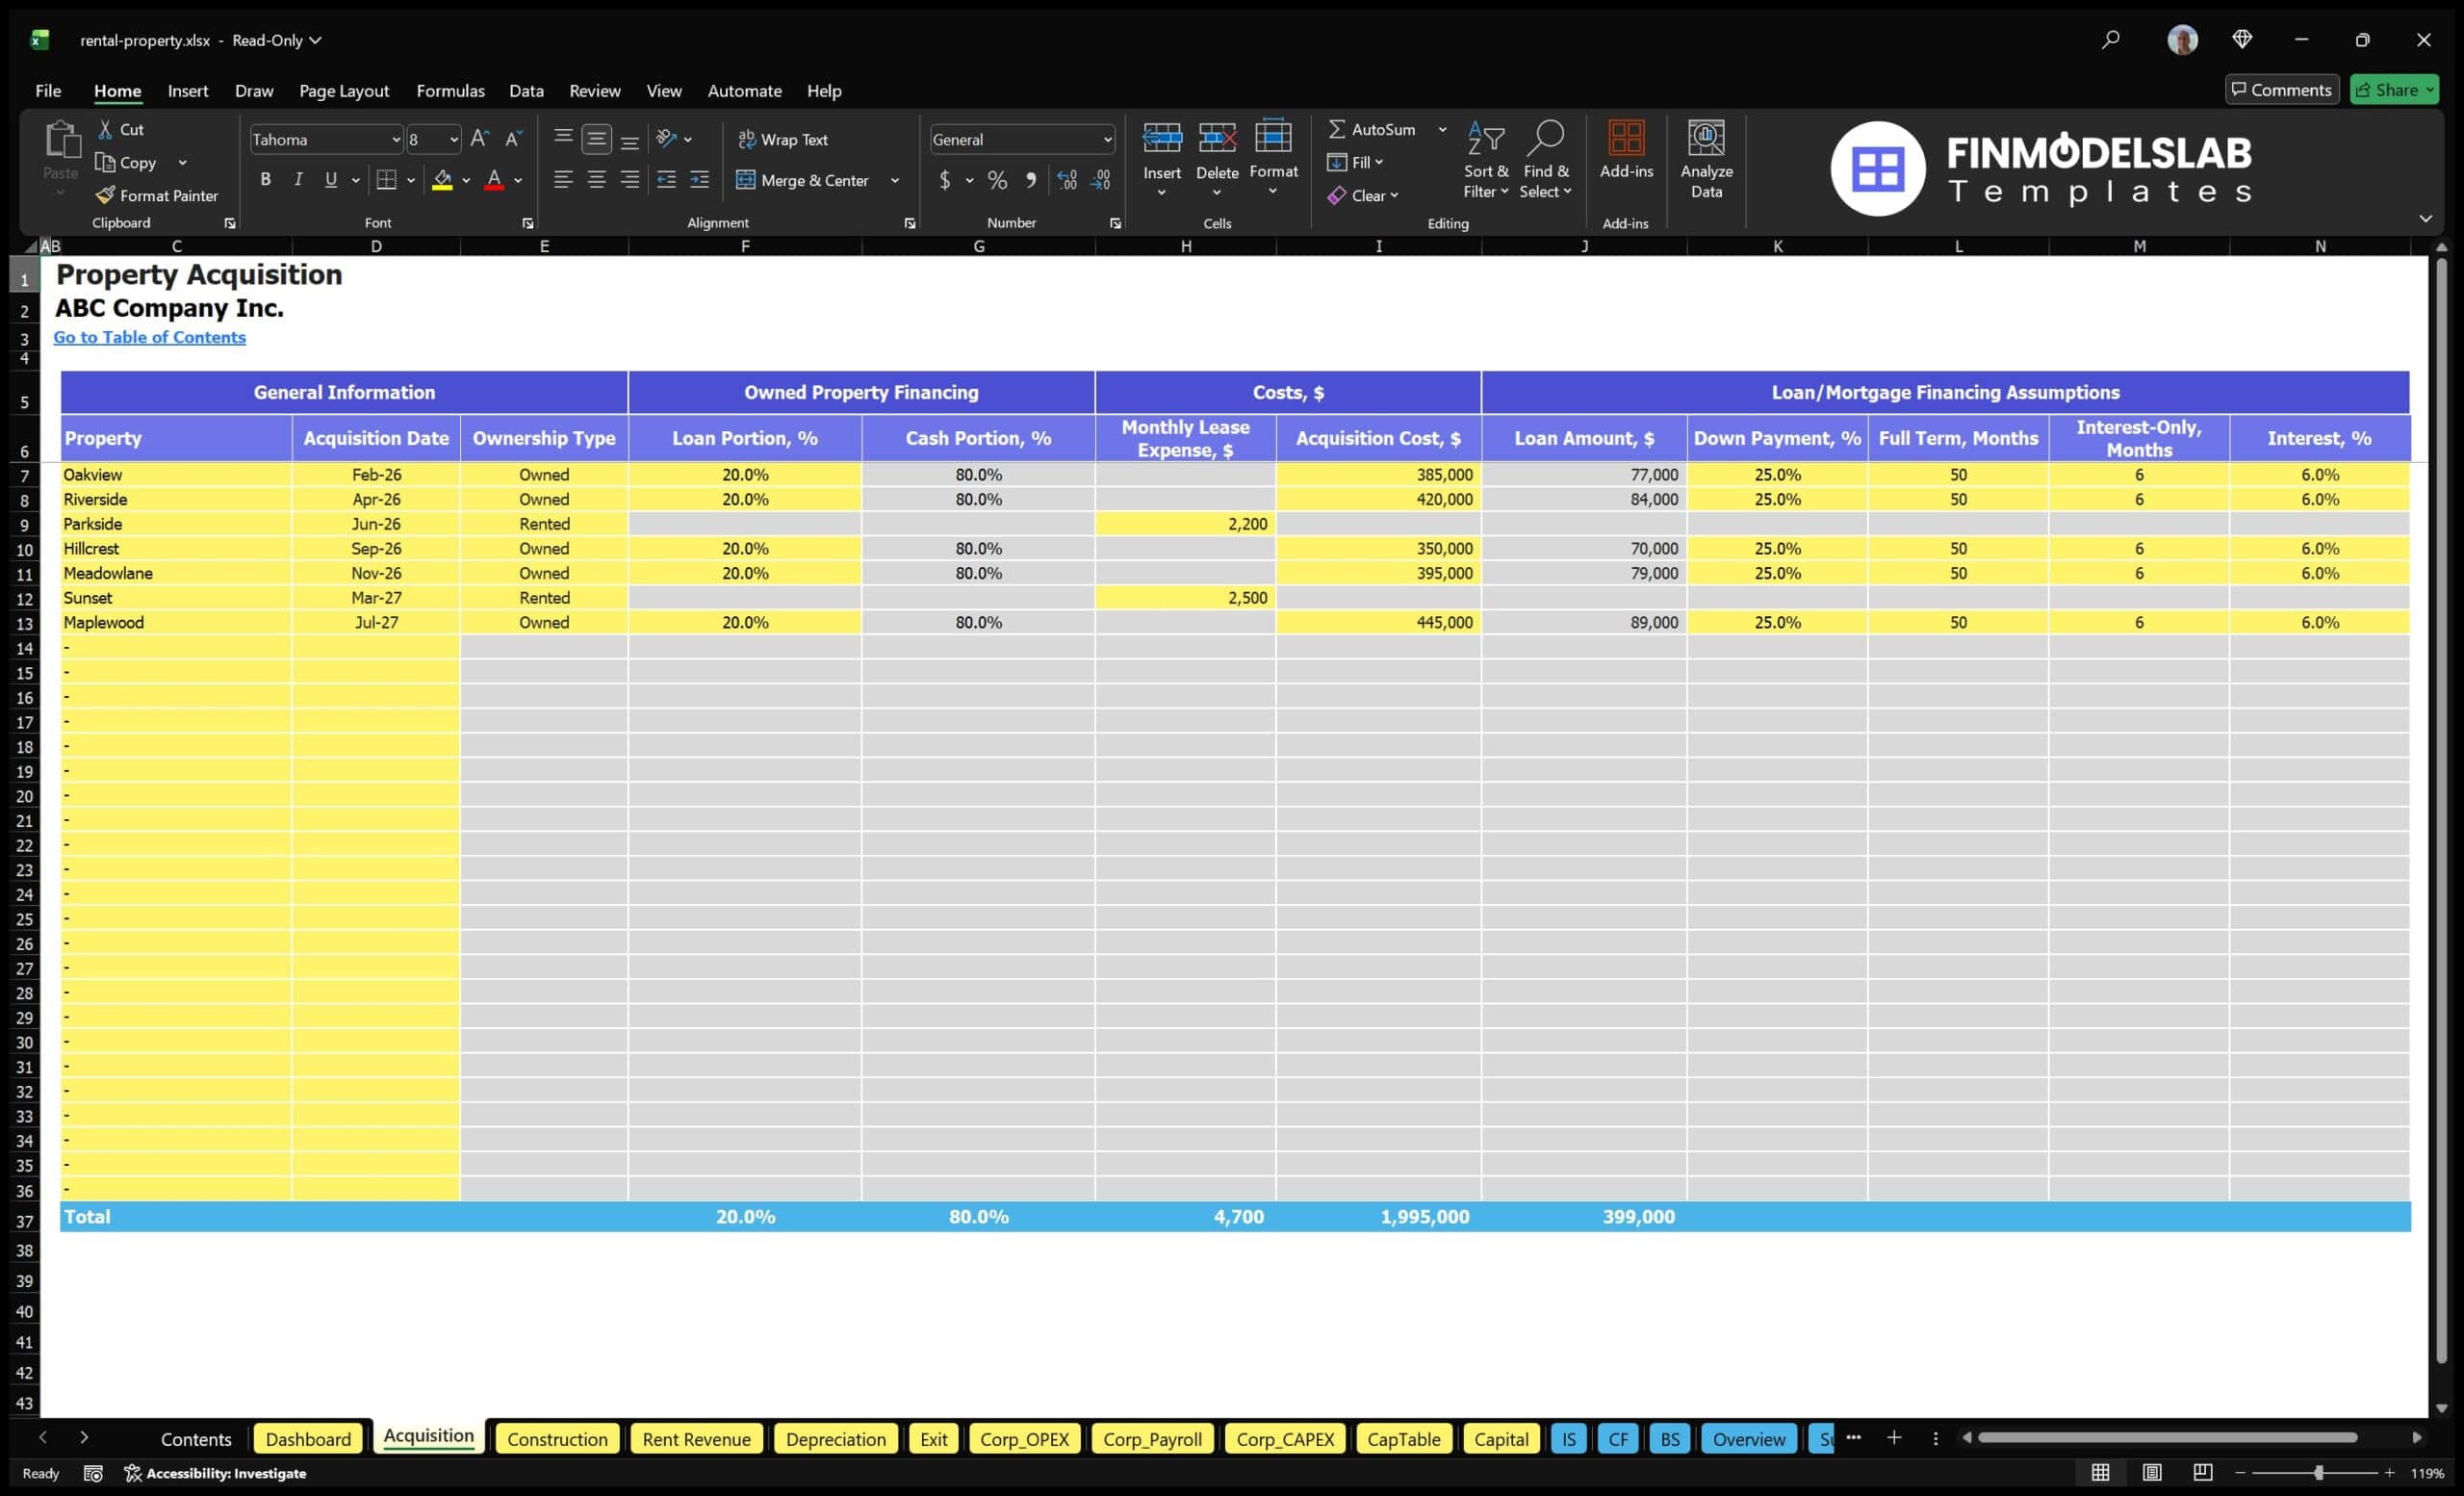
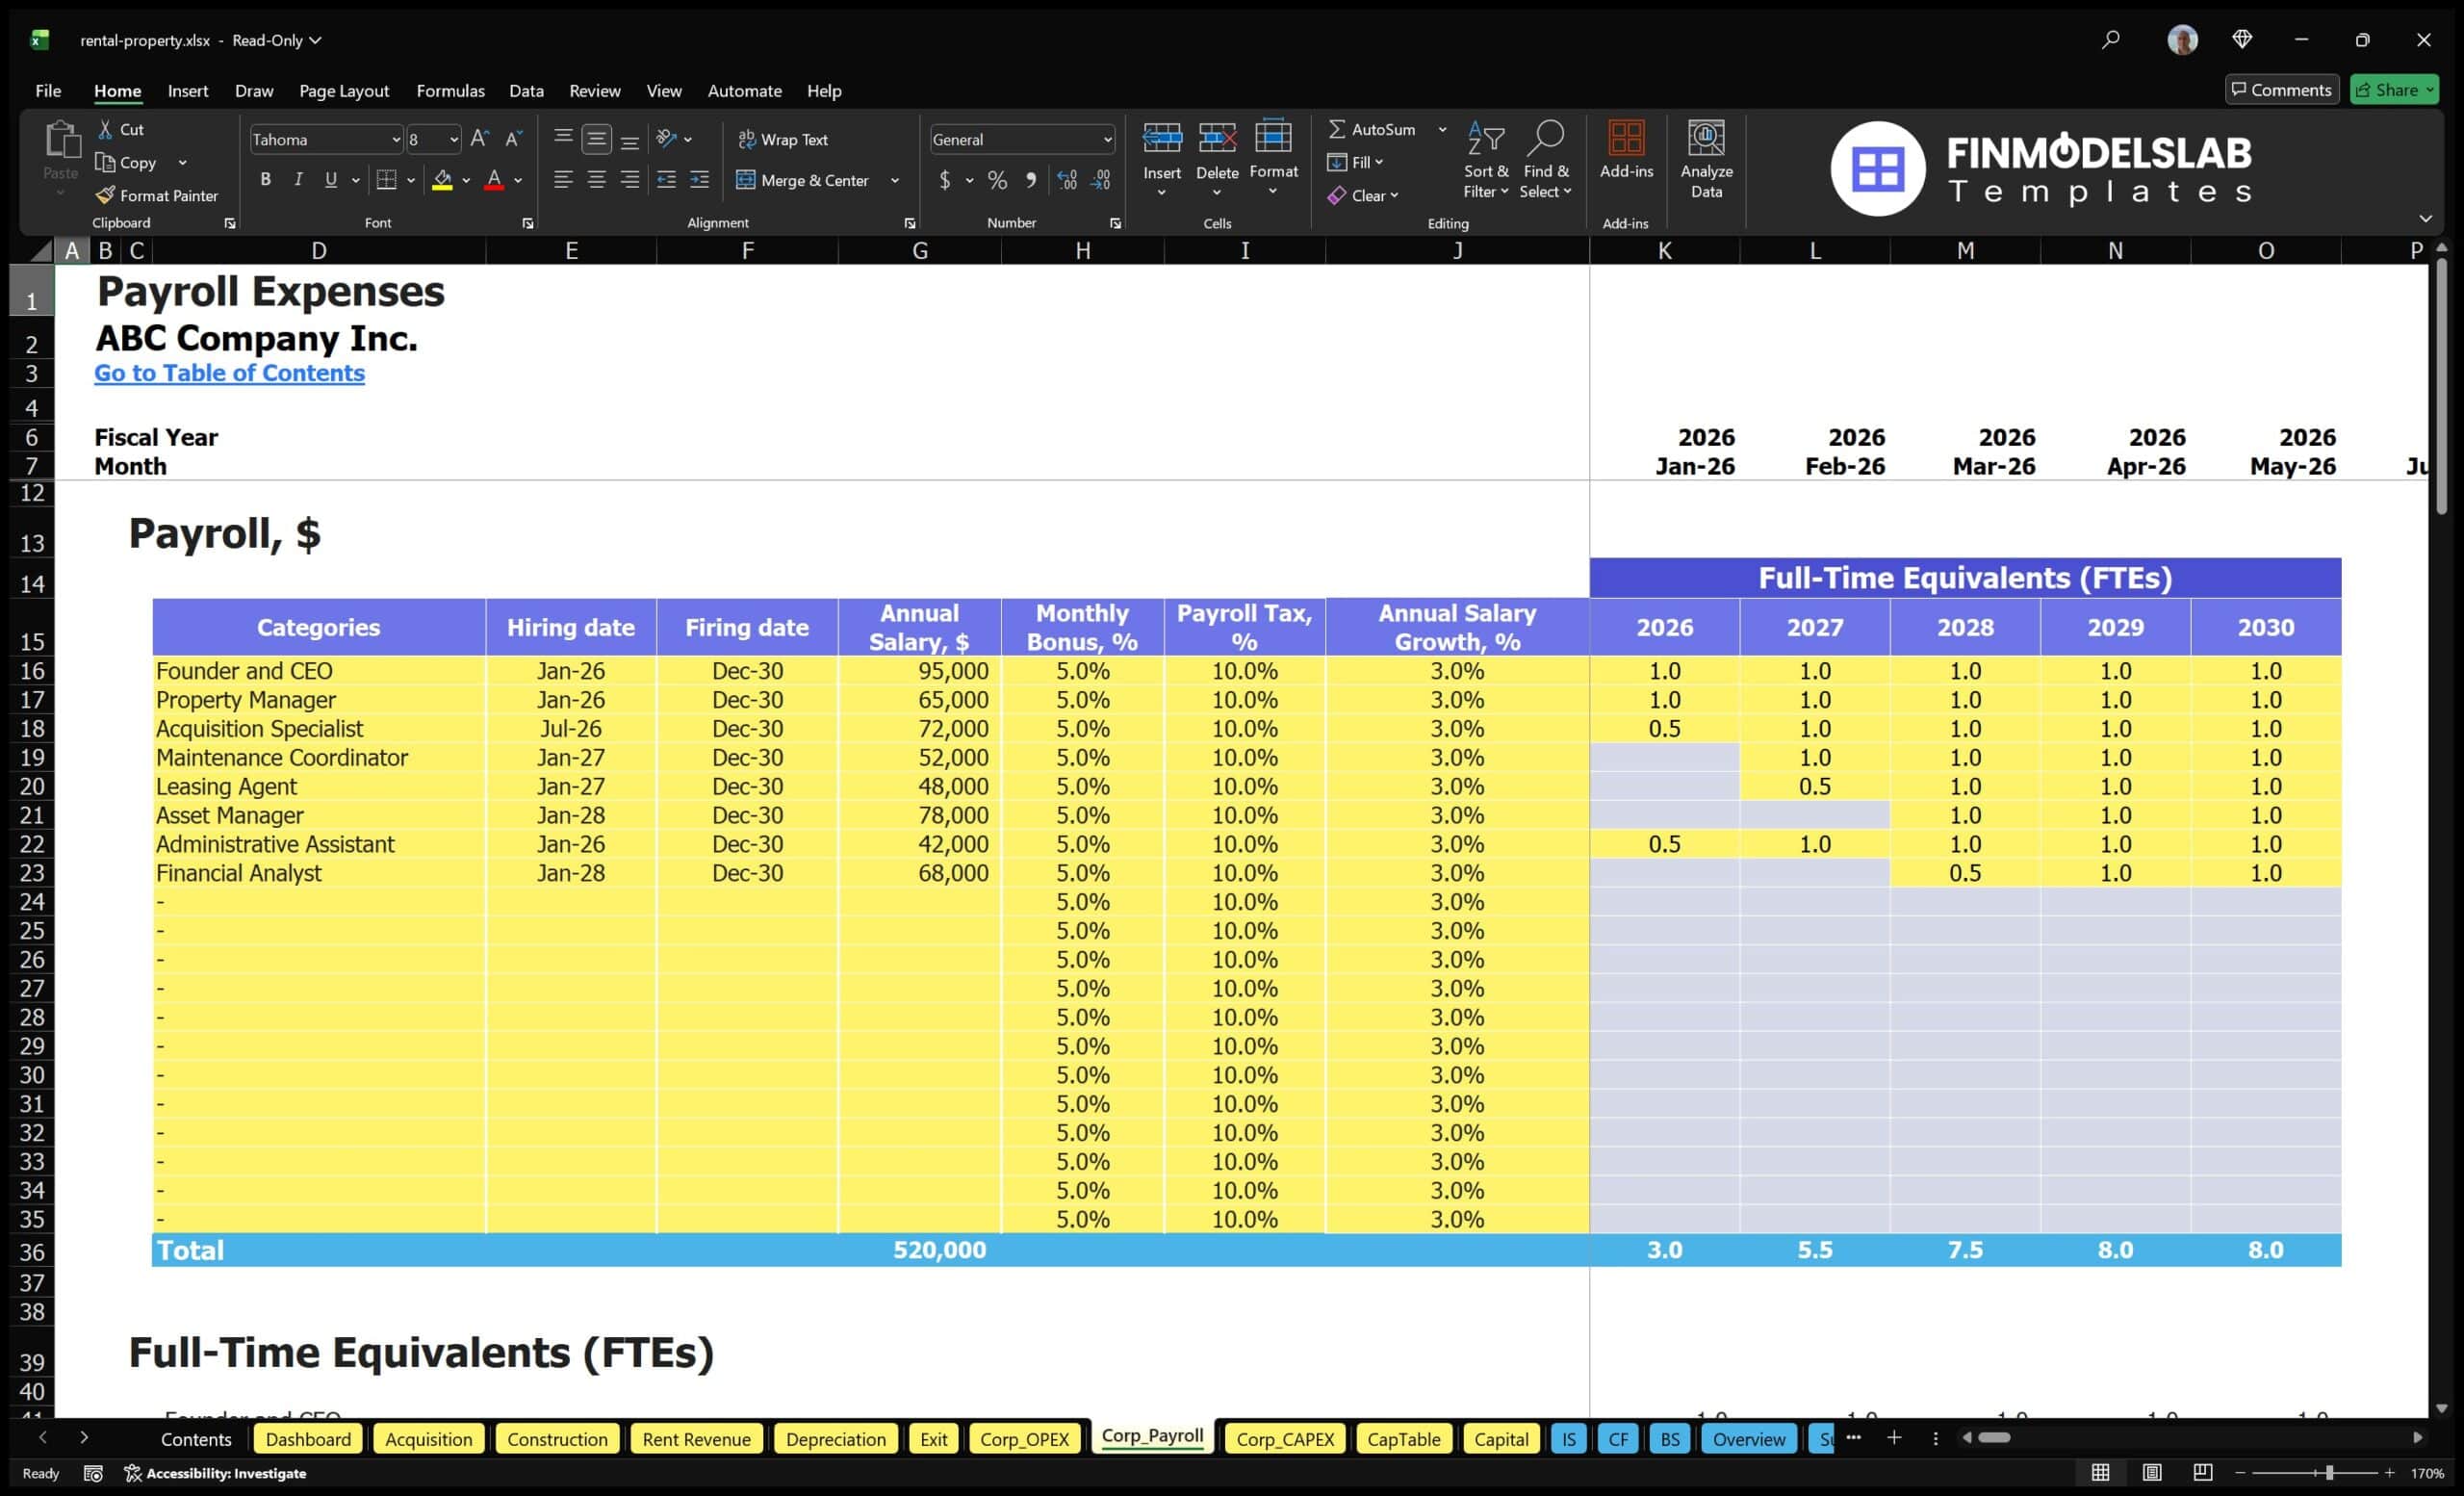
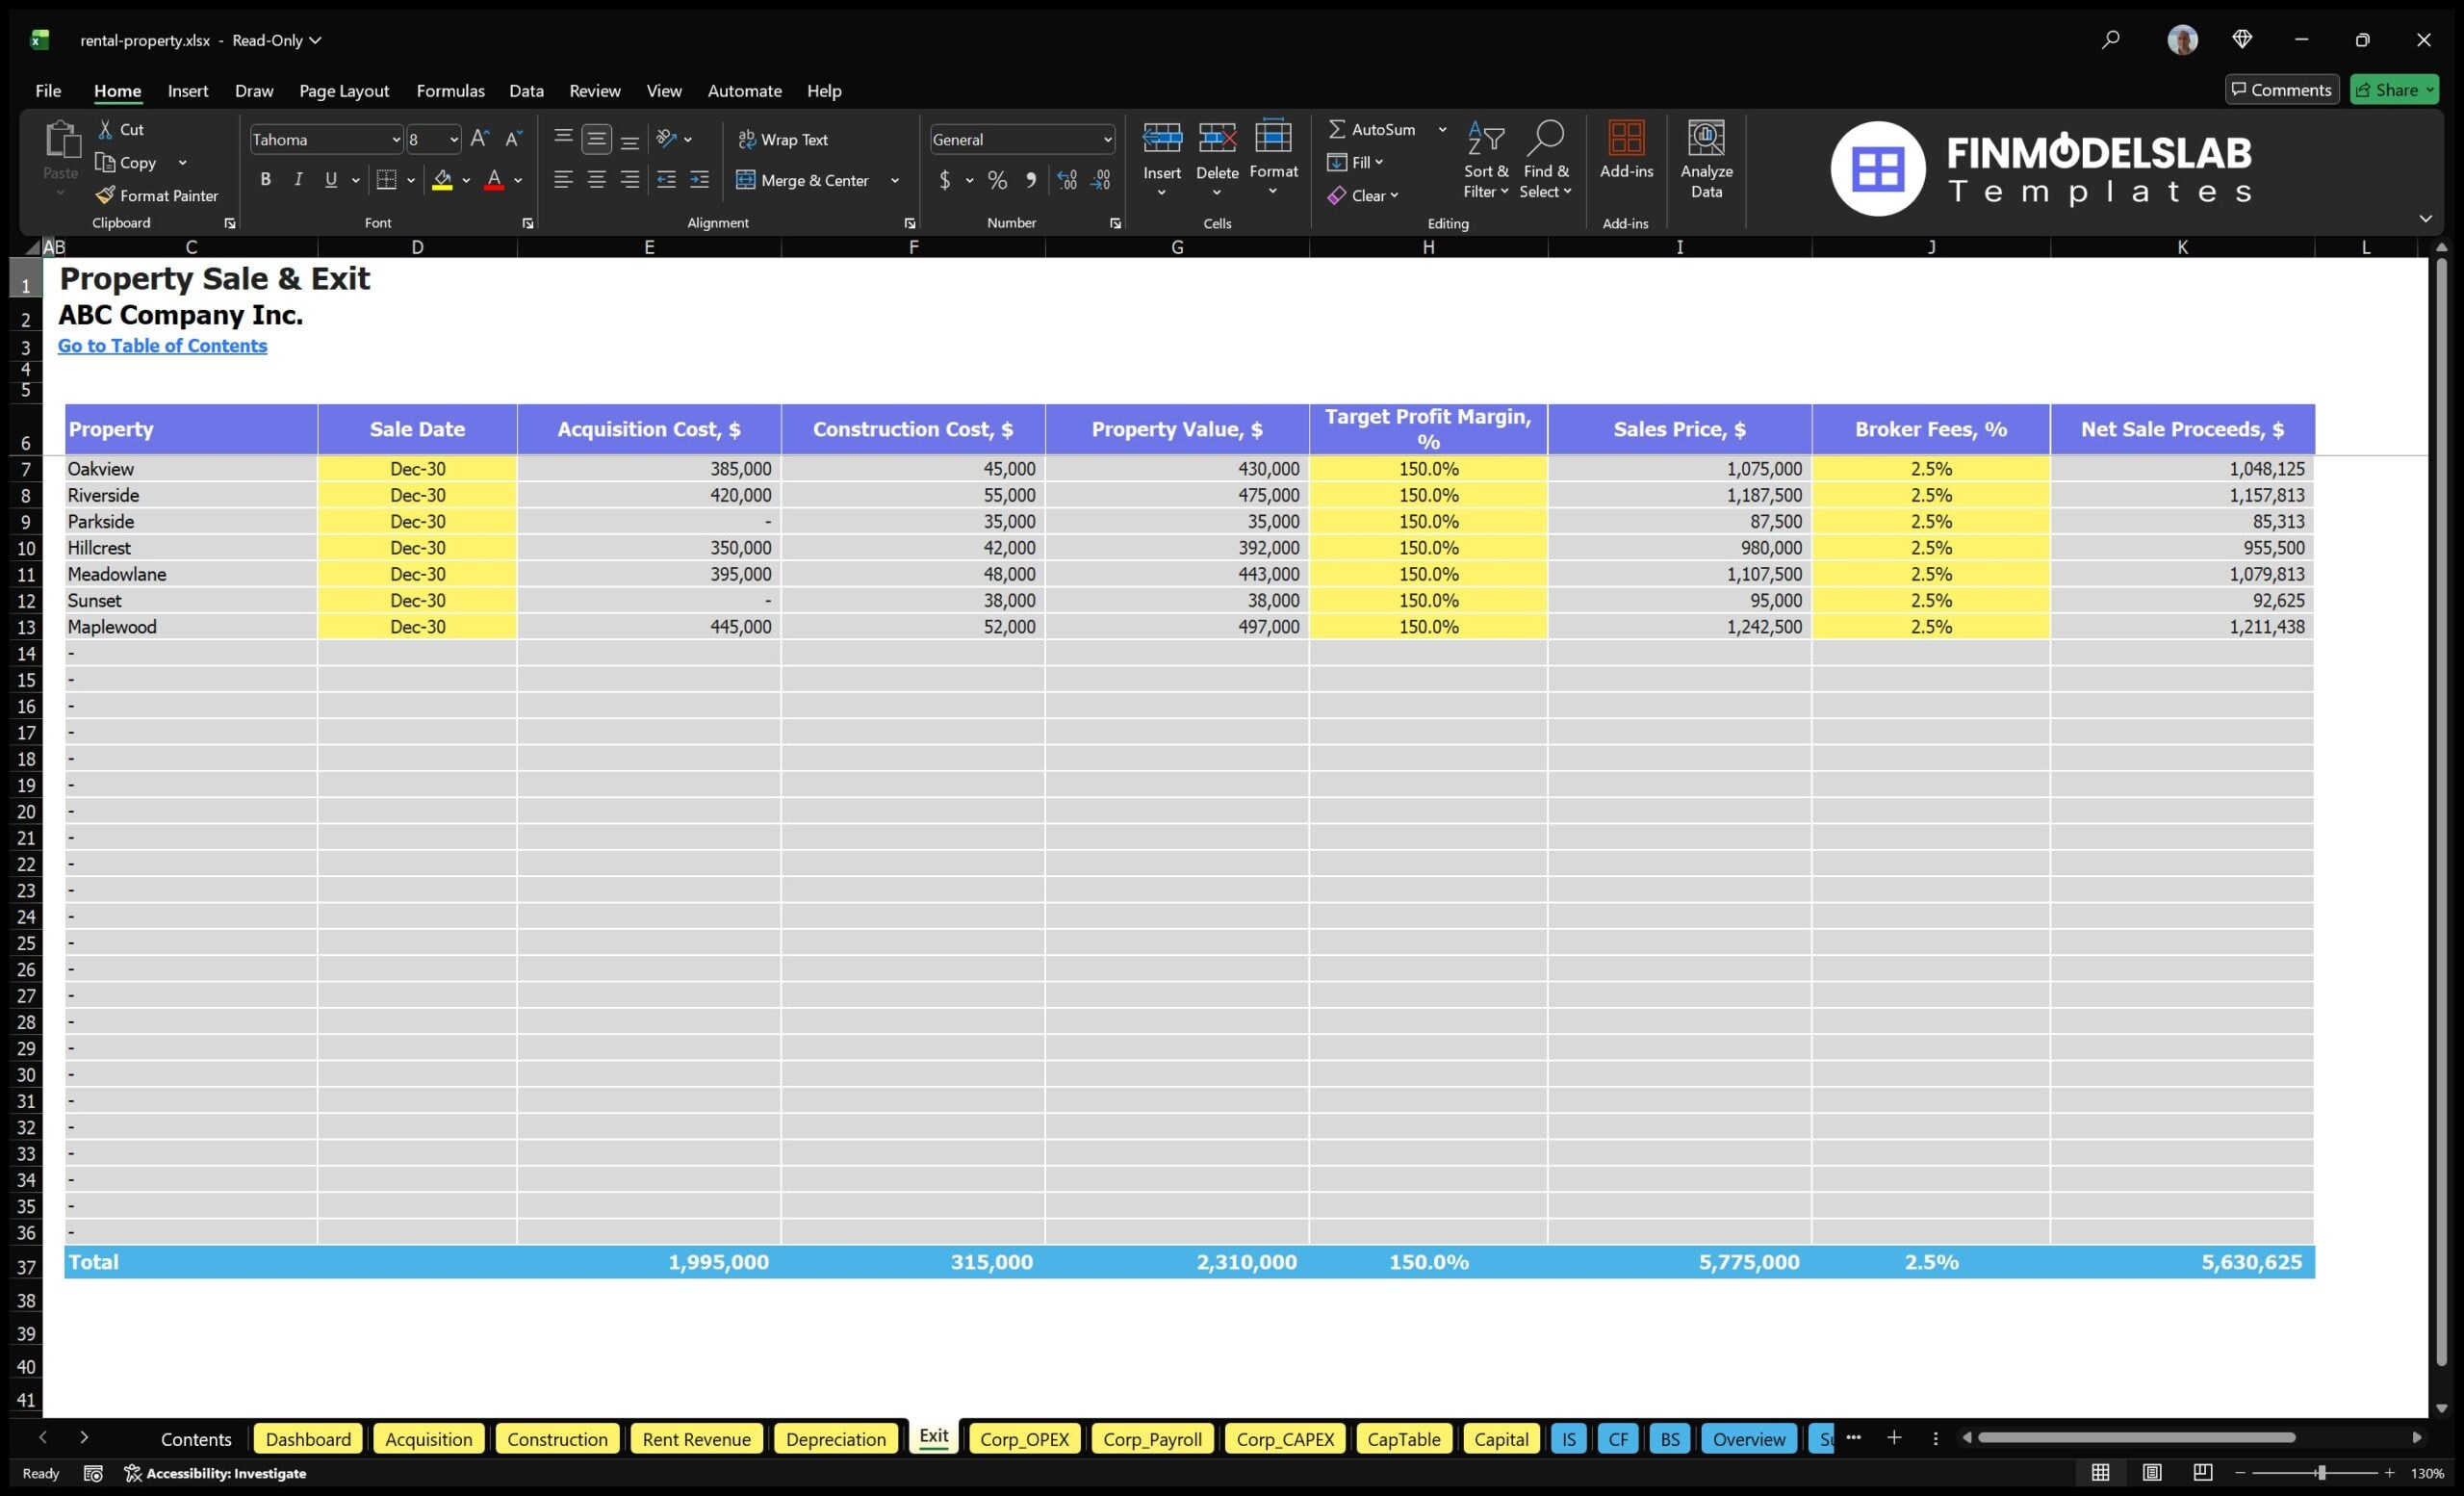
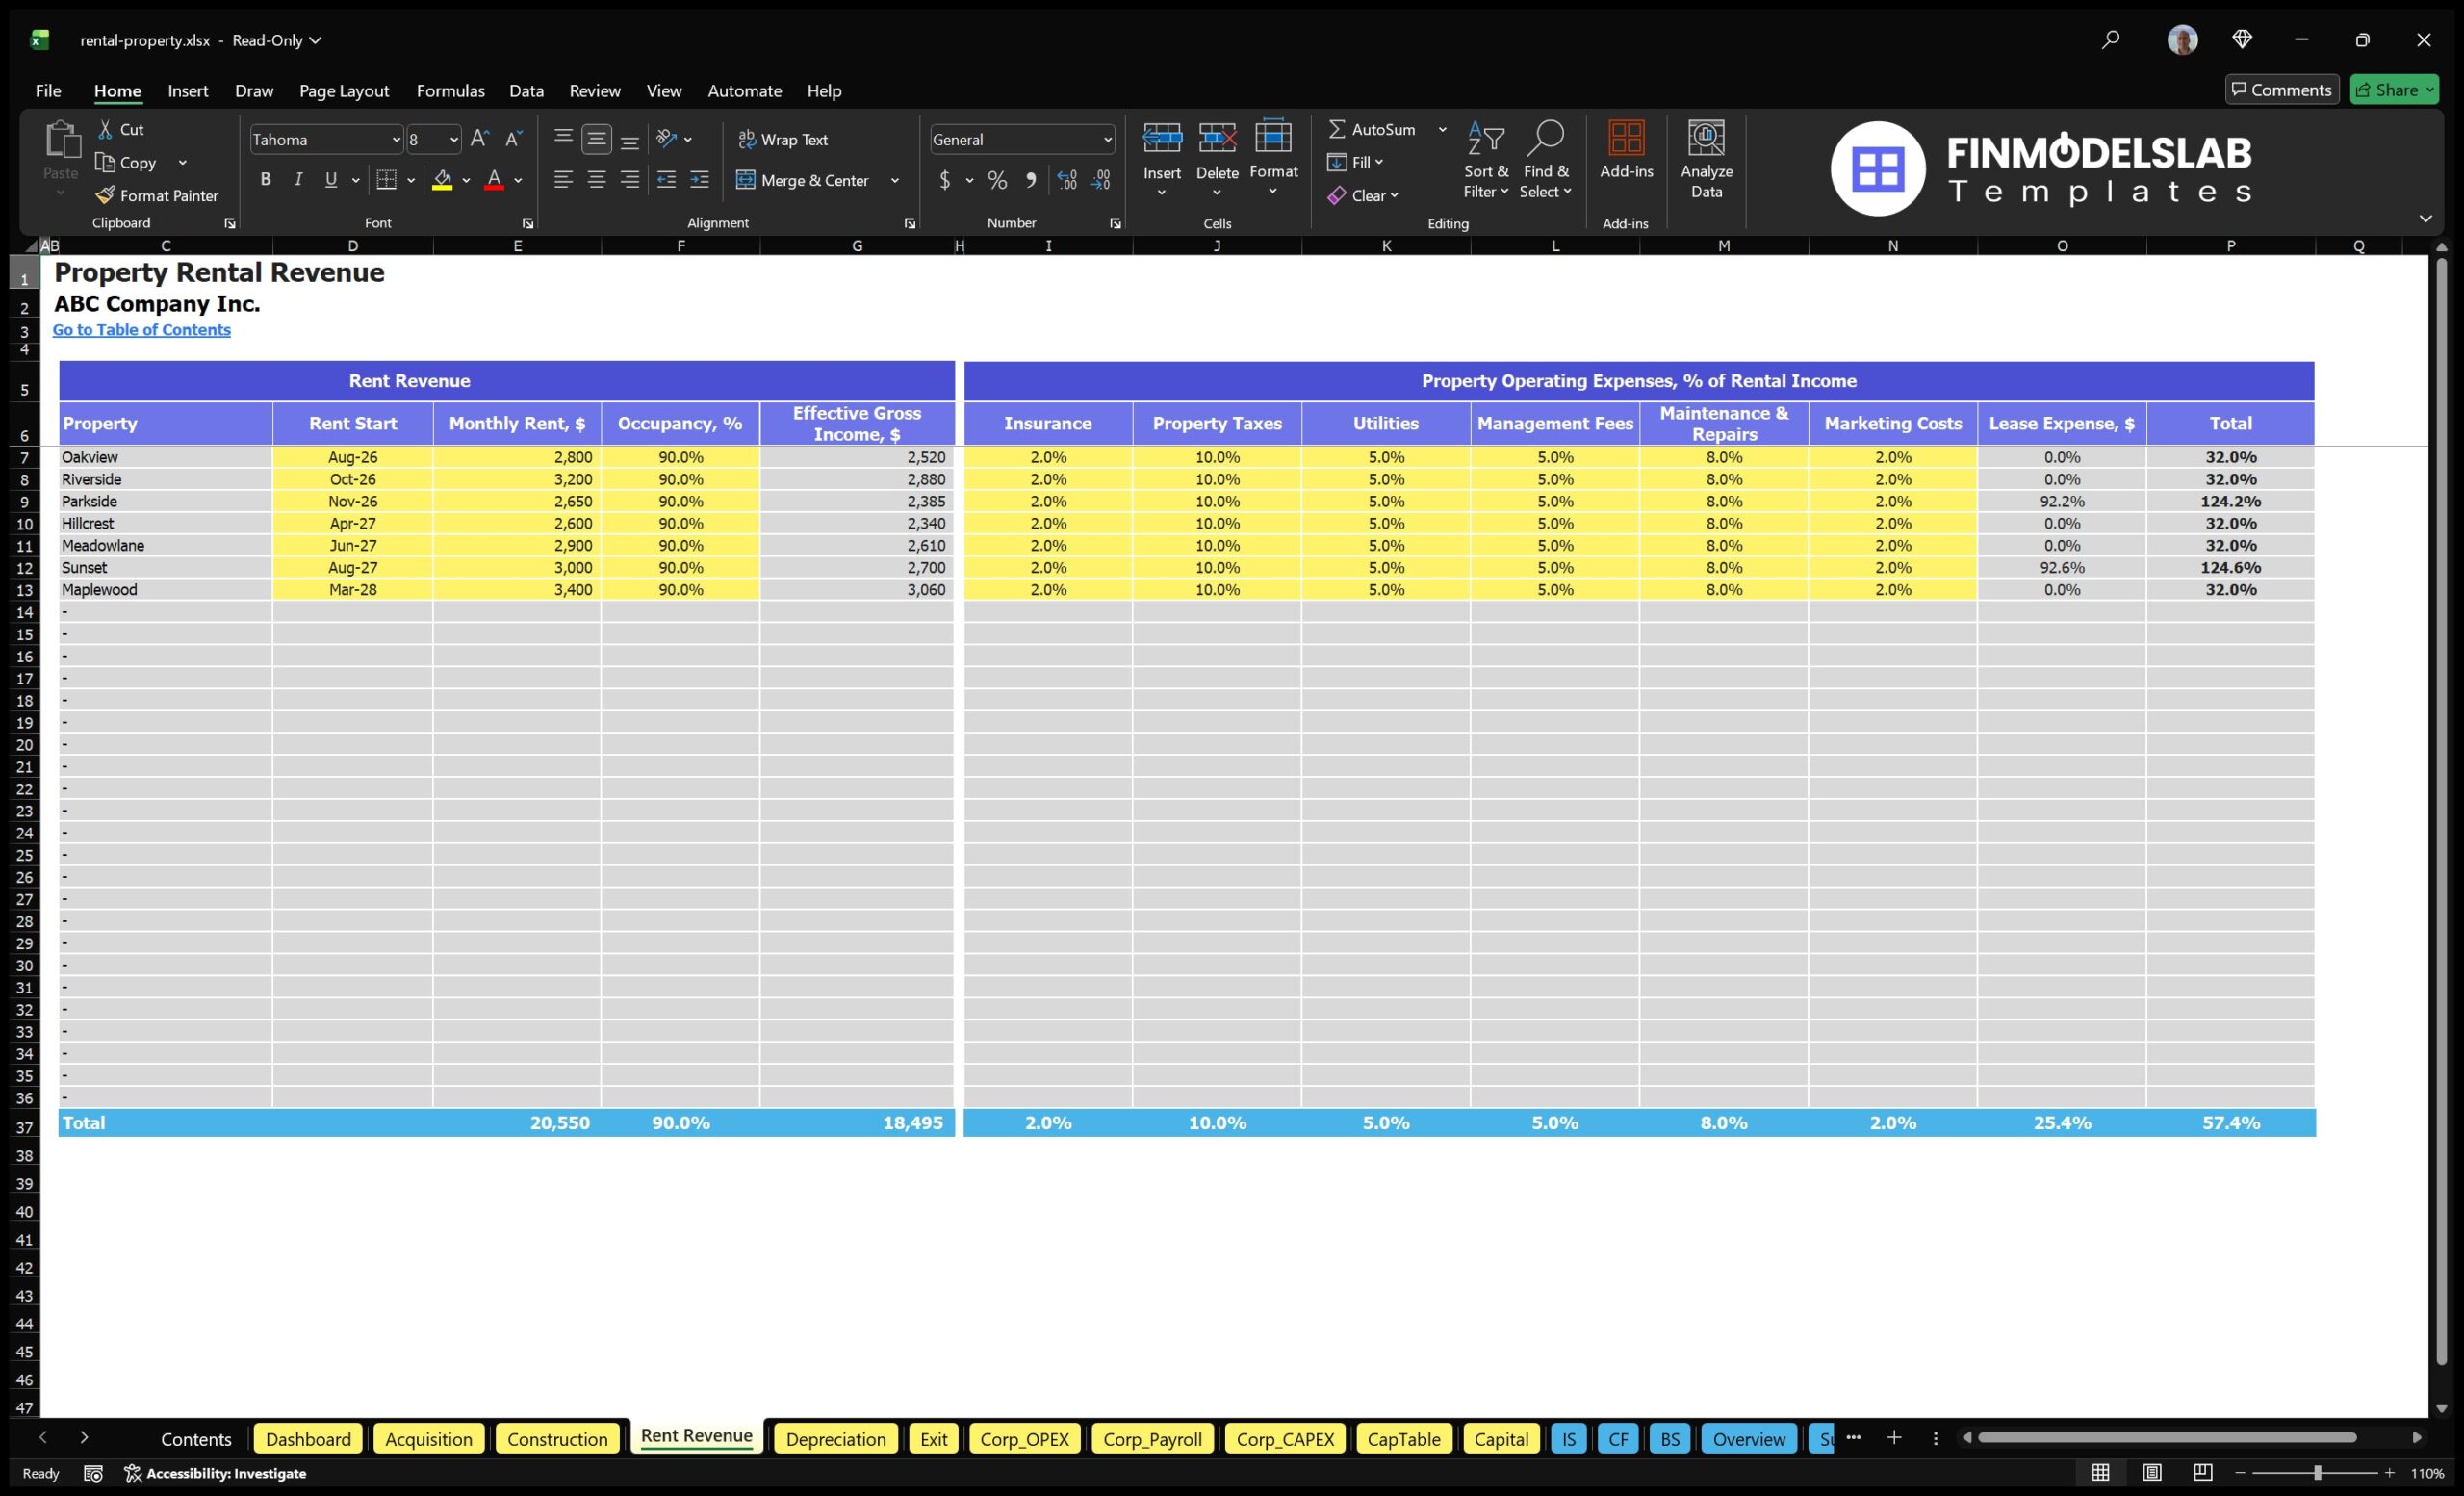
The revenue inputs section is where users define the assumptions that generate rental property income. It may include property-specific monthly rents, acquisition dates, renovation or lease-up timing, occupancy levels, annual rent growth, ancillary income, application fees, late fees, parking, storage, laundry, and proceeds from the eventual sale of the assets. In a portfolio model, users can also reflect a staggered acquisition schedule where different properties begin producing rental income at different times. This is one of the most important components of the Rental Property Financial Model because revenue timing directly affects cash flow, break-even, funding needs, and return calculations. Clear revenue inputs allow users to test whether the planned rent levels are sufficient to support property taxes, insurance, maintenance, management fees, overhead, payroll, and debt service. They also help users compare different leasing strategies, assess the impact of vacancy, and understand how quickly the property or portfolio must stabilize to meet financial goals.
Bank-Ready Reports
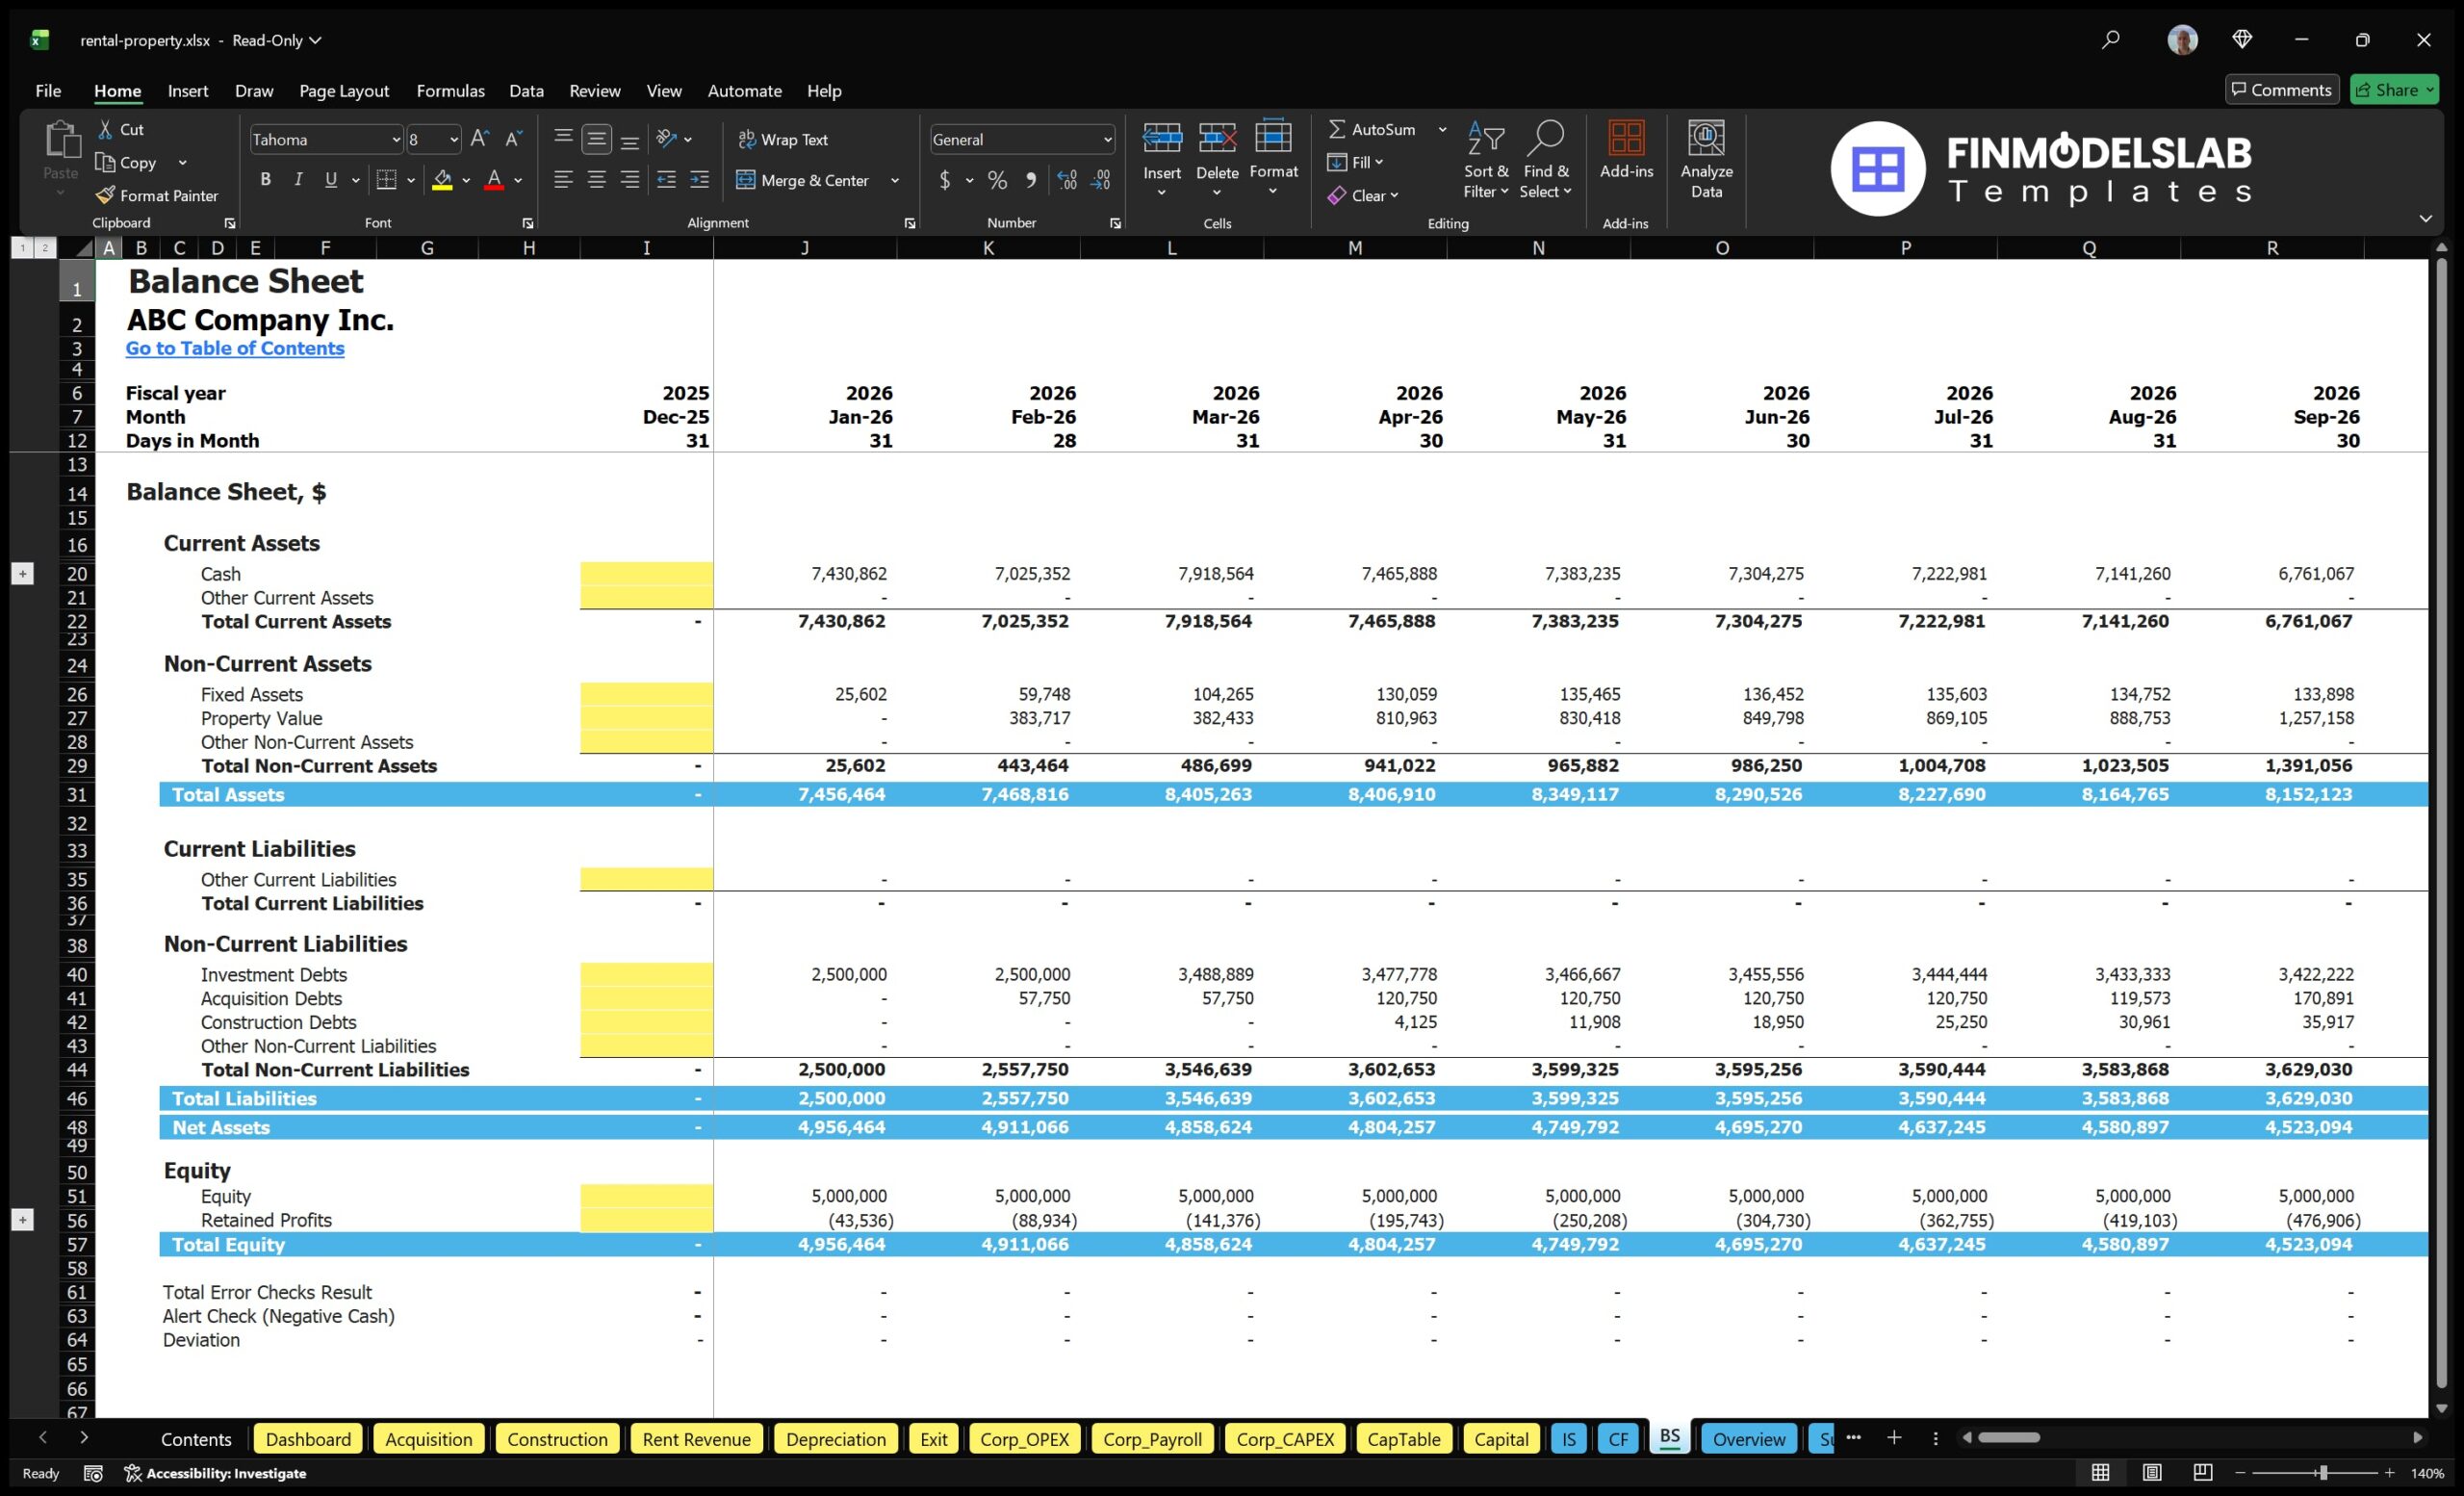
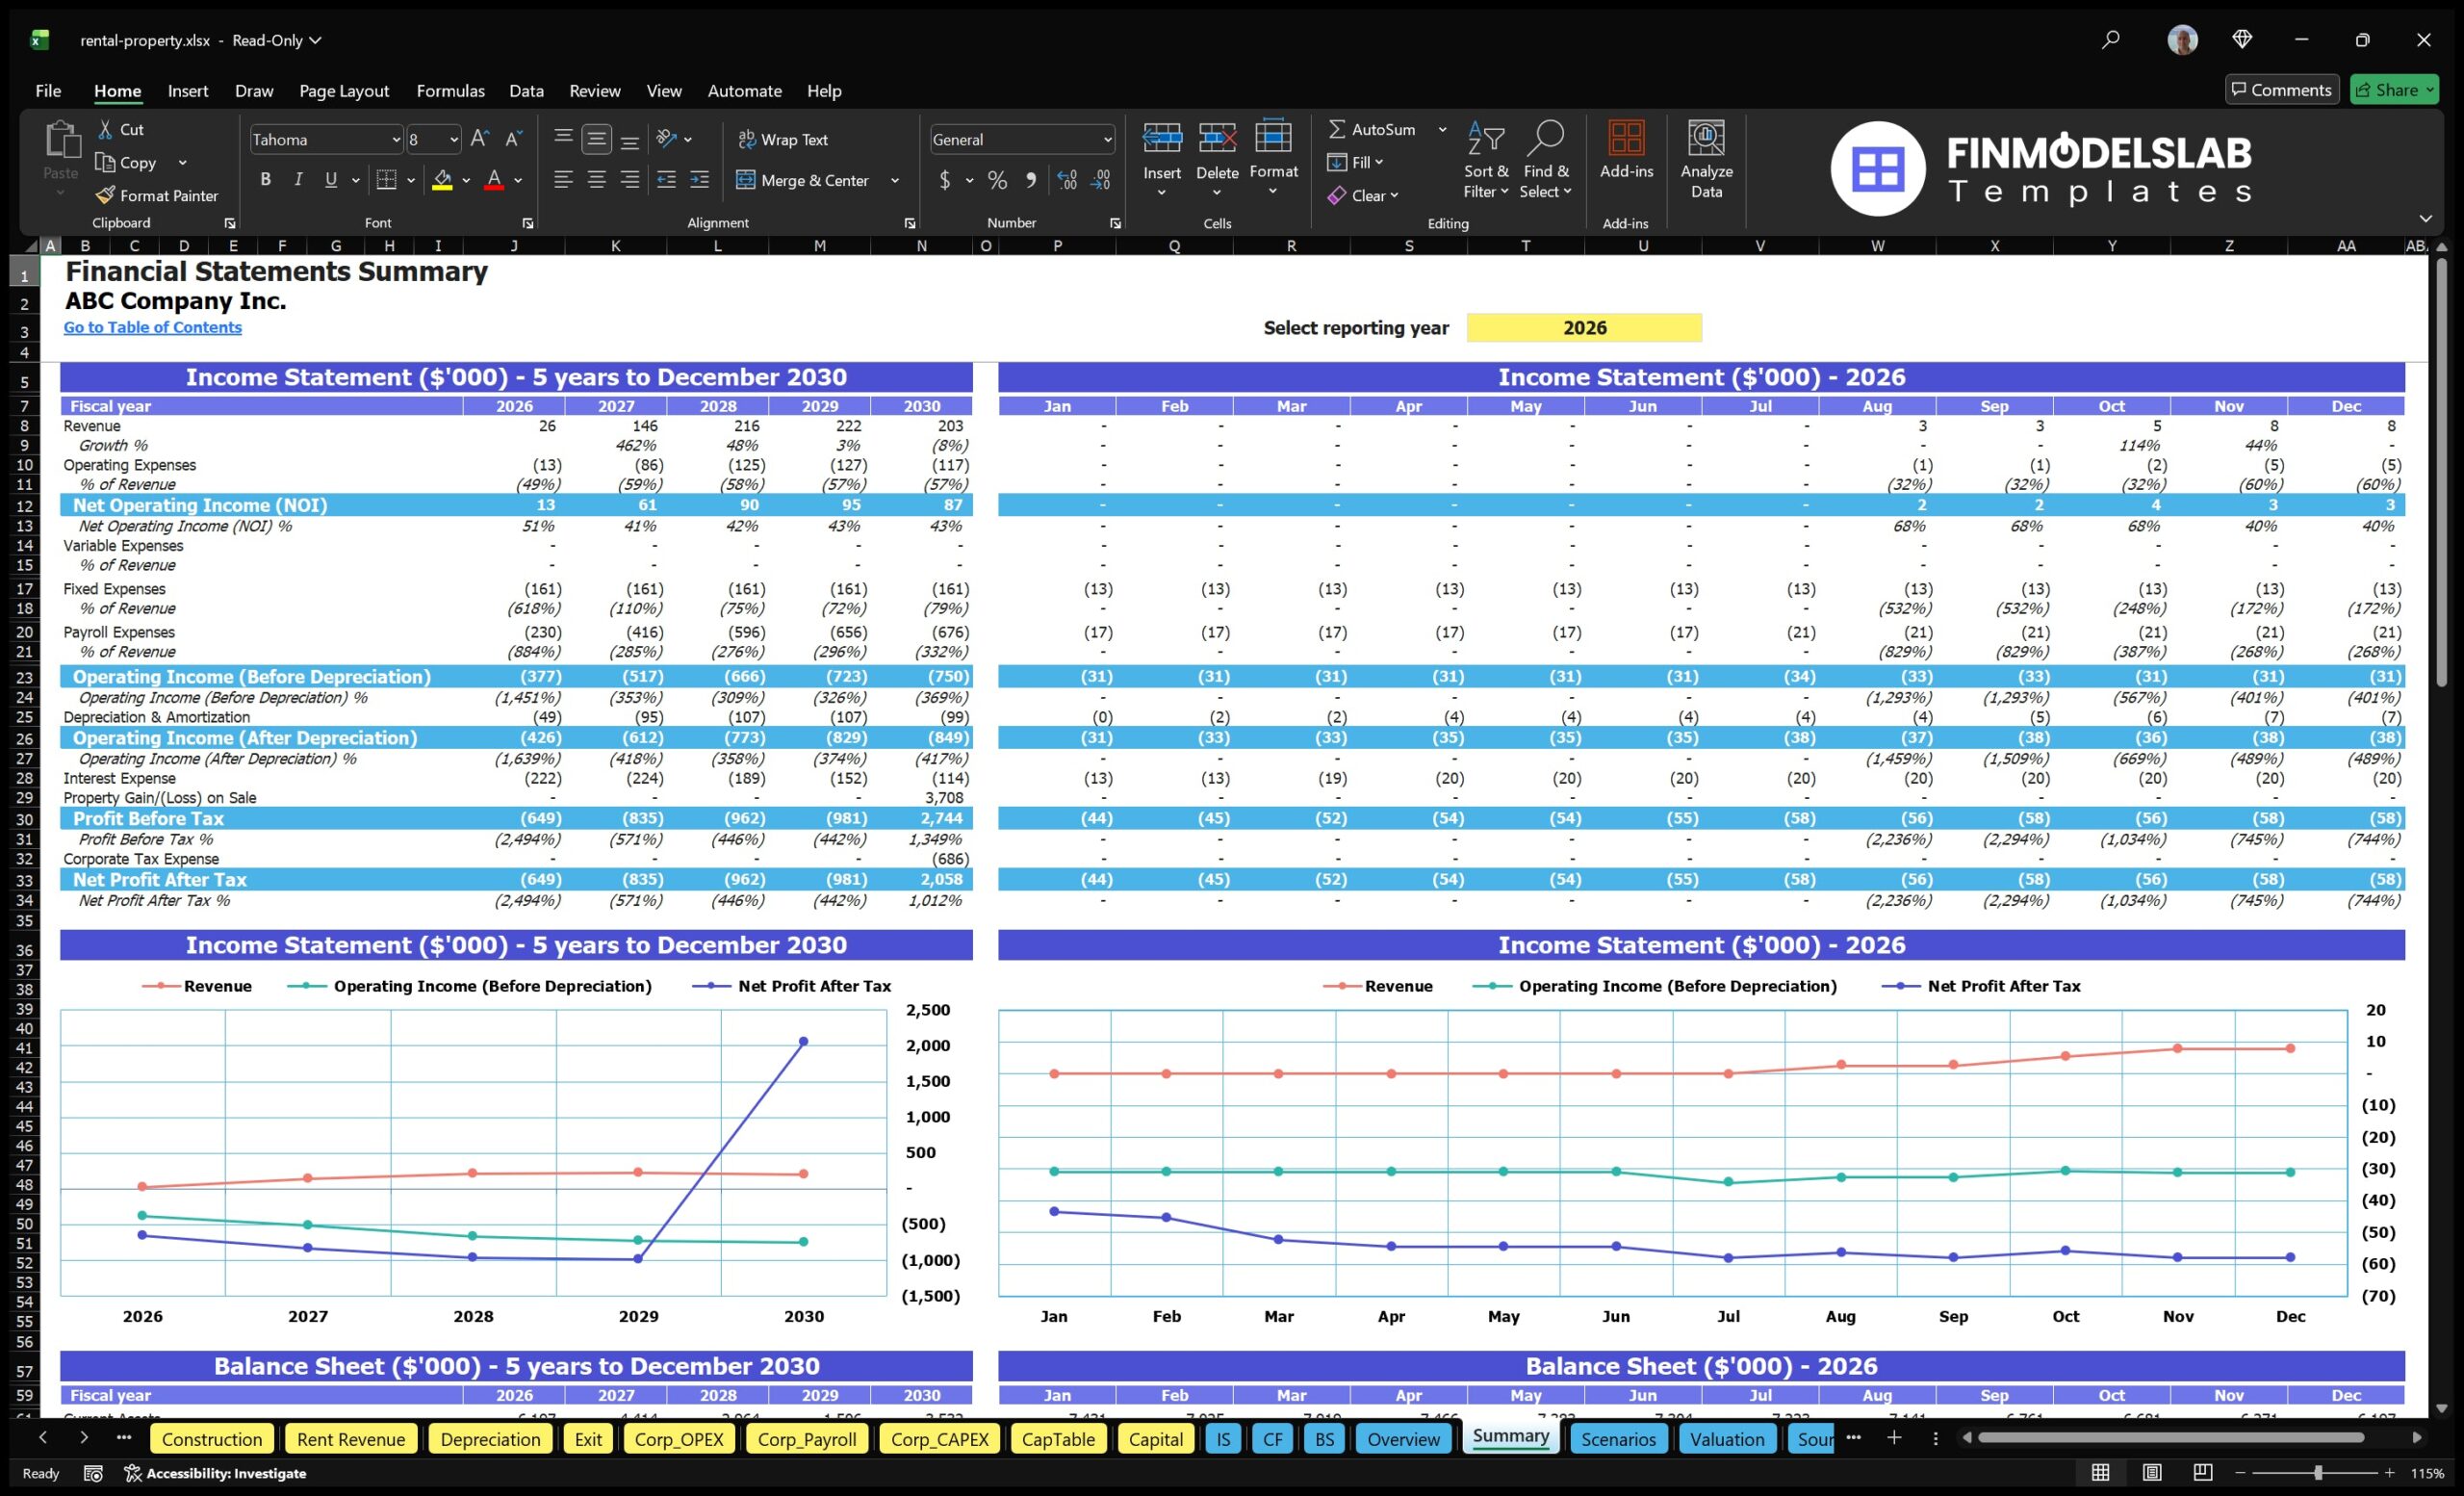
The bank-ready reports section organizes financial outputs into a lender-friendly format that can support loan applications, refinancing discussions, acquisition financing, or working capital requests. Lenders typically want to understand projected income, operating expenses, net operating income, debt service coverage, cash reserves, property-level performance, and the borrower’s ability to handle downside conditions. This component helps users present key financial information in a clean, structured way rather than relying on informal estimates or scattered spreadsheets. It may include summaries of revenue, expenses, EBITDA, cash flow, debt service, balance sheet items, and financing assumptions. For rental property investors, bank-ready reporting is particularly useful because financing terms can shape the entire investment outcome. A professional report package can help users communicate how the project will generate income, how obligations will be paid, how risks are being managed, and why the financing request is supported by a thoughtful financial plan.
Revenue Breakdown
The revenue breakdown section provides a more detailed view of the income streams inside the rental property business. Rather than showing only total revenue, it separates the sources of income so users can understand how much is generated by base rent, other recurring income, one-time tenant fees, ancillary services, and eventual sale proceeds. This is useful because different revenue streams have different levels of reliability, timing, and risk. Base rental income may be the core recurring driver, while parking, laundry, storage, pet fees, or application fees may improve overall yield but should not be treated the same as stable rent. Sale proceeds may create a large cash inflow at exit, but they depend on assumptions about property appreciation, market conditions, and cap rates. By breaking revenue into components, users can identify which assumptions matter most, avoid overstating income quality, and better explain the revenue model to lenders, investors, or business planning stakeholders.
KPI Dashboard
The KPI dashboard section tracks the key performance indicators that matter most in rental property investment analysis. These may include occupancy, rental revenue, net operating income, cash flow, DSCR, IRR, return on equity, cash-on-cash return, equity multiple, payback period, and other property or portfolio-level benchmarks. A KPI dashboard is valuable because it translates a detailed financial forecast into metrics that decision-makers can monitor and compare. For example, an investor may want to know whether the project produces enough net operating income to cover debt service, whether returns justify the equity investment, whether cash flow remains positive after expenses, and whether the hold period supports the desired exit outcome. This component also helps users compare the model against industry benchmarks or internal investment criteria. By keeping the most important metrics visible, the template supports faster review, better communication, and more disciplined financial decision-making.
Startup, CapEx, and Operating Expense Planning
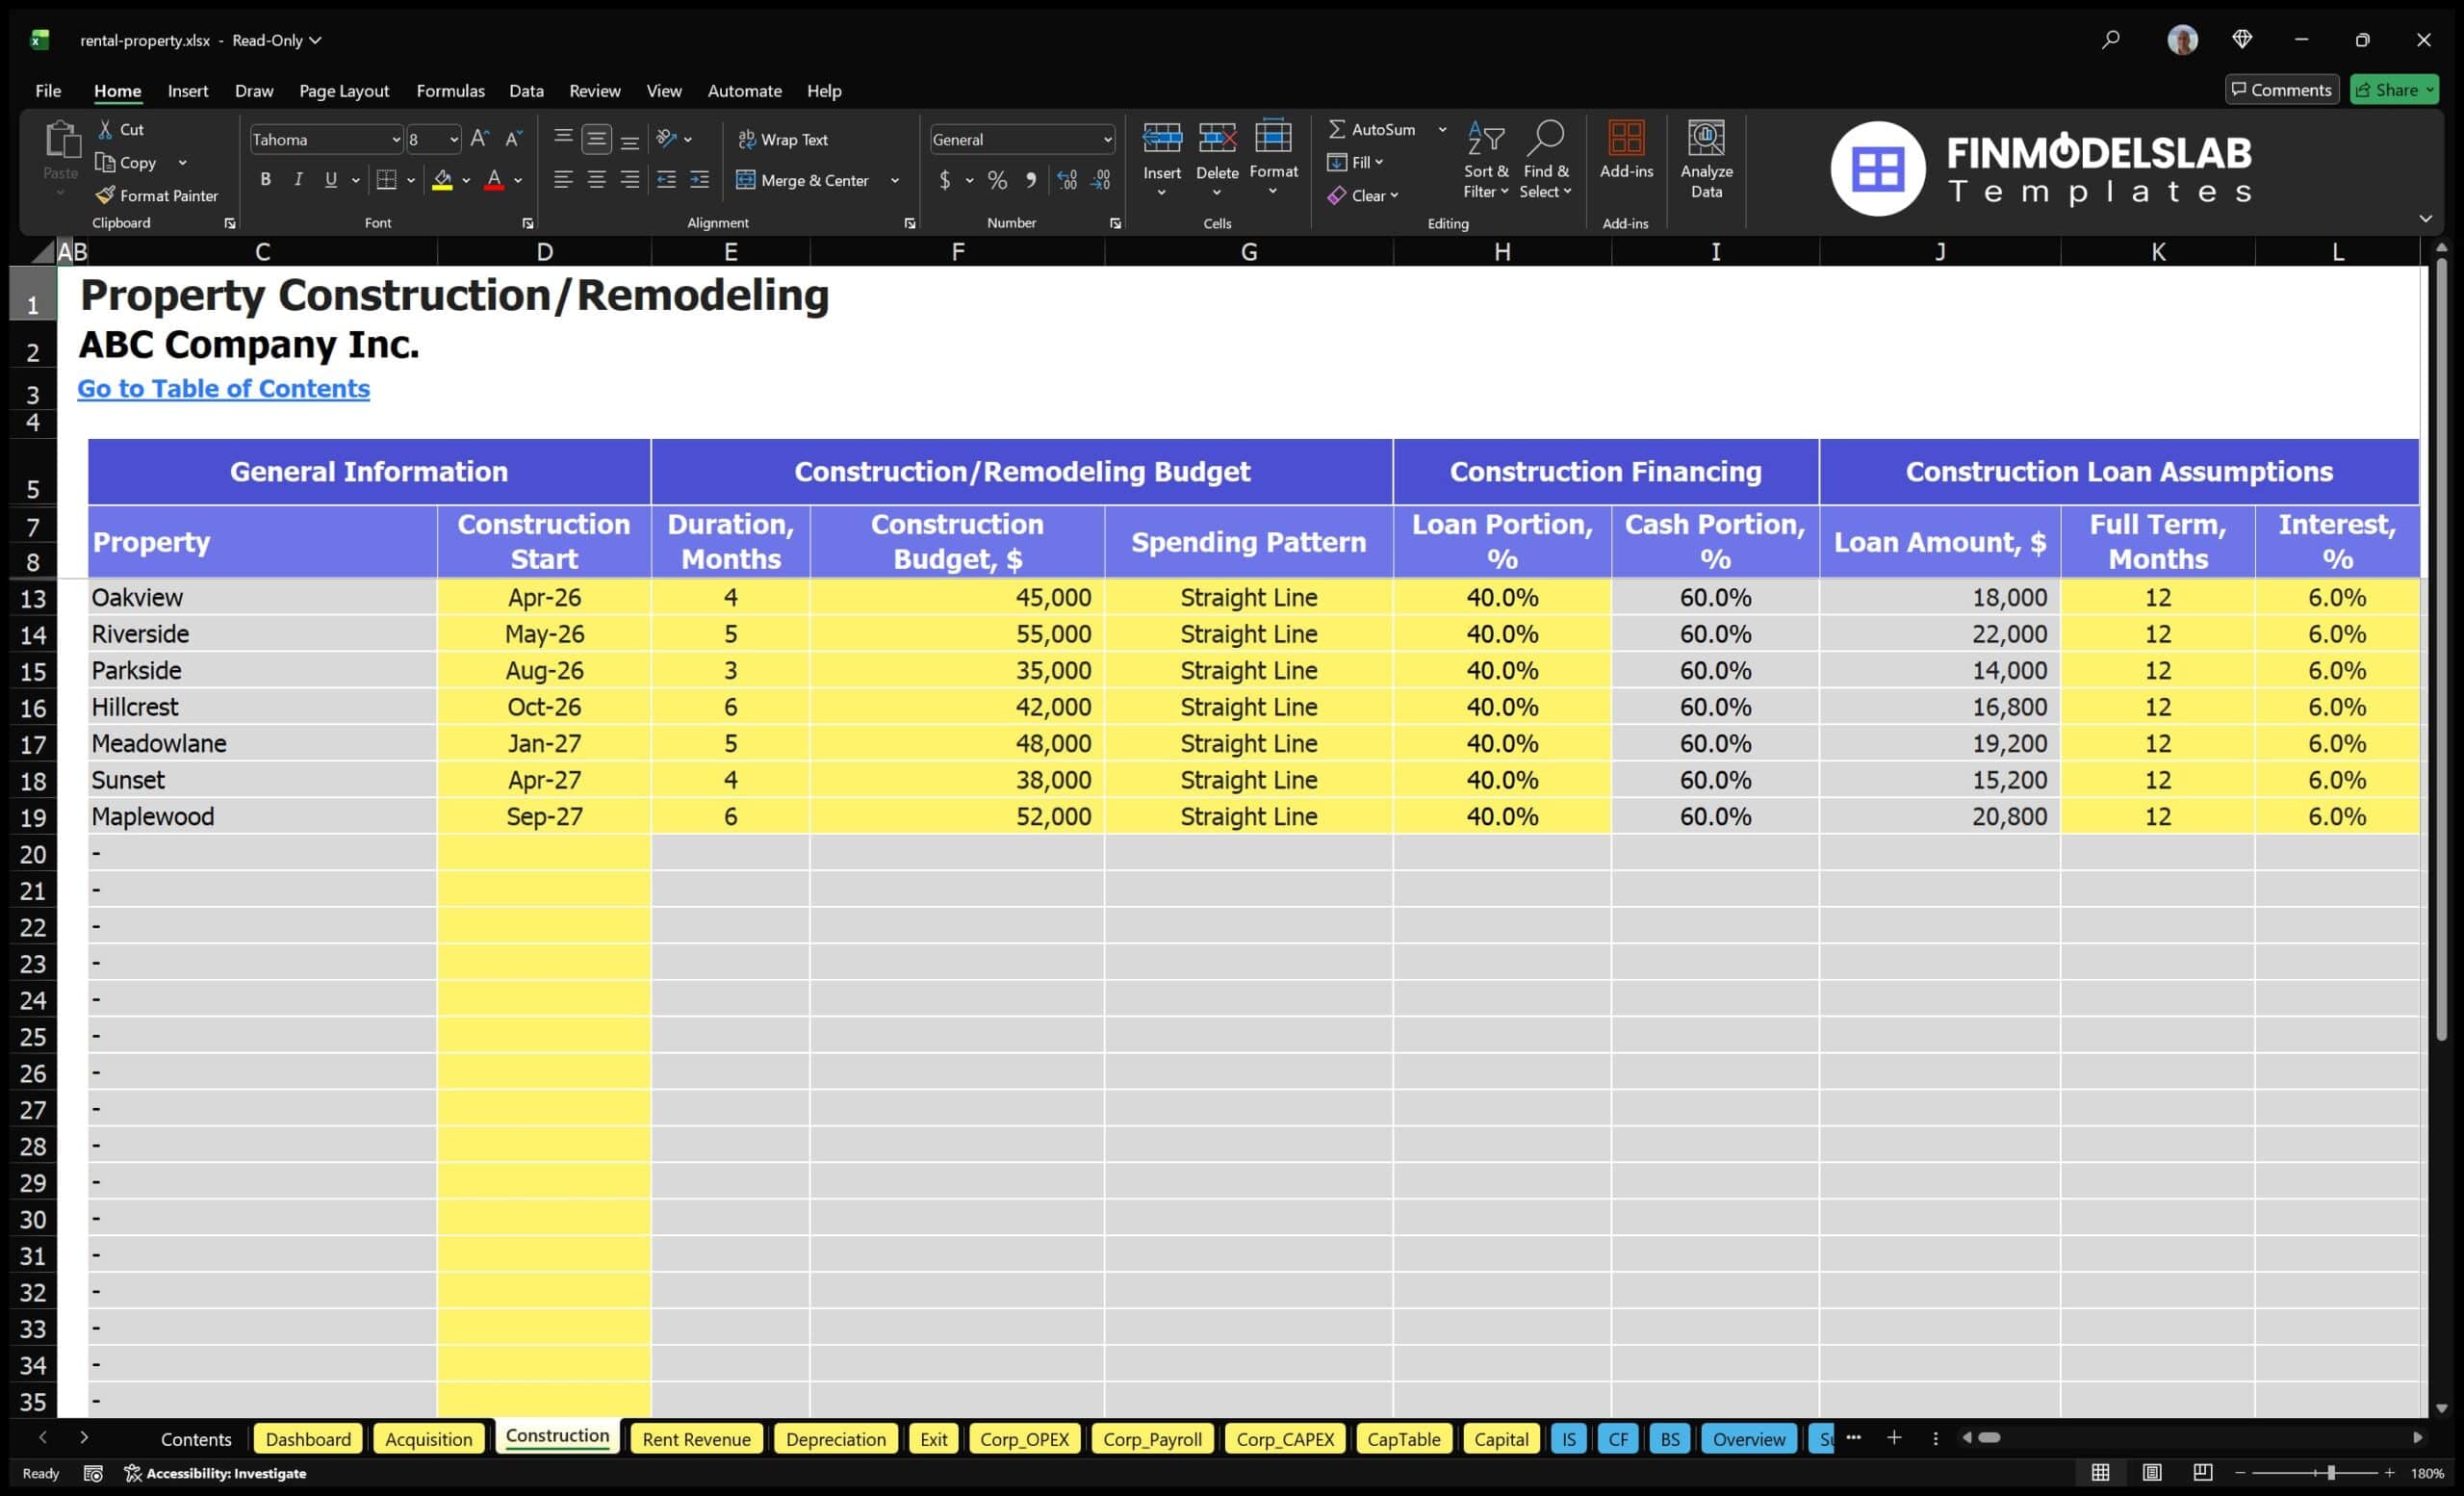
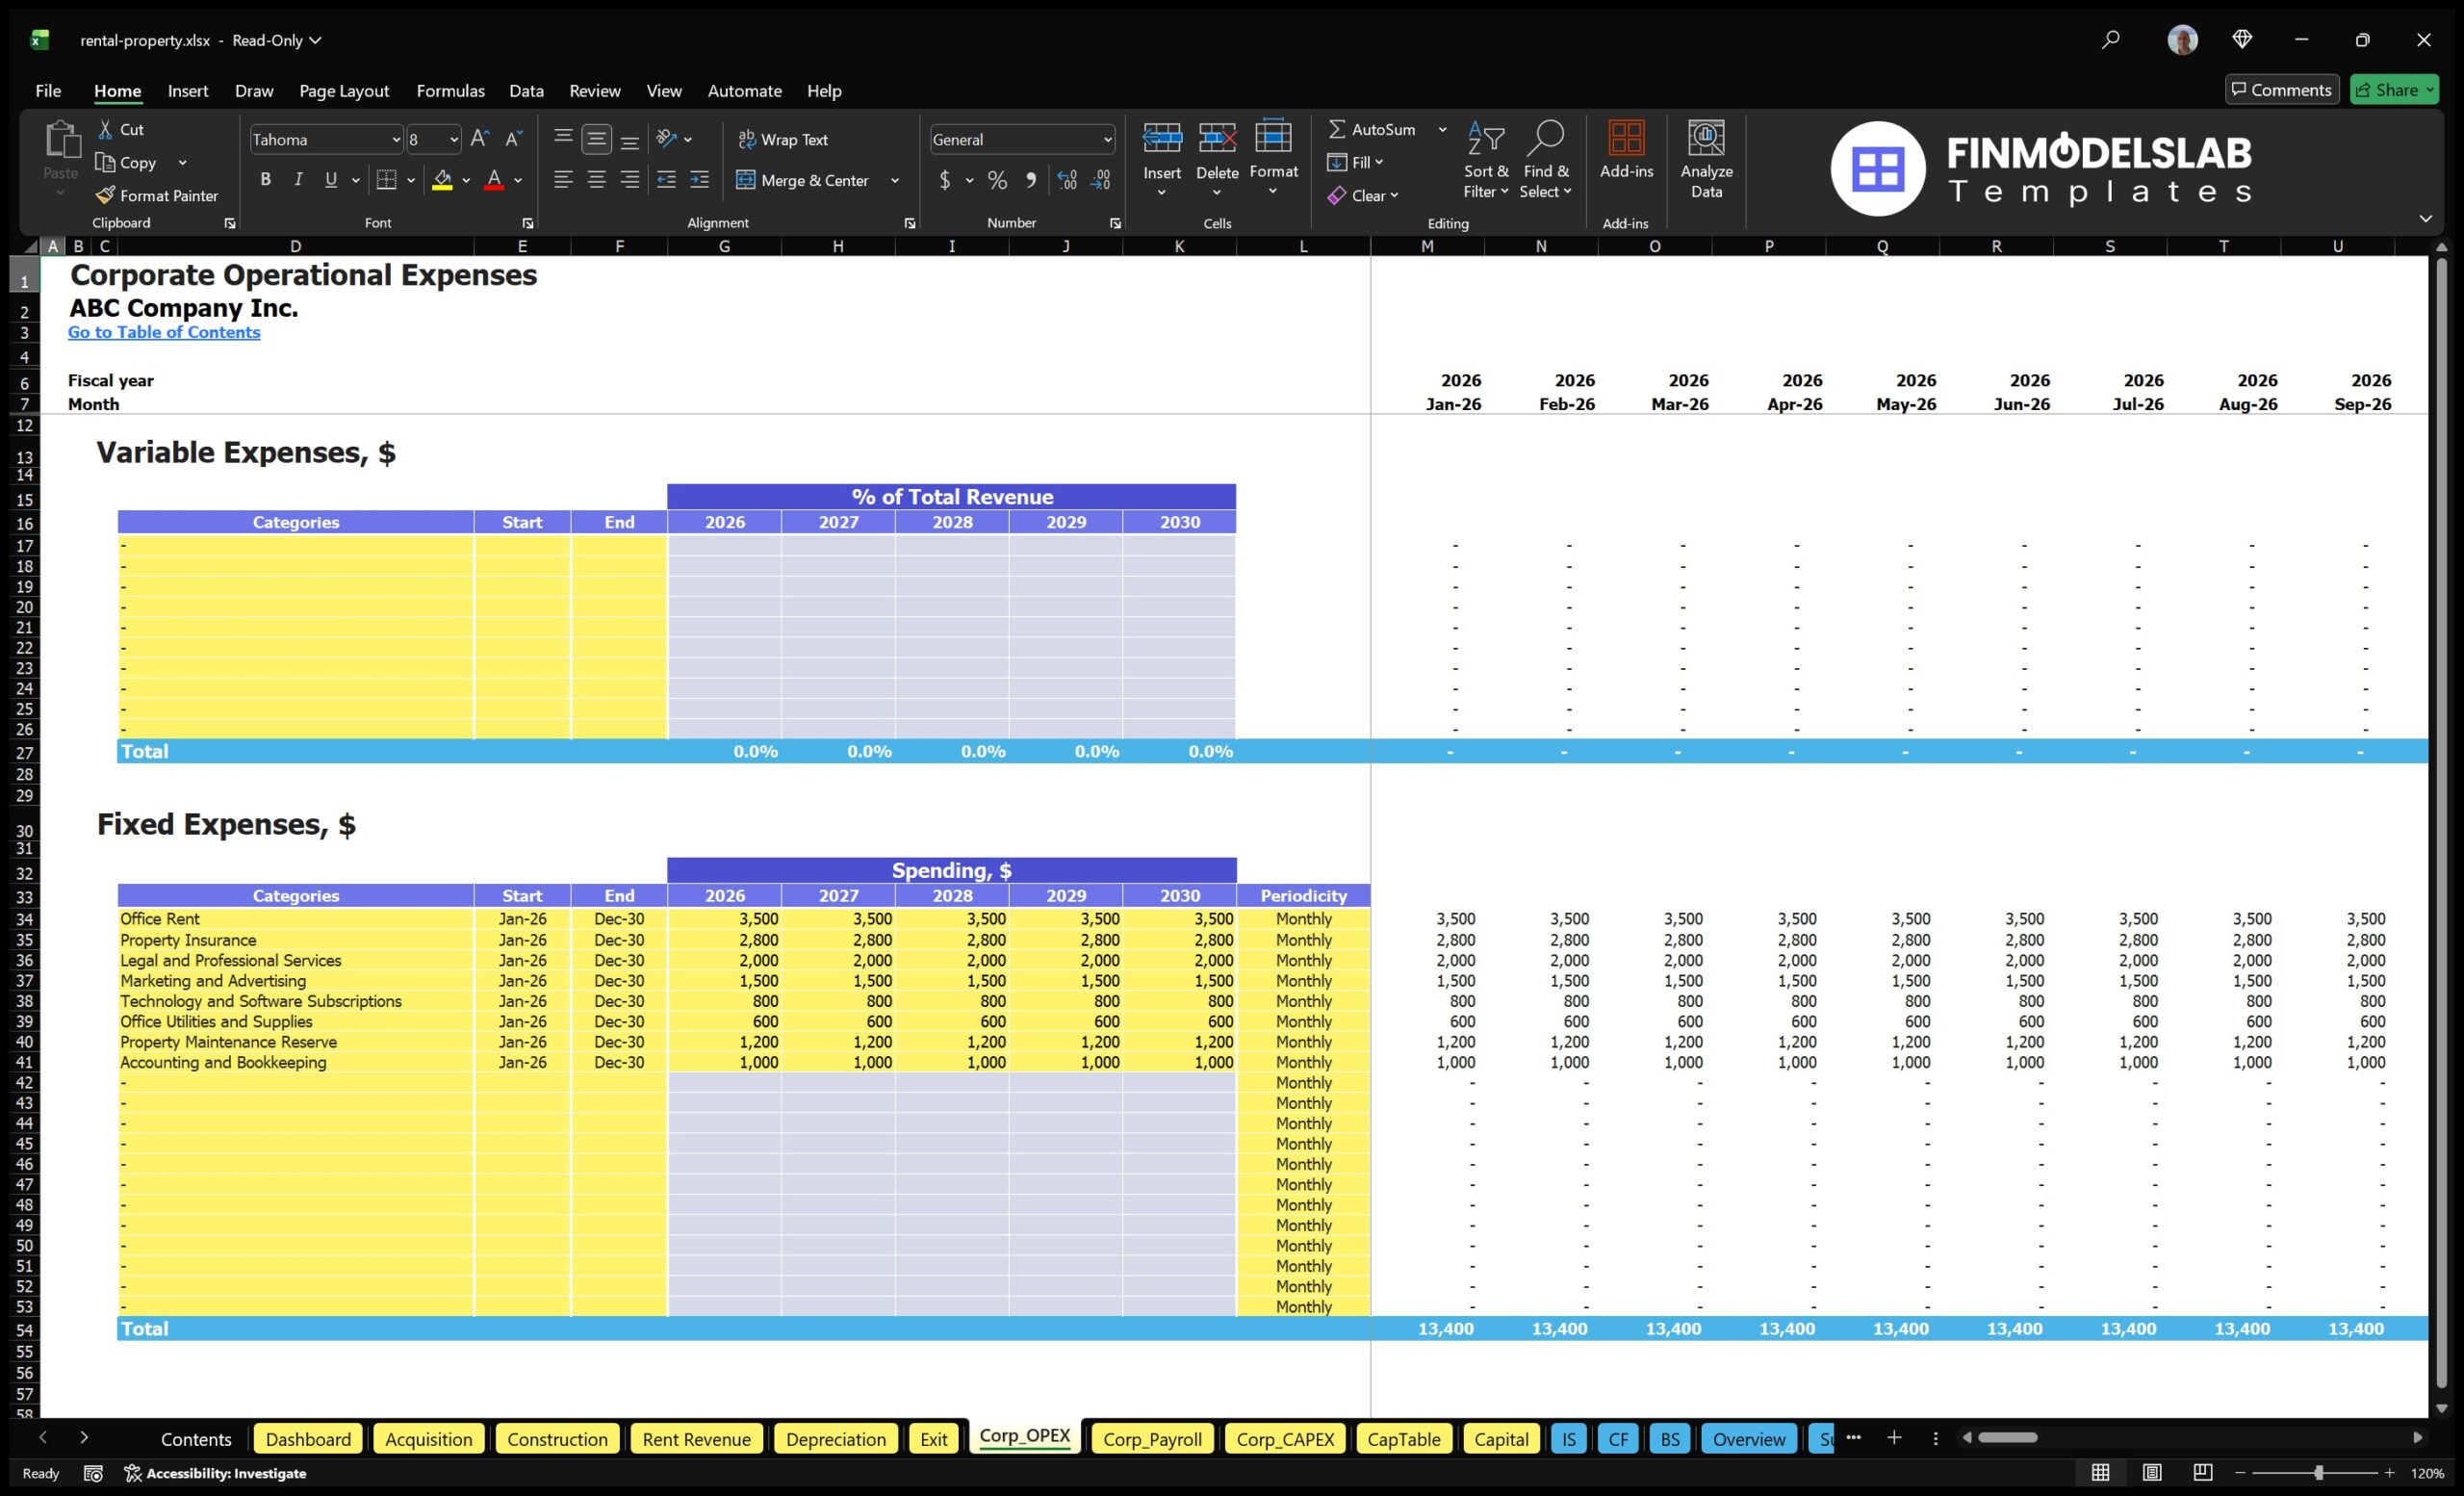
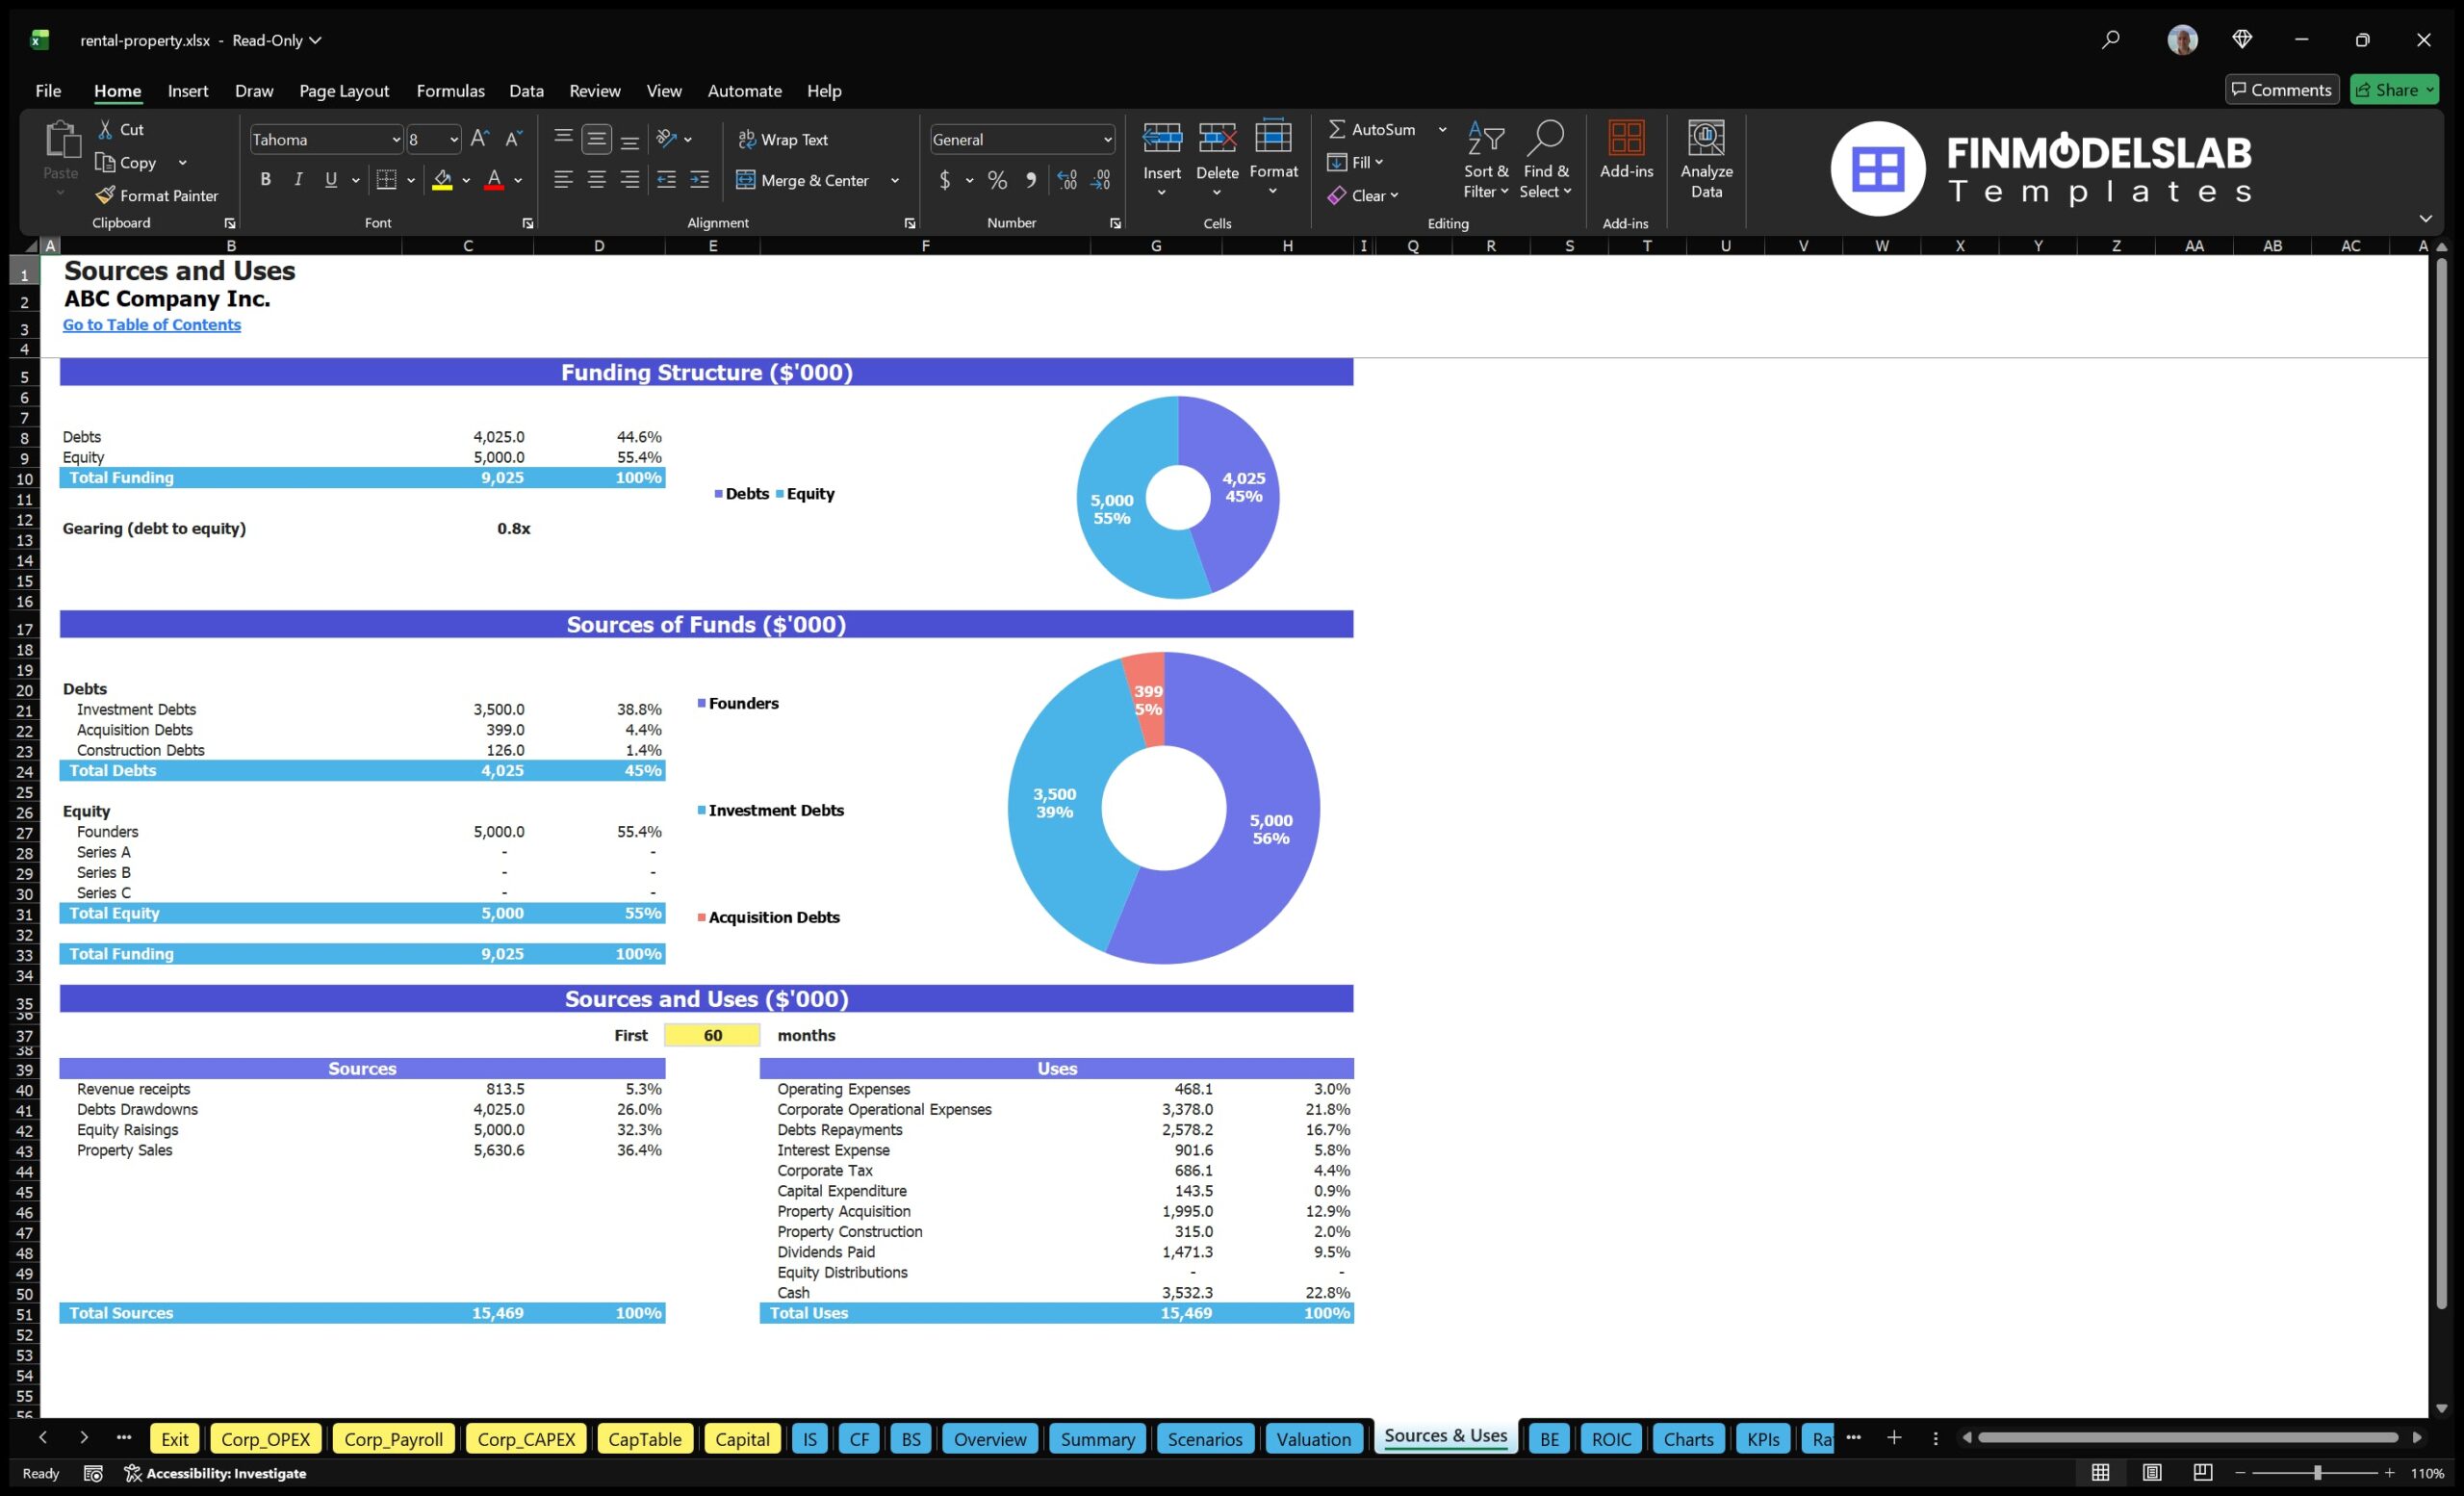
The startup, CapEx, and operating expense planning section helps users estimate the full cost structure required to launch and operate the rental property business. Startup and capital expenditure inputs may include property acquisition costs, down payments, closing costs, renovations, repairs, furniture, technology systems, office setup, legal fees, licensing, initial marketing, and working capital reserves. Ongoing operating expenses may include property taxes, insurance, maintenance, utilities, property management, payroll, administrative costs, software, accounting, legal support, marketing, and repairs. This component is essential because rental property models can look attractive on revenue alone while underestimating the true capital required to acquire, improve, and manage the assets. By separating one-time costs from recurring expenses, the template helps users understand launch funding, monthly burn, cost control opportunities, and the level of rental income needed to support operations. It also supports more accurate budgeting, lender discussions, and investor capital planning.
Break-Even and Funding Requirement Analysis
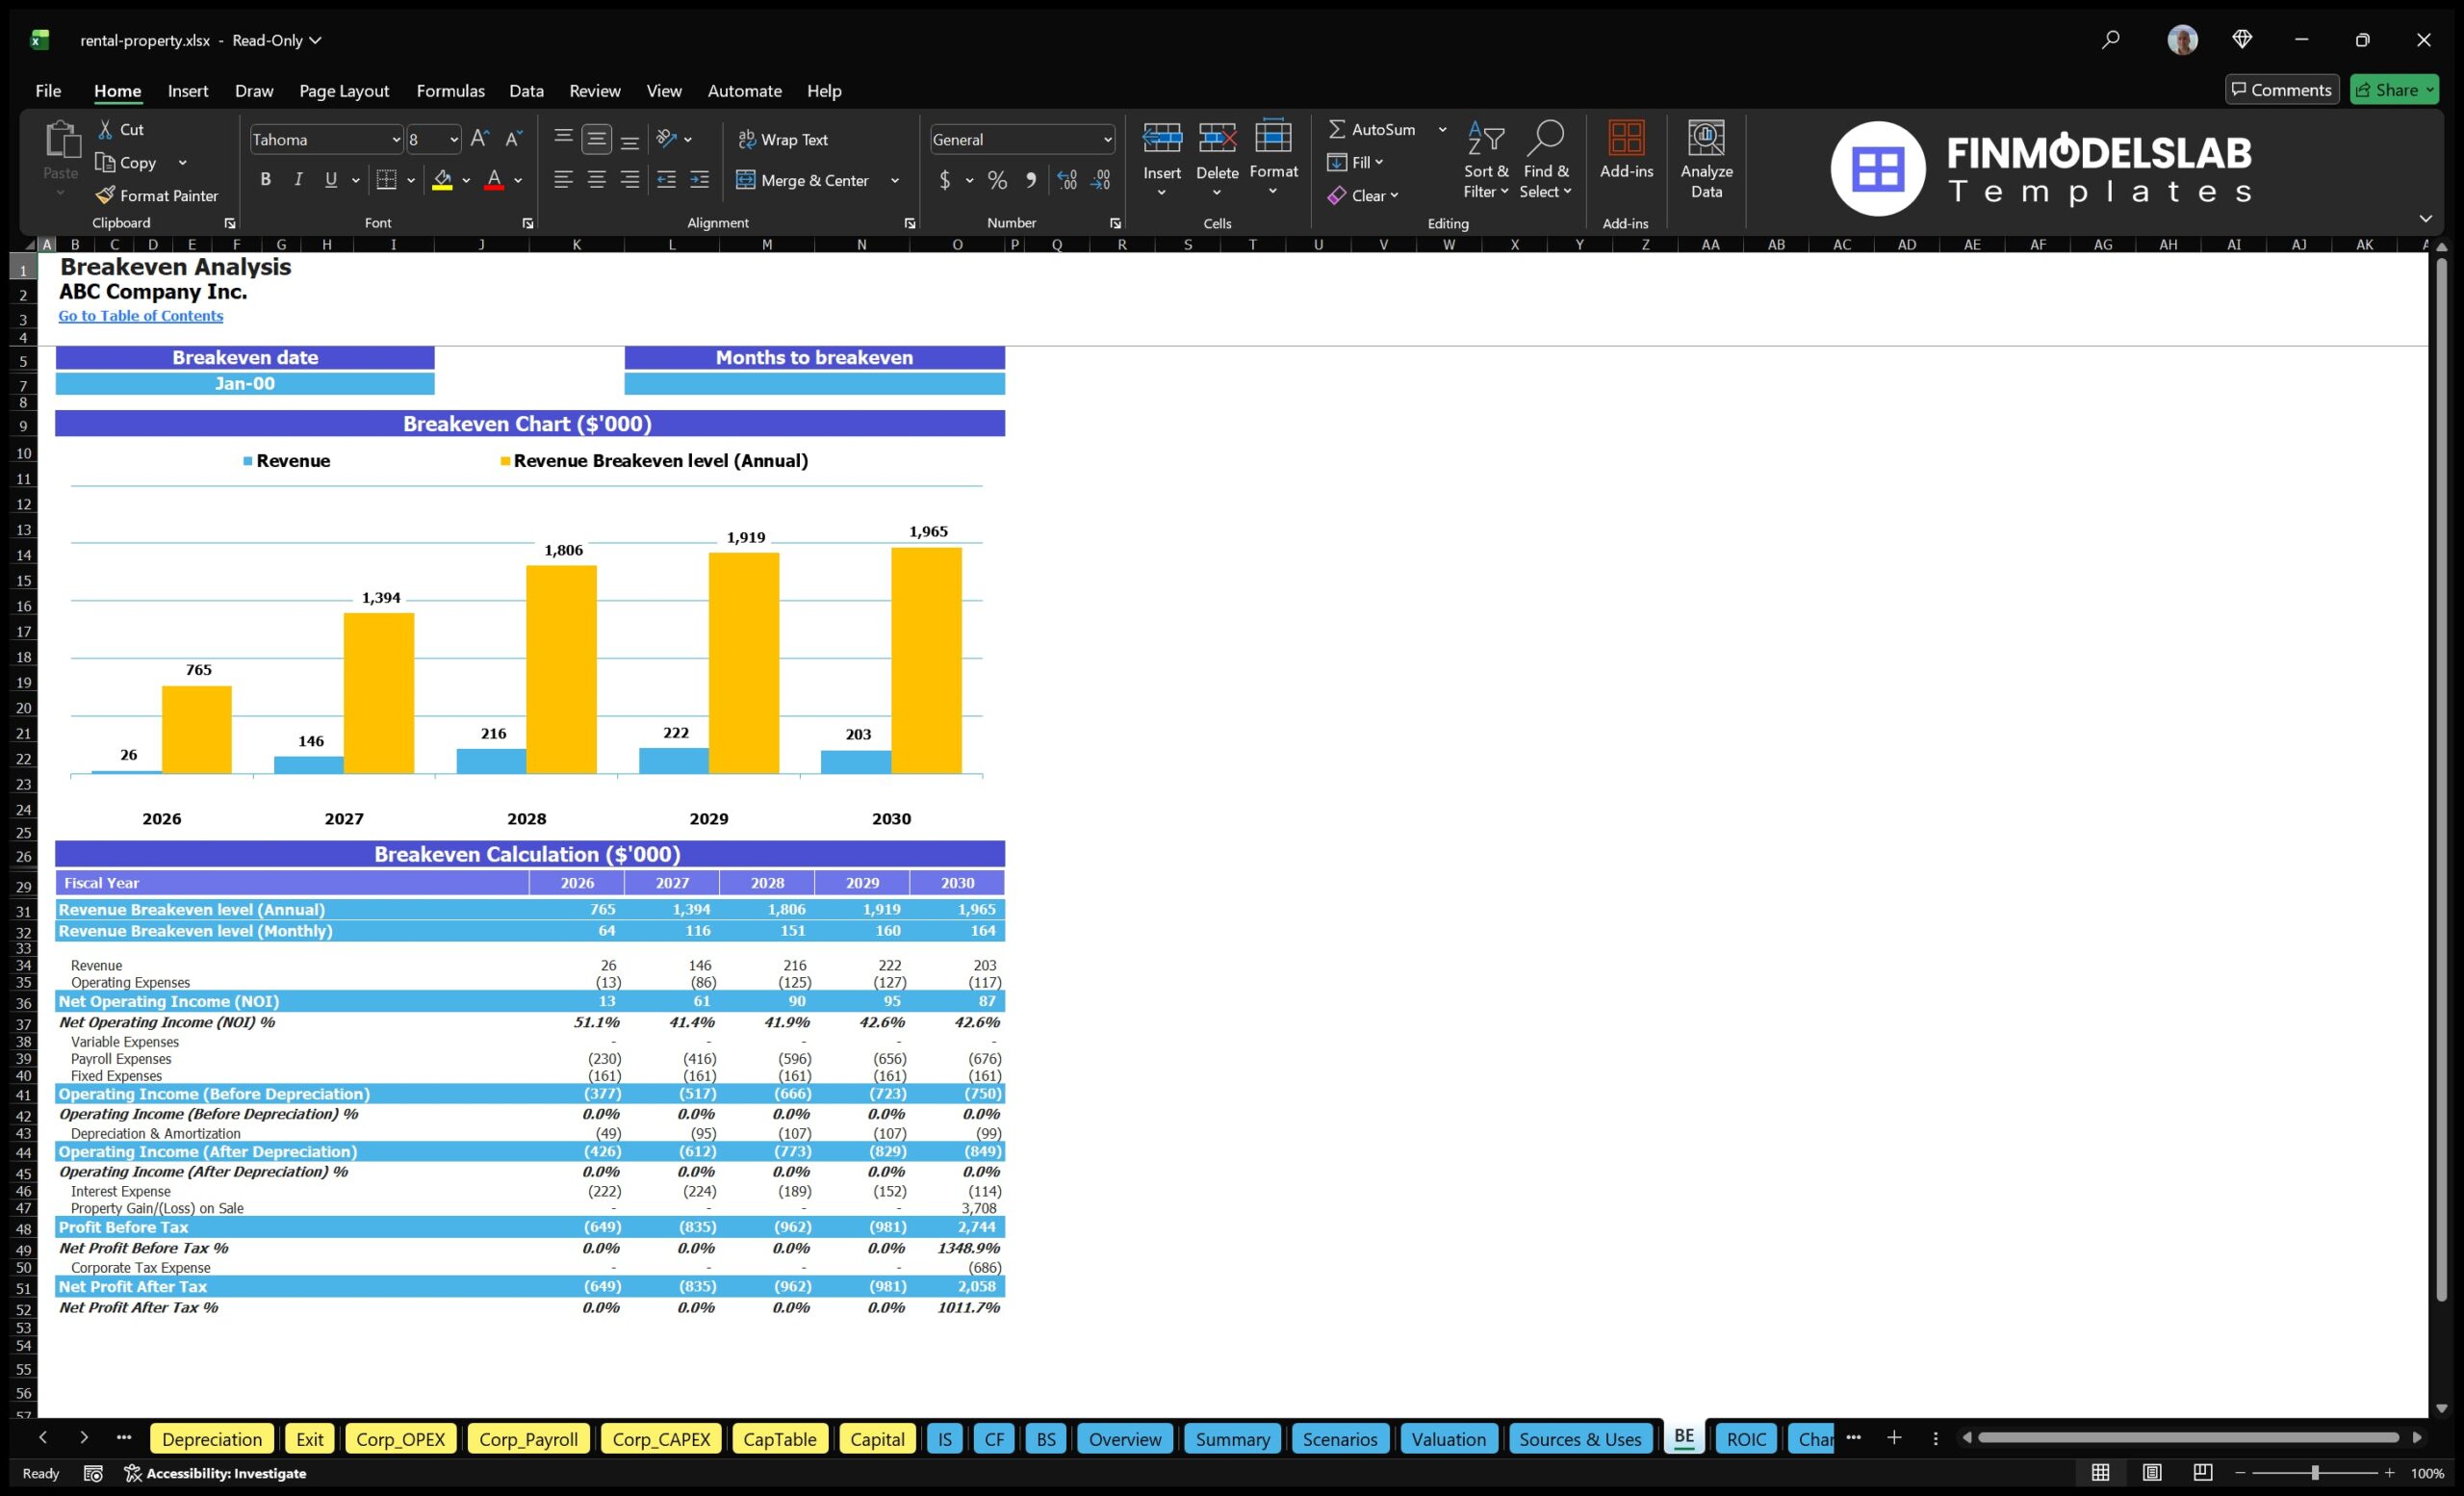
The break-even and funding requirement analysis section helps users identify when cumulative revenue may cover cumulative costs and how much capital may be needed before that point is reached. For rental property ventures, break-even is not only a profitability milestone but also a cash planning tool, because acquisition costs, renovation spending, operating overhead, and debt service may occur before the portfolio is fully leased and stabilized. This component can use assumptions such as acquisition timing, rent start dates, occupancy, operating expenses, payroll, debt payments, reserves, and exit proceeds to estimate the break-even timeline and the minimum cash balance during the forecast period. It helps users determine whether they need owner equity, investor funding, a line of credit, construction financing, or additional reserves. This is particularly useful for decision-making because it shows whether the project can survive the early cash-intensive period and what actions may accelerate break-even, such as faster renovations, stronger leasing, improved rent pricing, reduced vacancy, or better financing terms.
File types:
Excel – Single-User: .xlsx
Excel – Multi-User: .xlsx
Similar ProductsOther customers were also interested in...



 eFinancialModels
Real Estate Financial Model Templates Package
This is a collection of ready-made Excel financial model templates for real estate businesses and it... Read more

 Giorgos
Real Estate Acquisition Financial Model (Commercia...
10-Year financial model for a real estate acquisition projecting revenue, operating expenses, and ca... Read more
Real Estate Development Financial Models Bundle
A collection of seven Real Estate Development Financial Models offered at a discounted price you can... Read more
Prefabricated Buildings Manufacturer – 10 Ye...
Financial model presenting a development scenario of a Prefabricated Buildings Factory including con... Read more

Real Estate Acquisition Financial Models Bundle
A collection of six Real Estate Development Financial Models offered at a discounted price you can�... Read more

 Andreas
Real Estate Portfolio Dashboard Model
Real Estate Portfolio Dashboard model presents a series of dashboards that will allow the user to ch... Read more
 JILL LIU
Real Estate Private Equity – REPE Financial ...
This Template is to provide users a ready to use tool of Real estate private equity valuation and wa... Read more
 HenrySheykin
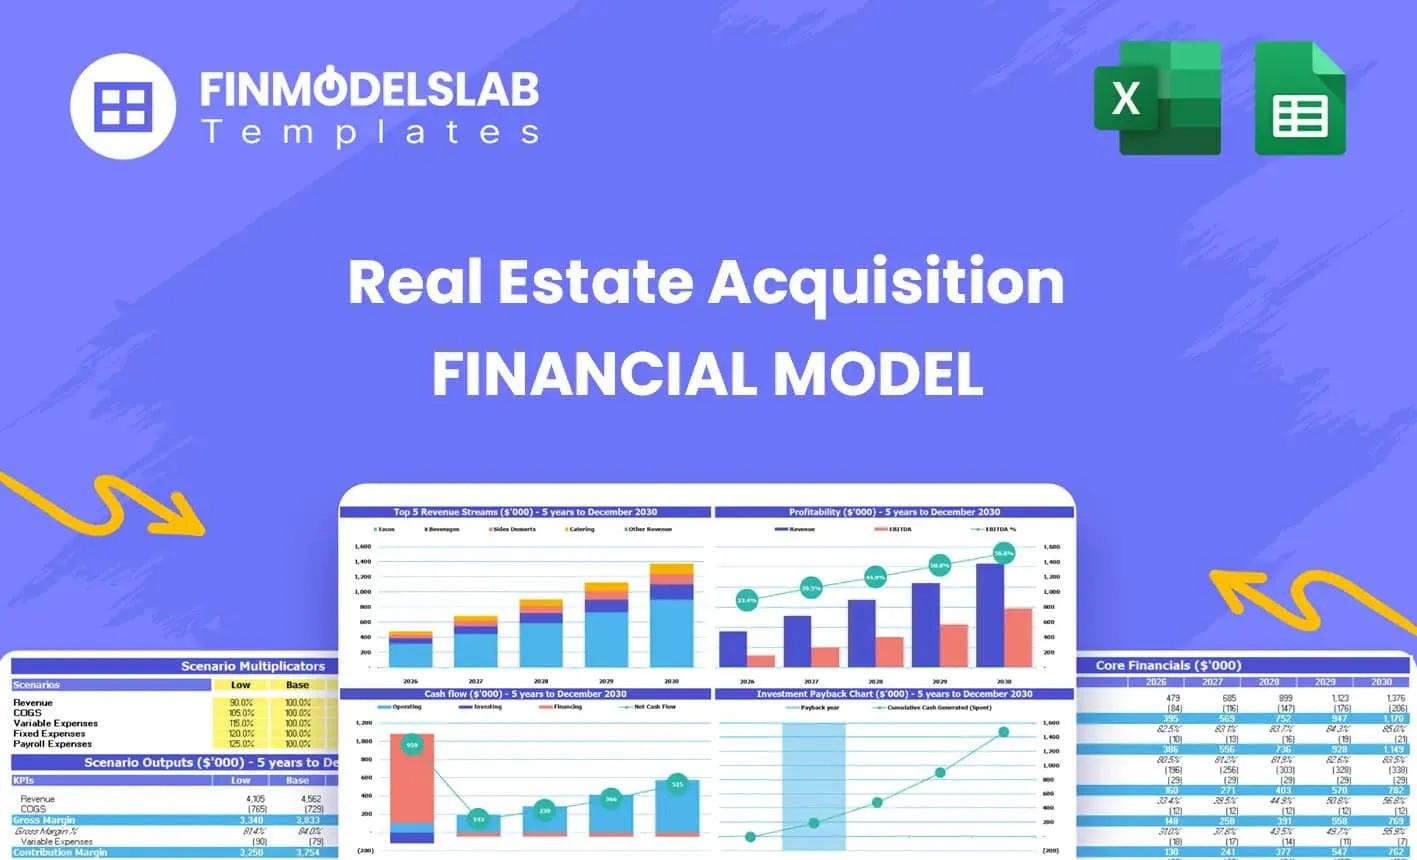
Office Acquisition REFM Financial Model Excel Temp...
The Real Estate Acquisition Financial Model Financial Model Template helps investors, developers, an... Read more
You must log in to submit a review.