Real Estate Brokerage Economic Analysis
Create up to a 10 year financial forecast for a real estate brokerage operator. Includes three way model, DCF Analysis, IRR, and more.

Video Overview:
This is a bottom-up dynamic financial model to create various feasibility studies for a real estate brokerage business. The model was built to scale for 100s or 1000s of agents and deals over time. The user can define how many deals are completed by the brokerage per month and the growth therein in over 10 years, how many of those deals are buy-side vs. sell-side, and more.
There are two configuration modules for deal types. This was done to give flexibility and account for the deals agents do vs. deals the firm/partners do, or it could be used to model two different types of deals over time that both have agents.
There are all sorts of strategies in this space. Your brokerage may offer agents 90% commissions if they want to scale high-quality individuals to sell, or you could drive growth from lower-quality agents but earn a higher share of the commissions. Either option can be modeled to see what is most feasible for your goals.
For each deal type, the user can define how many of the deals are sell-side vs. buy-side, what the commission on the entire deal is, how much commission the brokerage earns and what percentage of that commission is split with the agents.
Variable costs can be defined in a few ways. First, there is a section for each deal type to define the average monthly cost per agent per month. This would be to cover things like transaction software and marketing for the agents. Secondly, there is a catch-all cost that is driven off a defined percentage of revenue.
For fixed expenses of the brokerage (such as licenses / accounting / rent and other operating expenses), the user can define the start date of each expense, the monthly amount over 10 years, and the expense description. There are plenty of slots for data entry regarding these line items.
Final Output Reports:
– Monthly and Annual Financial Statements (Income Statement, Balance Sheet, Cash Flow Statement)
– Annual Executive Summary with key financial line items, cash flow, IRR, ROI, Equity Multiple
– DCF Analysis for the project, and there is an option to have investors / joint venture structures or solely owner operated
– 10 Visualizations of KPIs and financial expectations based on the defined assumptions
– Monthly and Annual Pro Forma detail where the user can see how all the assumptions come together and flow to EBITDA / cash flow
Similar Products
Other customers were also interested in...
Multi Sports Complex Financial Model – Dynam...
Financial Model presenting a development and operating scenario of an Indoor Multi-Sports & Fitn... Read more
Mixed-Use Real Estate Model: Leverage / JV Options
A general real estate model to plan all assumptions for up to 7 'uses' for a given property. Include... Read more
Real Estate Financial Model Bundle
This is a collection of financial model templates that provides the financial projections and valuat... Read more
Investment Fund Preferred Return Tracker: Up to 30...
Track preferred returns for investors in a fund with this template. Premium joint venture tracking t... Read more
Recreation & Community Center – Dynamic 10 Y...
Financial Model presenting a development and operating scenario of a Recreation & Community Cent... Read more
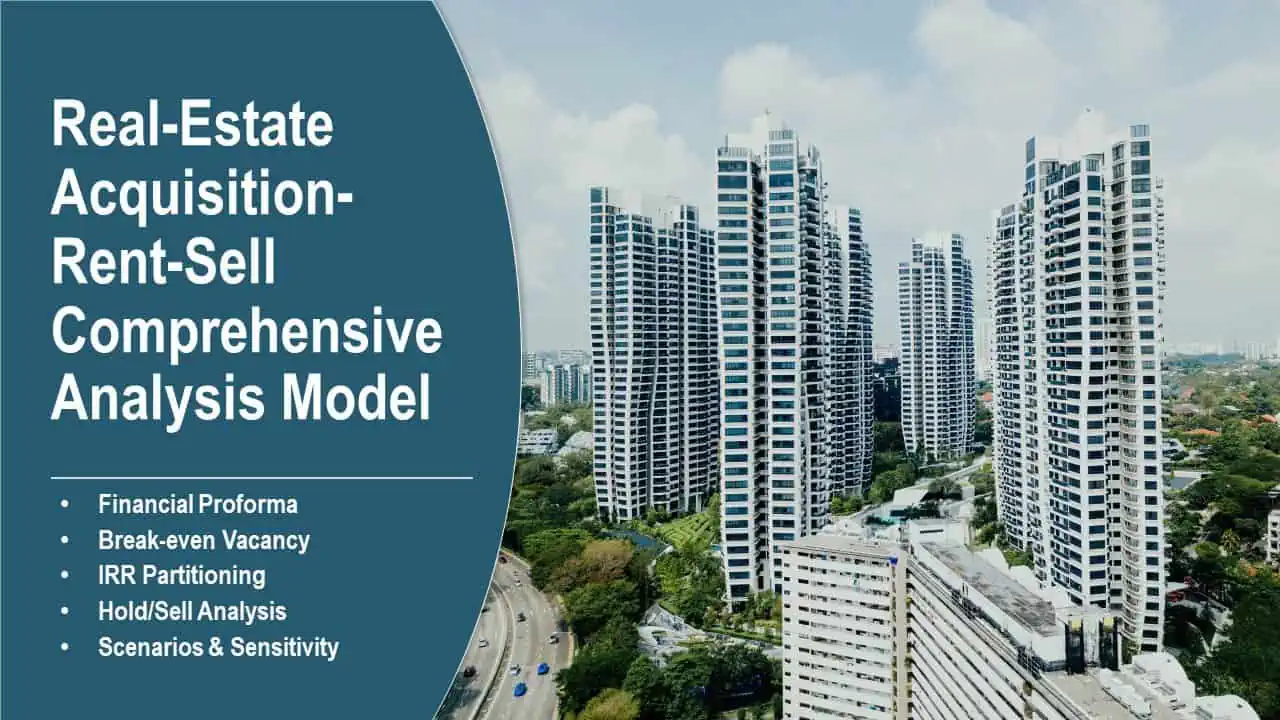
Real Estate Acquisition-Rent-Sell Comprehensive An...
An integrated, dynamic and ready-to-use Real Estate Acquisition-Rent-Sell Comprehensive Analysis Mod... Read more
Hotel/Guesthouse/Resort Development Model and Valu...
This Hotel / Holiday Resort Development Model will take you through a 20-year period of Three Statem... Read more
Commercial Real Estate – Lease or Sell Quart...
Commercial Real Estate - Lease or Sell Quarterly Excel Model with 3 Statements, Valuation, and Devel... Read more
Student Hostel Development – Dynamic 10 Year Fin...
A hostel is a lower-priced inn of sorts that offers basic, shared accommodations. Typically, a hoste... Read more
Co-working Spaces – Dynamic 10 Year Financial Mo...
Opening the doors to your own co-working space is a dream come true – especially if you’ve spent... Read more
You must log in to submit a review.


