
0 ITEMS

Pottery Manufacturing Financial Model Excel Template
The Pottery Manufacturing Financial Model helps users turn a ceramic production concept into a structured financial forecast that can support planning, funding discussions, and day-to-day decision-making. Instead of building a model from scratch, buyers can work from a ready-to-use template designed around the economics of a pottery manufacturing business, including product sales, production capacity, material costs, payroll, operating expenses, capital investments, cash flow, and profitability. The model is built to help users understand what it may take to launch, operate, and grow a pottery workshop or ceramic production facility over a multi-year period. This template is useful for entrepreneurs, founders, business owners, consultants, analysts, and anyone preparing a business plan, loan application, investor presentation, or internal budget. It allows users to enter editable assumptions for pricing, production volume, revenue streams, cost of goods sold, staffing, overhead, equipment purchases, and working capital needs. By connecting these assumptions to automated outputs, the model helps users see how changes in revenue assumptions, startup costs, operating expenses, and payroll can affect profit margins, cash flow, break-even timing, and overall financial performance. For a pottery manufacturing business, small changes in clay costs, kiln usage, batch efficiency, wholesale pricing, labor planning, and inventory decisions can have a major impact on profitability. This financial model template helps users organize those variables in one place so they can test practical scenarios before committing capital. It provides a clear view of monthly and annual performance, helping users evaluate whether the business can cover fixed costs, manage cash requirements, and reach sustainable profitability. The Pottery Manufacturing Financial Model is designed to be editable, investor-ready, and practical for real business planning. Users can adapt it for a new studio, an artisan pottery brand, a ceramic workshop, a small manufacturing facility, or an established operation planning expansion. With built-in dashboards, revenue modeling, cash flow projections, profitability analysis, break-even analysis, and stakeholder-ready reports, the template helps replace guesswork with a more disciplined financial planning process.
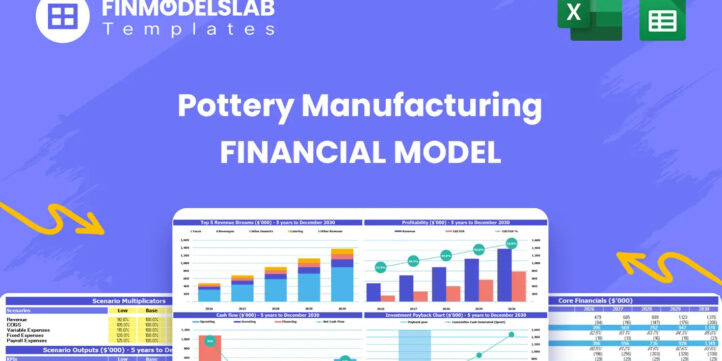


Financial Model Overview
The Pottery Manufacturing Financial Model is a ready-to-use financial model template designed to help entrepreneurs, ceramic studio owners, consultants, analysts, and business planners forecast the financial performance of a pottery manufacturing business. It brings together the core drivers of a ceramic production operation, including product pricing, production volume, material costs, labor, overhead, startup investment, equipment purchases, cash flow, profitability, and funding needs.
The template is especially useful for users preparing a business plan, investor presentation, loan package, or internal growth forecast because it converts operational assumptions into structured financial outputs. Instead of relying on rough estimates, users can enter their own assumptions and review a five-year view of revenue, expenses, profit, cash position, and financial health. The model is flexible enough for a new pottery workshop, a handmade ceramics brand, a small batch production studio, or an established ceramic manufacturing business planning expansion. It is built for practical decision-making, allowing users to test whether the business can support its cost structure, reach break-even, generate positive cash flow, and deliver an acceptable return on invested capital.
All-in-One Dashboard
The all-in-one dashboard brings the most important inputs and outputs of the Pottery Manufacturing Financial Model into a single, easy-to-review section. This component helps users quickly understand the overall financial position of the business without moving through every worksheet or calculation area. It may include core assumptions such as product pricing, unit sales, production volume, cost structure, payroll, capital expenditures, and financing inputs, while also showing key outputs such as revenue, EBITDA, net income, cash balance, break-even timing, and return metrics.
For a pottery manufacturing business, this is valuable because managers need to see how operational choices translate into financial outcomes. If production volumes increase, material costs rise, or staffing plans change, the dashboard helps users see the effect on profitability and liquidity. It also supports stakeholder communication by presenting a concise view of the business model in a format that is easier to explain during planning meetings, bank discussions, or investor presentations. The dashboard is useful for both initial planning and ongoing performance review because it gives users a central place to monitor whether the ceramic production business is moving toward its financial targets.
Low, Base, and High Scenario Analysis
The low, base, and high scenario analysis component allows users to test different financial outcomes under changing business conditions. In a pottery manufacturing operation, results can vary depending on sales demand, wholesale contracts, production efficiency, seasonal ordering patterns, pricing power, labor availability, raw material costs, and kiln utilization. This component gives users a structured way to compare a conservative case, a realistic operating case, and an upside case within the same model. Inputs may include different assumptions for annual unit sales, average selling prices, product mix, cost of goods sold, staffing levels, marketing spend, rent, and capital investment timing. The outputs show how each scenario affects revenue, gross margin, operating profit, cash flow, funding requirements, and long-term returns.
This is useful for decision-making because it helps founders and business owners avoid planning around only one version of the future. A low case can reveal risk exposure and cash pressure, a base case can support the main business plan, and a high case can show the benefits of stronger demand or higher-margin product lines. For investors and lenders, scenario analysis adds credibility because it demonstrates that the plan has been stress-tested and that management understands the major drivers of financial performance.
Professional Charts
The professional charts component converts the financial forecast into visual reports that are easier to interpret and present. A pottery manufacturing financial plan can contain many moving parts, from product-level revenue and operating expenses to cash balances, EBITDA, margins, and return metrics. Charts help turn those calculations into clear visual summaries that show trends over time. This component may include graphs for revenue growth, expense development, gross profit, EBITDA, net income, cash flow, cash balance, product mix, and profitability margins. It is useful because stakeholders often need to understand the financial story quickly, especially during funding discussions, management reviews, or business plan presentations.
For a ceramic production business, visual charts can highlight whether revenue growth is being driven by unit volume, pricing improvements, or a shift toward higher-margin products. They can also show whether costs are scaling efficiently or whether overhead is rising too quickly. By making the model presentation-ready, the charts help users communicate results with more confidence. They are also useful internally because founders and operators can identify trends, spot potential issues, and explain the impact of strategic decisions without relying only on rows of numbers.
ROE Components and DuPont Analysis
The ROE components and DuPont analysis section helps users evaluate the quality of the business return, not just the amount of profit generated. Return on equity is important for founders, investors, and business owners because it shows how effectively the pottery manufacturing business is using equity capital to produce earnings. The DuPont analysis breaks that return into underlying drivers, commonly including profitability, asset efficiency, and leverage. In practical terms, this component helps users see whether return performance is coming from strong margins, efficient use of assets such as kilns and production equipment, or the financing structure of the business.
Inputs and outputs may connect to net profit margin, asset turnover, equity levels, total assets, debt, and net income. For a pottery manufacturer, this analysis is especially relevant because equipment purchases, studio build-out, inventory, and working capital can tie up capital before revenue is fully established. By reviewing the components of ROE, users can identify whether they need to improve pricing, reduce production costs, increase utilization of fixed assets, or adjust their capital structure. This makes the model more useful for funding preparation, investor review, and strategic planning because it explains what is actually driving returns over the forecast period.
Revenue Inputs
The revenue inputs section is where users define the commercial assumptions that drive sales in the Pottery Manufacturing Financial Model. For a pottery manufacturing business, revenue is typically influenced by the number of units produced and sold, the average selling price of each product, the mix between product categories, growth rates, sales channels, and market demand. This component may include product lines such as mugs, plates, bowls, planters, decorative vases, custom pieces, wholesale orders, or direct-to-consumer sales, depending on how the user customizes the model.
Users can adjust assumptions annually or by period to reflect expected changes in pricing, production capacity, demand growth, and product strategy. The model then uses these assumptions to calculate total revenue and connect the forecast to income statements, cash flow projections, and performance dashboards. This section is valuable because it forces users to define how the pottery business actually makes money rather than relying on a single top-line estimate. It also helps test practical questions, such as whether the studio needs higher unit volume, premium pricing, better channel mix, or additional product categories to reach its financial goals. Clear revenue inputs make the rest of the forecast more reliable and help users justify their assumptions to lenders, investors, partners, and internal decision-makers.
Bank-Ready Financial Reports
The bank-ready financial reports component provides structured outputs that can support loan applications, lender discussions, and formal business planning. Banks and financing partners typically want to see clear financial statements, repayment capacity, profitability outlook, cash flow availability, and the assumptions behind the forecast. This section helps organize the model’s results into lender-friendly summaries, including projected profit and loss, cash flow, balance sheet, debt service capacity, startup funding needs, and key financial metrics.
For a pottery manufacturing business, this is important because initial investment may include kilns, wheels, molds, shelving, ventilation, studio improvements, inventory, a delivery vehicle, and working capital. Lenders need to understand whether the business can generate enough cash to cover operating expenses and debt payments after launch. The bank-ready reports help users present the forecast in a professional format, showing how revenue assumptions connect to cost of goods sold, payroll, overhead, capital expenditures, and net cash flow. This component is useful for entrepreneurs seeking equipment loans, small business financing, credit lines, or expansion capital. It also helps business owners prepare for lender questions by making the financial logic of the plan clearer and easier to review.
Revenue Breakdown
The revenue breakdown component gives users a more detailed view of the revenue streams behind the top-line forecast. Rather than showing only total sales, this section separates revenue by product line, category, or channel so users can see which parts of the pottery manufacturing business contribute the most to growth and profitability. Inputs may include units sold, average sales price, annual growth rate, product mix, and potentially different assumptions for retail, wholesale, online, studio sales, custom commissions, or seasonal orders. Outputs may show revenue by ceramic product category, the percentage contribution of each stream, changes over time, and the impact of product mix on total sales. This is useful because not every product has the same economics.
Coffee mugs may generate steady volume, decorative vases may carry higher pricing, planters may benefit from seasonal demand, and wholesale dinnerware orders may provide predictable revenue but lower margins. By breaking revenue into detailed streams, the model helps users decide where to focus production capacity, marketing budgets, inventory planning, and pricing strategy. It also improves the credibility of the financial forecast because stakeholders can see the assumptions behind revenue growth instead of relying on one broad estimate.
KPI Dashboard
The KPI dashboard tracks the key performance indicators that matter most for evaluating the pottery manufacturing business over time. While financial statements show the formal results, KPIs help users monitor the operational and financial drivers behind those results. This component may include metrics such as revenue growth, gross margin, EBITDA margin, net profit margin, cash balance, break-even timing, payback period, return on equity, average selling price, units sold, cost of goods sold as a percentage of revenue, payroll ratio, and operating expense ratio.
For a ceramic production business, KPIs are useful because they provide early signals about performance. If gross margin declines, users can investigate clay, glaze, packaging, labor, or kiln firing costs. If revenue grows but cash flow weakens, users can review inventory, receivables, supplier terms, or capital spending. If payroll becomes too high relative to sales, management can revisit production scheduling or staffing plans. The KPI dashboard helps founders, managers, consultants, and analysts move from passive reporting to active decision-making. It is also helpful for stakeholder updates because it summarizes progress in a focused way, showing whether the business is meeting its plan, where risks are emerging, and which areas may need adjustment.
Break-Even Analysis
The break-even analysis component helps users identify when the pottery manufacturing business is expected to cover its fixed and variable costs and begin generating profit. This section is especially important for a ceramic production venture because costs can include both predictable fixed expenses, such as rent, utilities, insurance, software, administrative costs, and salaried labor, as well as variable costs tied to production, such as clay, glaze, packaging, firing energy, labor per unit, and shipping supplies. Inputs may include average selling price, product mix, gross margin, monthly fixed costs, variable cost percentages, production volumes, and operating expense assumptions. The outputs can show the break-even month, required revenue level, required unit sales, margin safety, and the relationship between cost structure and profitability.
This is useful for planning because it tells users how much sales activity is required before the business becomes self-sustaining. It also helps users evaluate pricing decisions, wholesale discounts, production efficiency, and overhead commitments before making major investments. For funding purposes, break-even analysis gives lenders and investors a clear view of the timeline to profitability and the level of risk involved. For internal decision-making, it helps owners set realistic sales targets and understand how quickly the business must scale to cover its cost base.
Startup Costs and Capital Expenditure Planning
The startup costs and capital expenditure planning component organizes the upfront investment required to launch or expand a pottery manufacturing operation. A ceramics business often requires meaningful pre-opening spending before sales begin, including kiln purchase and installation, pottery wheels, slab rollers, shelving, studio renovation, ventilation, safety equipment, molds, tools, initial clay and glaze inventory, packaging, signage, website setup, deposits, licenses, initial marketing, and working capital reserves.
This section allows users to enter or revise the expected cost, timing, and useful life of major investments so the model can connect those assumptions to cash flow, depreciation, balance sheet values, and funding needs. It is useful because startup costs are often underestimated, especially in manufacturing businesses where equipment, build-out, and inventory must be in place before meaningful revenue can be generated. By separating one-time startup expenses from ongoing operating expenses, the model helps users understand how much capital is needed before launch and how that capital will be used.
Similar ProductsOther customers were also interested in...

 HenrySheykin
Solar Panel Manufacturing Plant Business Plan Fina...
The Solar Panel Manufacturing Financial Model helps users turn a solar factory concept into a struct... Read more
Coal Mining Financial Model Excel Template
The Coal Mining Financial Model helps users turn a mining project concept, expansion plan, or invest... Read more
Metal Mining Business Financial Model Excel Templa...
The Metal Mining Financial Model Financial Model Template helps users turn a mining project concept ... Read more
Food Production Financial Model Excel Template
The Food Manufacturing Financial Model helps entrepreneurs, founders, consultants, analysts, and bus... Read more
Clothing Line Business Financial Model Excel Templ...
The Clothing Line Financial Model helps founders, apparel entrepreneurs, consultants, analysts, and ... Read more
T-Shirt Printing Business Financial Model Excel Te...
The T-Shirt Printing Financial Model helps entrepreneurs, founders, business owners, consultants, an... Read more

Gold Mining Business Financial Model Excel Templat...
The Gold Mining Financial Model Financial Model Template helps users turn a gold mining project into... Read more
Biodiesel Manufacturing Business Financial Model E...
The Biodiesel Manufacturing Financial Model helps entrepreneurs, founders, business owners, consulta... Read more
Organic Fertilizer Production Financial Model Exce...
The Organic Fertilizer Production Financial Model helps users turn a fertilizer plant concept into a... Read more
Drone Manufacturing Financial Model Excel Template
The Drone Manufacturing Financial Model Financial Model Template helps turn a UAV production concept... Read more
You must log in to submit a review.