
0 ITEMS

Outpatient Clinic Financial Model Excel Template
The Outpatient Clinic Financial Model helps users turn a clinic business concept into a structured, editable financial forecast. Instead of relying on a generic spreadsheet, this template is built around the way an outpatient medical clinic actually operates, including practitioner capacity, patient utilization, payer and service revenue, staffing needs, operating expenses, startup costs, cash flow, profitability, and capital requirements. It gives entrepreneurs and planners a practical way to estimate whether a new clinic, expansion, or healthcare service line can support its cost structure and reach sustainable financial performance. This financial model template is designed for clinic founders, healthcare entrepreneurs, business owners, consultants, analysts, and anyone preparing a business plan, loan package, investor presentation, or internal budget. Users can adjust revenue assumptions, treatment pricing, provider schedules, utilization rates, payroll, medical supply costs, rent, insurance, administrative expenses, and other key drivers to reflect their specific market and operating plan. The model helps connect operational decisions with financial outcomes, making it easier to understand how changes in patient volume, staffing, reimbursement, and overhead affect profit and cash flow. The template supports financial planning over a multi-year forecast period, helping users estimate startup investment, monthly operating performance, cash flow dynamics, and long-term profitability. It is useful for testing assumptions before launch, comparing different growth scenarios, evaluating funding needs, and identifying the point at which the clinic may become profitable. Built-in structure for revenue forecasting, expense planning, break-even analysis, and investor-ready outputs helps users move from rough estimates to a more credible financial plan. For decision-making, the Outpatient Clinic Financial Model provides a clear view of the numbers that matter most. It helps users evaluate whether planned staffing levels are financially realistic, whether patient utilization targets are enough to cover costs, how much capital may be needed before and after opening, and which assumptions have the greatest impact on outcomes. Fully customizable and ready to use in Excel or Google Sheets, it saves time while giving users a professional framework for planning, funding discussions, management reviews, and strategic clinic growth.
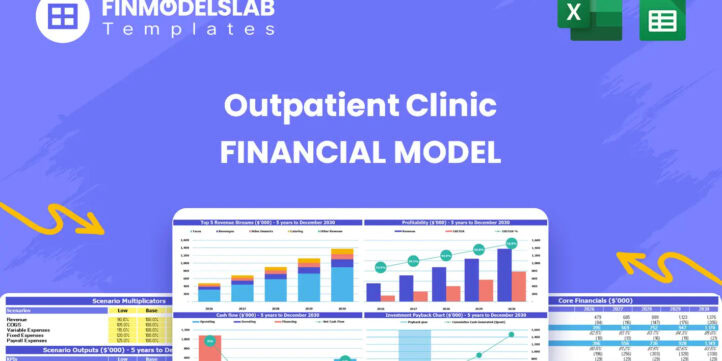


Financial Model Overview
The Outpatient Clinic Financial Model is a ready-to-use financial model template designed to help healthcare entrepreneurs, clinic owners, consultants, analysts, and business planners evaluate the financial feasibility of an outpatient medical clinic. It brings together the core assumptions that drive clinic performance, including practitioner capacity, patient utilization, treatment pricing, payer and service mix, staffing, medical supplies, overhead, capital expenditures, cash flow, and profitability. Rather than starting from a blank spreadsheet or adapting a generic model, users can work from a healthcare-focused structure that reflects how outpatient clinics generate revenue and manage costs. The template is useful for launch planning, expansion analysis, funding preparation, lender discussions, investor presentations, and internal decision-making. By organizing assumptions and outputs in one editable workbook, it helps users test whether the clinic can attract enough patients, cover fixed and variable expenses, fund startup needs, and move toward sustainable profitability over a multi-year forecast period.
All-in-One Dashboard
The all-in-one dashboard provides a central view of the most important inputs and outputs in the Outpatient Clinic Financial Model. It is designed to help users quickly understand the overall financial picture without reviewing every worksheet in detail. The dashboard may summarize assumptions such as clinic launch timing, provider count, utilization levels, pricing, startup investment, operating expenses, and financing structure, then connect those inputs to outputs such as revenue, EBITDA, net profit, cash balance, payback period, and return metrics. For a clinic business, this is especially useful because many decisions are interconnected. Hiring more practitioners may increase revenue capacity, but it also increases payroll and working capital needs. Raising utilization improves profitability, but it may require marketing spend, scheduling efficiency, or additional support staff. The dashboard helps users see these relationships in one place, making the model easier to navigate and more useful for planning meetings, stakeholder reviews, and funding discussions. It also gives founders and advisors a practical control panel for updating assumptions and immediately reviewing the impact on forecast results.
Low Base High Scenario Analysis
The Low Base High scenario analysis component helps users evaluate how the outpatient clinic may perform under different market and operating conditions. Instead of relying on a single forecast, the model allows users to compare conservative, expected, and optimistic cases based on changes to assumptions such as patient volume, utilization ramp-up, treatment pricing, reimbursement levels, practitioner hiring speed, supply costs, payroll, and overhead. This is valuable for healthcare planning because outpatient clinic performance can vary depending on patient acquisition, payer mix, competition, staffing availability, and local demand. A low case may show the effect of slower patient growth or lower reimbursement. A base case may reflect the user’s expected operating plan. A high case may model stronger utilization, faster expansion, or improved pricing. The outputs help users compare revenue, margins, cash flow, cash runway, funding needs, and profitability across scenarios. This supports better decision-making because founders and investors can identify key risk areas, understand downside exposure, and prepare contingency plans before committing capital or signing long-term obligations.
Professional Charts
The professional charts component turns the model’s financial outputs into clear visual reports that can be used for presentations, planning sessions, and stakeholder communication. Charts may display revenue growth, profitability trends, EBITDA development, monthly cash balance, expense categories, revenue by service line, margin progression, and other key financial metrics. For an outpatient clinic, these visuals are helpful because they make complex financial relationships easier to understand. A founder can quickly show how patient volume grows over time, when revenue begins to exceed operating costs, how cash moves through the launch period, or how different services contribute to total income. Consultants and analysts can use the charts to explain assumptions to clients, while business owners can include them in investor decks, bank loan packages, board updates, or internal management reviews. The professional formatting also reduces the need to recreate charts manually, saving time and improving consistency. By presenting the clinic’s financial story visually, this component helps users move beyond raw spreadsheet numbers and communicate the forecast in a more polished, practical, and decision-ready format.
ROE Components and DuPont Analysis
The ROE components and DuPont analysis section helps users understand what is driving return on equity in the outpatient clinic forecast. Rather than showing return metrics as a single final number, this component breaks performance into the underlying elements that influence investor return, such as profitability, asset efficiency, and leverage. For a clinic, this can help explain whether returns are being shaped mainly by operating margins, asset utilization, capital investment, debt structure, or growth in revenue. Inputs may include forecast profit, equity investment, assets, liabilities, financing assumptions, and projected financial statements. Outputs can highlight return on equity and the relationship between profit margins, asset turnover, and financial leverage. This is useful for investors, lenders, and owners because it provides a more analytical view of the business model. If returns are weak, users can identify whether the issue is low margin, underused capacity, excessive capital expenditure, or an inefficient financing structure. If returns improve, users can trace the improvement back to higher utilization, better margins, stronger revenue per provider, or more efficient use of invested capital.
Revenue Inputs
The revenue inputs section is one of the most important parts of the Outpatient Clinic Financial Model because it defines how the clinic generates income. It allows users to build revenue projections from operational drivers rather than simple top-down estimates. Inputs may include the number of primary care physicians, specialists, diagnostic technicians, or other practitioners, the maximum number of monthly consultations or treatments each provider can perform, average pricing or reimbursement per service, utilization rates, ramp-up assumptions, and service launch timing. This structure helps users model revenue in a way that reflects real clinic operations. For example, monthly revenue depends not only on price but also on practitioner capacity, scheduling efficiency, patient demand, and utilization growth. Users can adjust each assumption to reflect their own clinic format, local market, payer mix, specialty offering, and growth plan. The output helps generate monthly and annual revenue projections by service category and practitioner type. This component is useful for business planning because it links staffing and capacity decisions directly to revenue potential, making it easier to test whether the clinic can support planned expenses and investment.
Bank-Ready Reports
The bank-ready reports component organizes the financial model outputs into a format suitable for lenders, investors, partners, and other stakeholders who need to review the clinic’s financial plan. These reports may include projected profit and loss statements, cash flow forecasts, balance sheet summaries, funding requirements, repayment capacity indicators, and key performance metrics. For an outpatient clinic seeking financing, professional reporting is critical because banks and lenders often want to see how loan proceeds will be used, whether the business can cover operating expenses, and whether cash flow can support debt obligations. The reports help present assumptions and results in a structured, lender-friendly way, reducing confusion and improving credibility. Users can use these outputs as part of a loan application, business plan, investor memorandum, or internal approval package. Because the reports are linked to model assumptions, updates to revenue, costs, staffing, capital expenditures, or financing can flow through to the financial statements automatically. This makes it easier to revise the plan, respond to lender questions, and present a clear case for funding.
Revenue Breakdown
The revenue breakdown component gives users a detailed view of how each revenue stream contributes to total clinic performance. Instead of showing only total sales, it separates income by major service categories such as primary care physician consultations, diagnostic technician services, specialist appointments, or other outpatient services added by the user. Inputs may include pricing, reimbursement assumptions, provider count, treatment capacity, utilization, and growth rates for each stream. Outputs may show monthly and annual revenue by category, the percentage contribution of each service line, and how revenue mix changes over time. This is especially useful for outpatient clinics because not all services have the same economics. Some may generate high patient volume but lower average revenue per visit, while others may require specialized staff or equipment but produce higher revenue per appointment. By reviewing the revenue breakdown, users can identify which services drive growth, which offerings may need stronger marketing, and which areas may justify further investment. This supports better decisions around hiring, scheduling, equipment purchases, pricing strategy, service expansion, and overall clinic positioning.
KPI Dashboard
The KPI dashboard focuses on the performance metrics that matter most when managing or presenting an outpatient clinic financial plan. It may track indicators such as revenue growth, patient utilization, revenue per practitioner, gross margin, EBITDA margin, operating expense ratio, payroll burden, cash balance, payback period, and return metrics. These key performance indicators help users evaluate whether the clinic is moving toward financial targets and whether assumptions remain realistic. For founders and operators, the KPI dashboard can act as a management tool by showing where performance is strong and where attention may be needed. For consultants and analysts, it provides a concise way to explain model results to clients. For lenders and investors, it highlights the financial health of the plan in a format that is easier to review than detailed worksheets. The dashboard may also incorporate benchmark-style comparisons so users can assess whether revenue per practitioner, utilization rates, cost structure, and margins are aligned with reasonable expectations for ambulatory care. This component helps turn the forecast into an ongoing decision-making tool rather than a one-time projection.
Startup Cost and Capital Planning
The startup cost and capital planning component helps users estimate the investment required to open and prepare the outpatient clinic for operations. This section may include clinic build-out and renovation, leasehold improvements, examination room furnishings, diagnostic and medical equipment, IT systems, software, licensing, legal and professional fees, deposits, pre-opening payroll, insurance, initial marketing, supplies, and working capital. For a clinic launch, understanding startup costs is essential because cash requirements begin before patient revenue is generated. The model helps separate one-time capital expenditures from recurring operating expenses, making the budget more transparent and easier to fund. Outputs may show total launch investment, timing of expenditures, funding gap, and the amount of cash needed to reach stable operations. Users can edit the assumptions to reflect the size of the clinic, number of treatment rooms, equipment strategy, location, staffing plan, and local build-out costs. This component is useful for funding preparation because it helps founders justify how much capital is needed, where it will be spent, and how the investment supports the clinic’s revenue-generating capacity.
Break-Even Analysis
The break-even analysis component helps users identify when the outpatient clinic is expected to cover its costs and begin generating profit. It connects revenue assumptions, fixed expenses, variable costs, payroll, and patient volume to determine the point at which total income exceeds total operating costs. Inputs may include average revenue per visit, utilization rate, practitioner capacity, medical supply costs, rent, insurance, administrative salaries, marketing, software, and other recurring expenses. Outputs may show the forecast month of break-even, required monthly revenue, required patient volume, and the margin of safety under different assumptions. This is valuable for entrepreneurs, investors, and lenders because break-even timing is one of the clearest indicators of financial viability. If break-even occurs too late, users can test ways to improve the plan, such as increasing utilization, adjusting pricing, reducing overhead, phasing hiring more carefully, negotiating supplier costs, or strengthening pre-launch patient acquisition. By showing the relationship between operations and profitability, the break-even analysis helps users make practical decisions about launch strategy, cost control, funding reserves, and growth pacing.
File types:
Excel – Single-User: .xlsx
Excel – Multi-User: .xlsx
Similar ProductsOther customers were also interested in...



 HenrySheykin
Physiotherapy Financial Model Excel Template
The Physiotherapy Clinic Financial Model helps founders, clinic owners, consultants, analysts, and b... Read more
 Giorgos
Hospice & Home Care Agency – 5 Year Financia...
Financial Model providing an advanced 5-year financial plan for a startup or operating Hospice and H... Read more
Urgent Care Center Financial Model Excel Template
The Urgent Care Center Financial Model helps users turn a walk-in clinic concept into a structured f... Read more
Gynecology Financial Model Excel Template
The Gynecology Clinic Financial Model Financial Model Template helps entrepreneurs, clinic founders,... Read more
Medical Practice Financial Model Excel Template
The Medical Practice Financial Model helps users turn a clinic concept, expansion plan, or healthcar... Read more
Ophthalmology Financial Model Excel Template
The Ophthalmology Clinic Financial Model is a ready-to-use financial model template designed to help... Read more
Nutritionist Financial Model Excel Template
The Nutritionist Financial Model Financial Model Template helps turn a nutrition practice, dietitian... Read more
Clinic Financial Model Excel Template
The Healthcare Clinic Financial Model helps founders, clinic owners, consultants, analysts, and busi... Read more
Veterinary Financial Model Excel Template
The Veterinary Clinic Financial Model Financial Model Template helps entrepreneurs, clinic owners, c... Read more
Dental Practice Financial Model Excel Template
The Dental Clinic Financial Model helps users turn a dental practice concept, launch plan, or expans... Read more
Reviews
 Not so good on expenses
I like the “feel” of the program but not so much the content input. Expenses were not articulated enough; narrow range and not easy to use or input. Model was not as intuitive as I would have liked.
3836 of 7933 people found this review helpful.
Help other customers find the most helpful reviews
Did you find this review helpful?
 good
good
Thank you for your feedback.
3965 of 7749 people found this review helpful.
You must log in to submit a review.