
0 ITEMS

Operating Profit Bridge & Scenario Analysis Excel Model
Revenue is growing. GP% looks healthy. So why isn’t Operating Profit? A strong top line can hide a very different profit story. Higher volume, pricing or better GP% can be offset by COGS, Logistics, A&M, Opex and other costs — leaving the business working harder without making more money. Understand TODAY: bridge the change in Operating Profit and see exactly what created value and what consumed it across Volume, Price & D&A, Mix, COGS and operating expenses. Follow the money through the P&L and uncover effects a single KPI can hide. Plan TOMORROW: change your assumptions and model how pricing, volume, mix, costs and expenses could affect future Operating Profit — before the impact reaches your P&L. Turn the analysis into Risks, Opportunities and Actions and management-ready outputs that show not just what happened, but what needs to change next. Built for FP&A, Finance Business Partners, Commercial Finance, Finance Managers, Controllers and Business Owners who want one answer: Where did the profit go — and how do we get more of it to the bottom line?
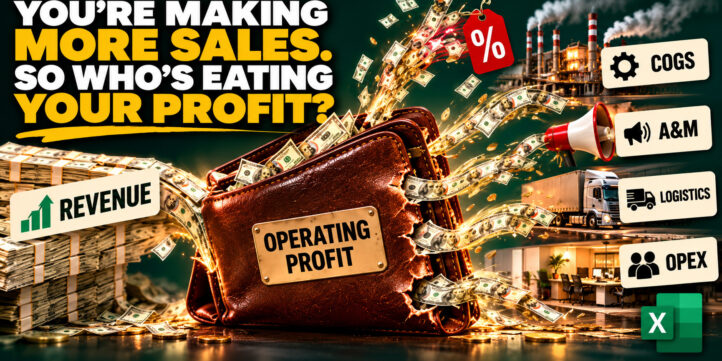
Revenue is growing. GP% looks healthy. So why isn’t Operating Profit?
A strong top line does not guarantee stronger profit.
Volume can grow. Pricing can work. GP% can improve. Yet higher COGS, Logistics, A&M, Opex or other expenses can absorb those gains before they reach Operating Profit.
Even more importantly, a positive KPI can hide what is happening elsewhere in the P&L. Lower D&A, for example, may improve GP% while higher Marketing investment reduces Operating Profit.
The Operating Profit Bridge & Scenario Analysis Excel Model helps you follow the money through the P&L and understand where profit was created, where it was consumed — and what could happen next.
1 | Understand TODAY — Where did the profit go?
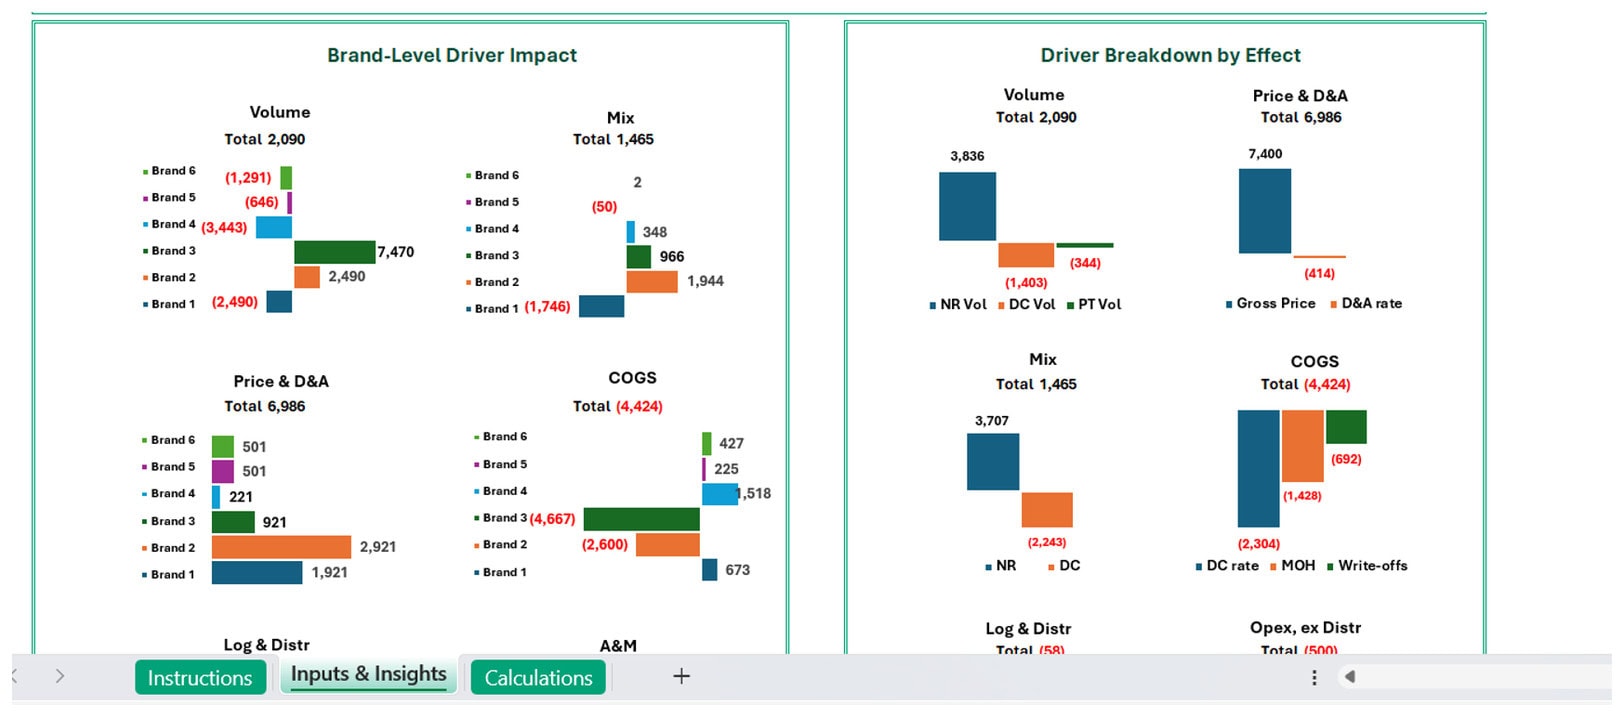
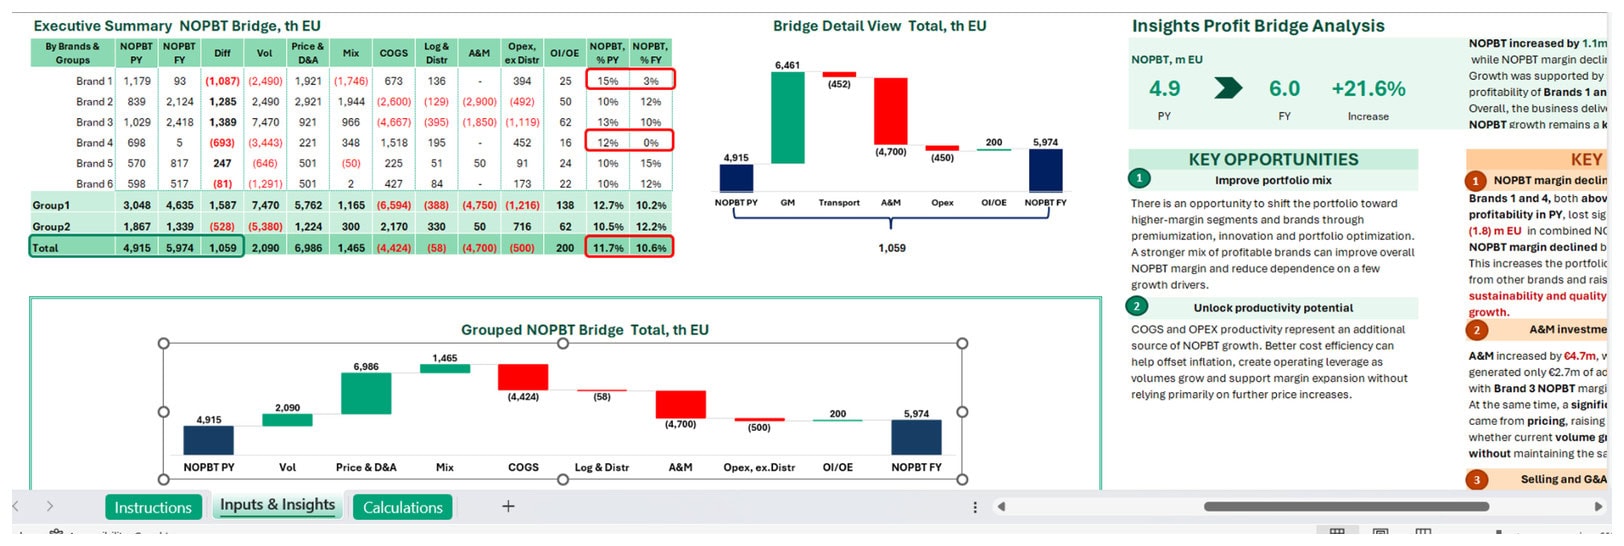
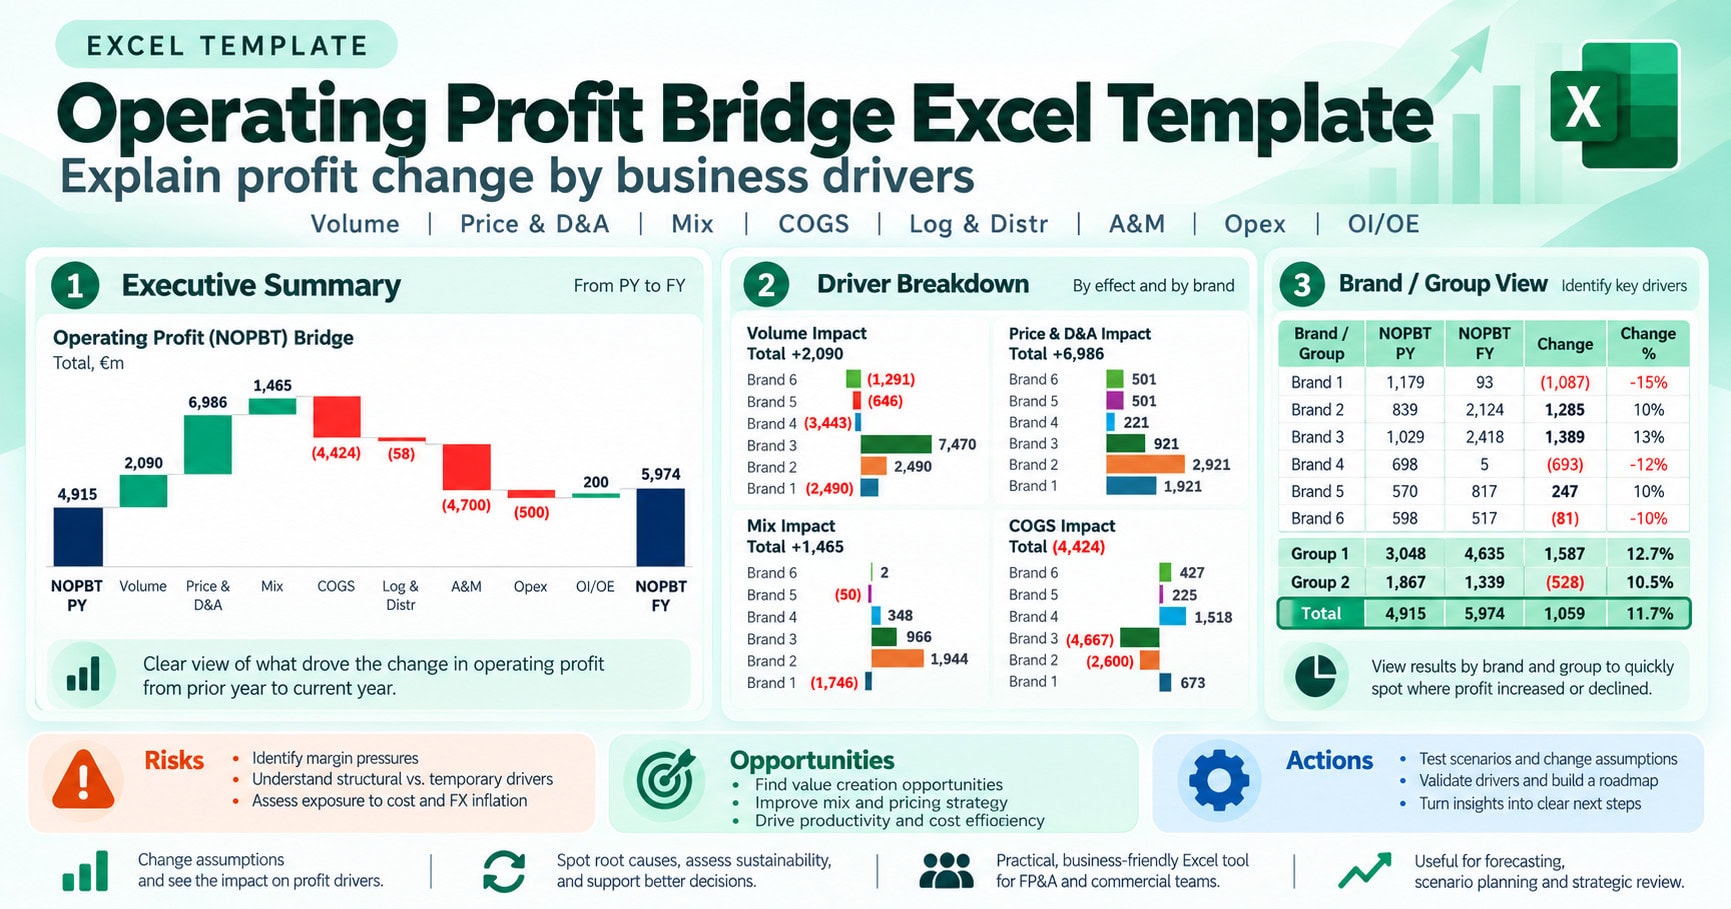
Compare any two selected periods and decompose the change in Operating Profit into its underlying business drivers:
Volume | Price & D&A | Mix | COGS | Logistics | A&M | Opex | Other Income & Expenses
Instead of stopping at “Operating Profit decreased”, identify exactly which drivers helped performance and which eroded it.
See whether growth is genuinely profitable — or whether improvements in Revenue or GP% are being absorbed elsewhere in the P&L.
2 | See the CONNECTIONS — Don’t let one KPI fool you
Financial performance does not happen in isolation.
A pricing improvement can be offset by COGS. Volume growth can generate additional profit while requiring higher operating expenses. Commercial investment can shift between D&A and Marketing, making GP% look better without improving overall profitability.
The model helps connect these movements and distinguish real profit improvement from cost shifts, temporary benefits and hidden pressure elsewhere in the P&L.
Don’t celebrate one KPI while Operating Profit quietly deteriorates.
3 | Plan TOMORROW — What happens next?
The model is not limited to explaining historical performance.
Change assumptions for Volume, Pricing, D&A, Mix, COGS and operating expenses to model future Operating Profit before the impact appears in actual results.
What if volume grows?
What if pricing increases but COGS rises too?
What if Marketing investment increases?
Which combination of drivers can deliver the target Operating Profit?
Use scenarios to understand what could happen — and what needs to change to protect or improve profit.
From variance analysis to management action
Linked bridges, driver views, charts and executive insights turn the analysis into nearly ready-to-use management presentation materials structured around:
Performance | Key Drivers | Risks | Opportunities | Actions
Use the model for performance reviews, forecasting, budgeting, scenario planning, business reviews and executive presentations.
Built for people responsible for profit
Designed for FP&A, Finance Business Partners, Commercial Finance, Finance Managers, Controllers and Business Owners who need to understand not just whether profit changed, but why — and what to do next.
What you get
✓ Operating Profit bridge across any two selected periods
✓ Volume, Price & D&A and Mix impacts
✓ COGS and operating expense impacts
✓ Cross-P&L driver analysis
✓ Forward-looking scenario modeling
✓ Automatically updated charts and management visuals
✓ Risks, Opportunities and Actions
✓ Fully editable Excel model with sample data
Revenue is only the beginning. Operating Profit tells you what the business actually kept.
Find where the profit went. Model what happens next. Get more of it to the bottom line.
Similar ProductsOther customers were also interested in...



 eFinancialModels
Electric Vehicle (EV) Charging Station Financial M...
With this comprehensive 5- or 10-year monthly tool, investors can assess the viability of setting up... Read more

Financial Model for Mobile App | Mobile App Busine...
The Mobile App Financial Plan Template in Excel allows you to develop financial projections when lau... Read more

 HenrySheykin
Food Truck Financial Model Excel Template
The Food Truck Financial Model helps entrepreneurs, founders, business owners, consultants, and anal... Read more

Green Hydrogen Production from Wind Energy Financi...
The Green Hydrogen from Wind Financial Model aims to comprehensively forecast a horizon of 40 years ... Read more

Simple Mutual Non-Disclosure Agreement Template
Protect your business secrets with ease using our Simple Mutual Non-Disclosure Agreement Template. S... Read more

Solar Energy Financial Model
The Solar Energy Financial Model Spreadsheet Template in Excel assists you in preparing a sophistica... Read more

 Peter Graf
The Customer-Centric Financial Model for Restauran...
Starting a restaurant without a financial plan is like driving a car blindfolded. You wouldn´t do i... Read more
You must log in to submit a review.