
0 ITEMS

Multifamily Value-Add Apartment Acquisition Model – Unit-by-Unit Renovation, LTV/DSCR/Debt-Yield Loan Sizing, Refinance and Promote Waterfall (Excel)
Underwrite an apartment value-add deal end to end. The loan is sized by all three lender tests and the binding one is named, the renovation programme runs unit by unit with downtime, there is a refinance against stabilised income, and a four-tier promote waterfall shows what the sponsor earns. Eight tabs, 855 live formulas, 20 built-in checks, no circular references.
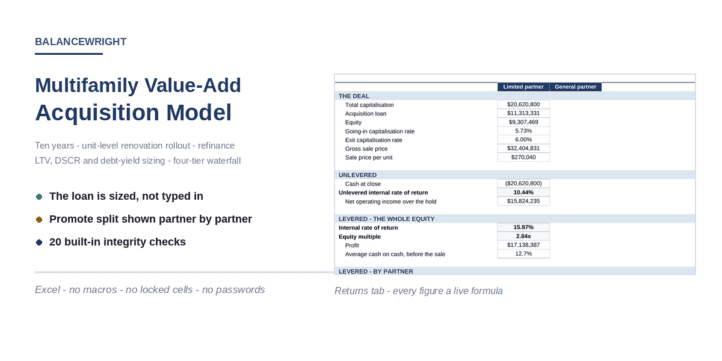
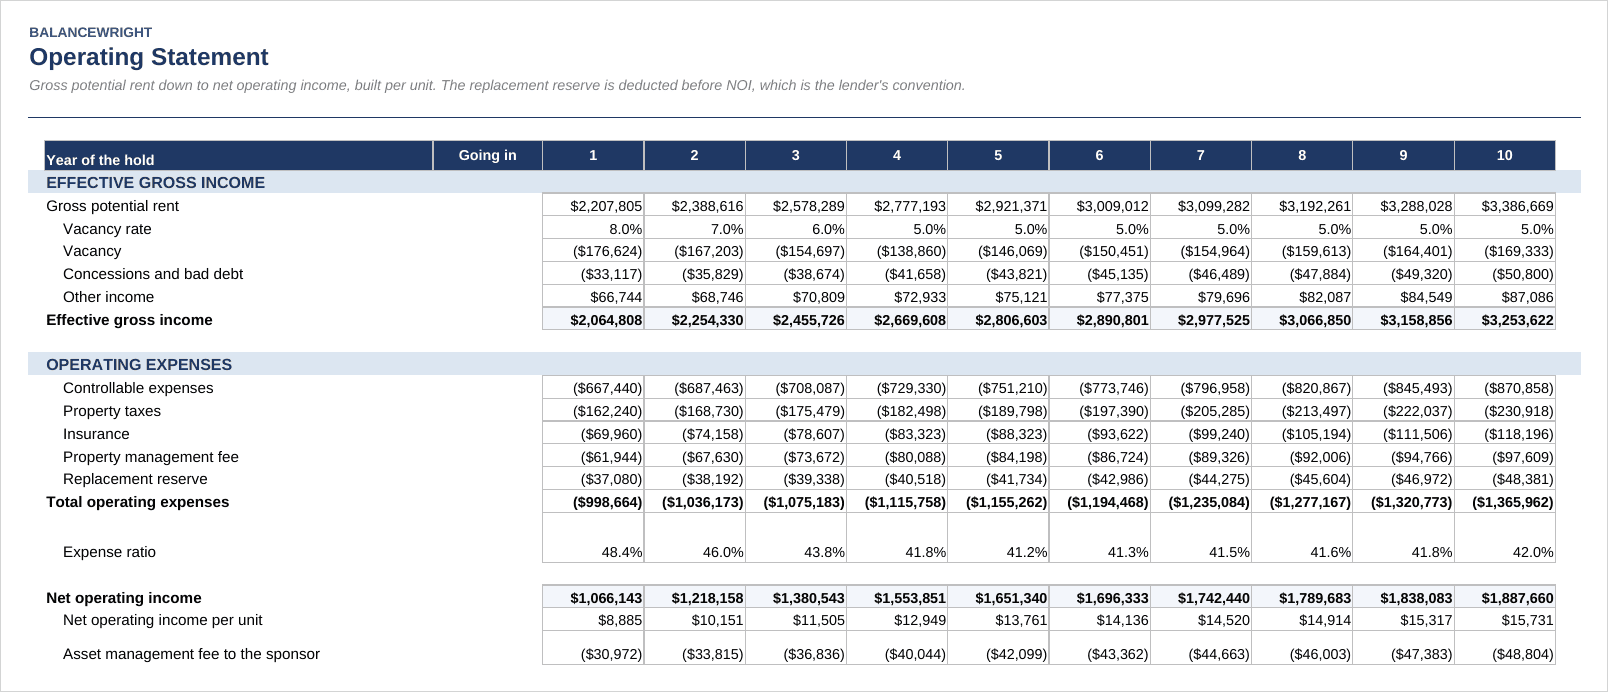
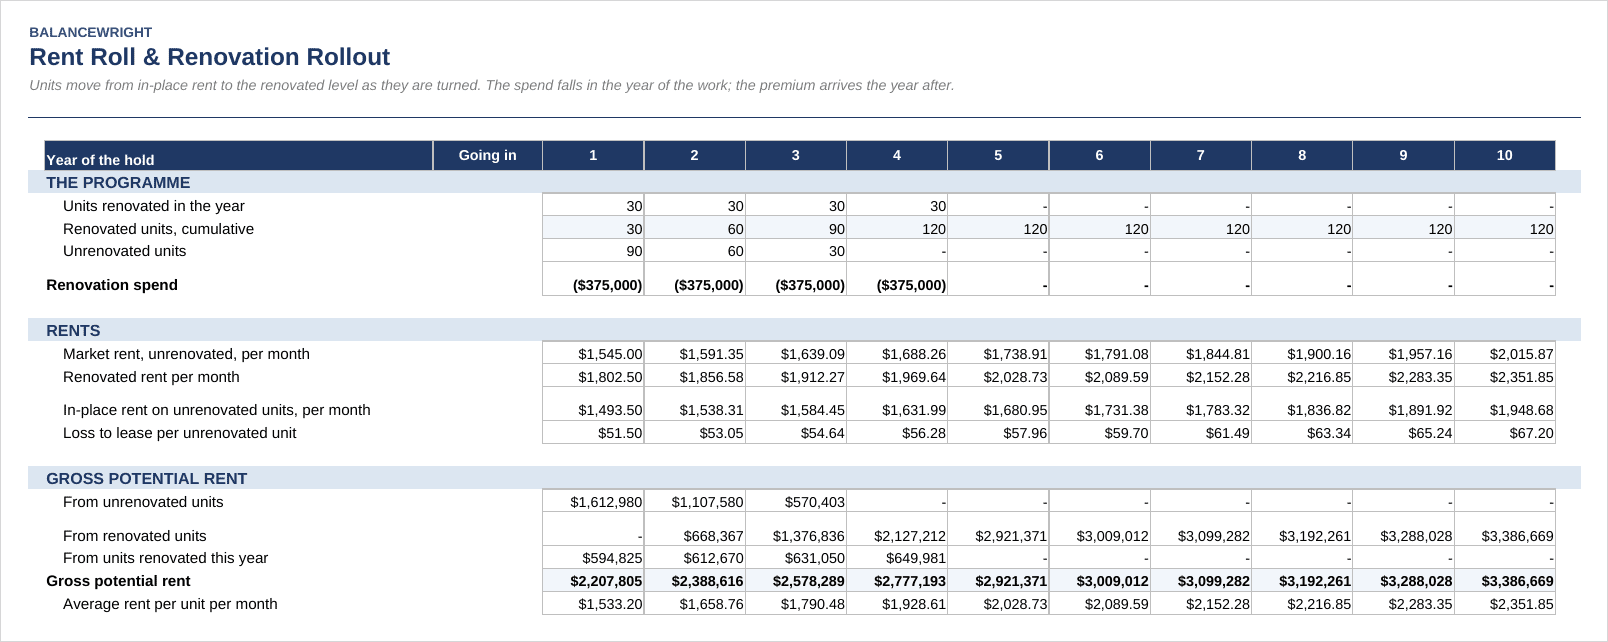
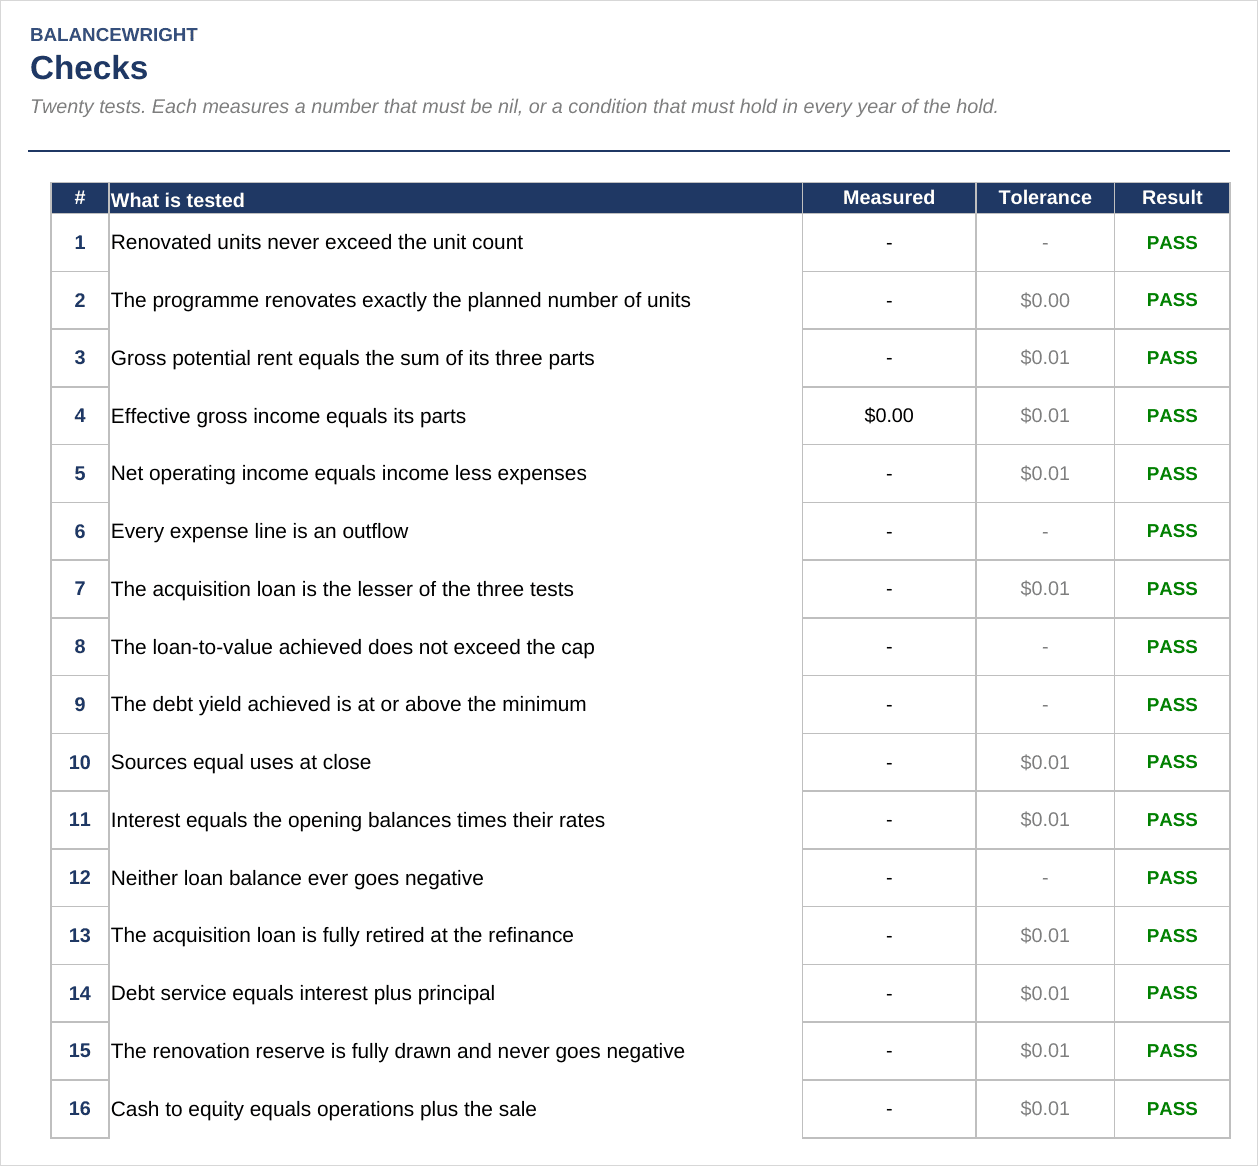
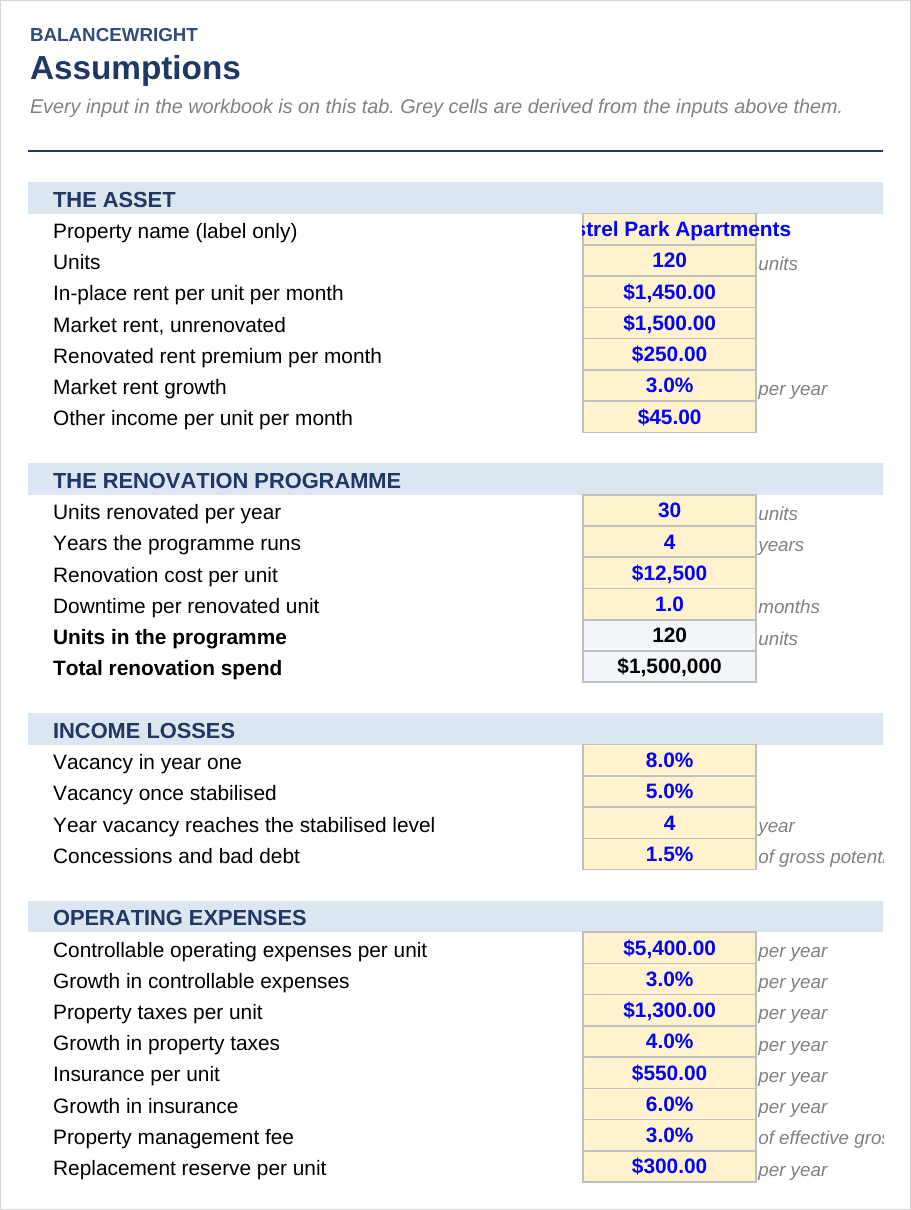
This workbook underwrites the purchase, renovation, refinancing and sale of an apartment property over a ten-year hold. Eight tabs, 855 live formulas, one worked example loaded and working the moment you open it.
The loan is sized, not typed in
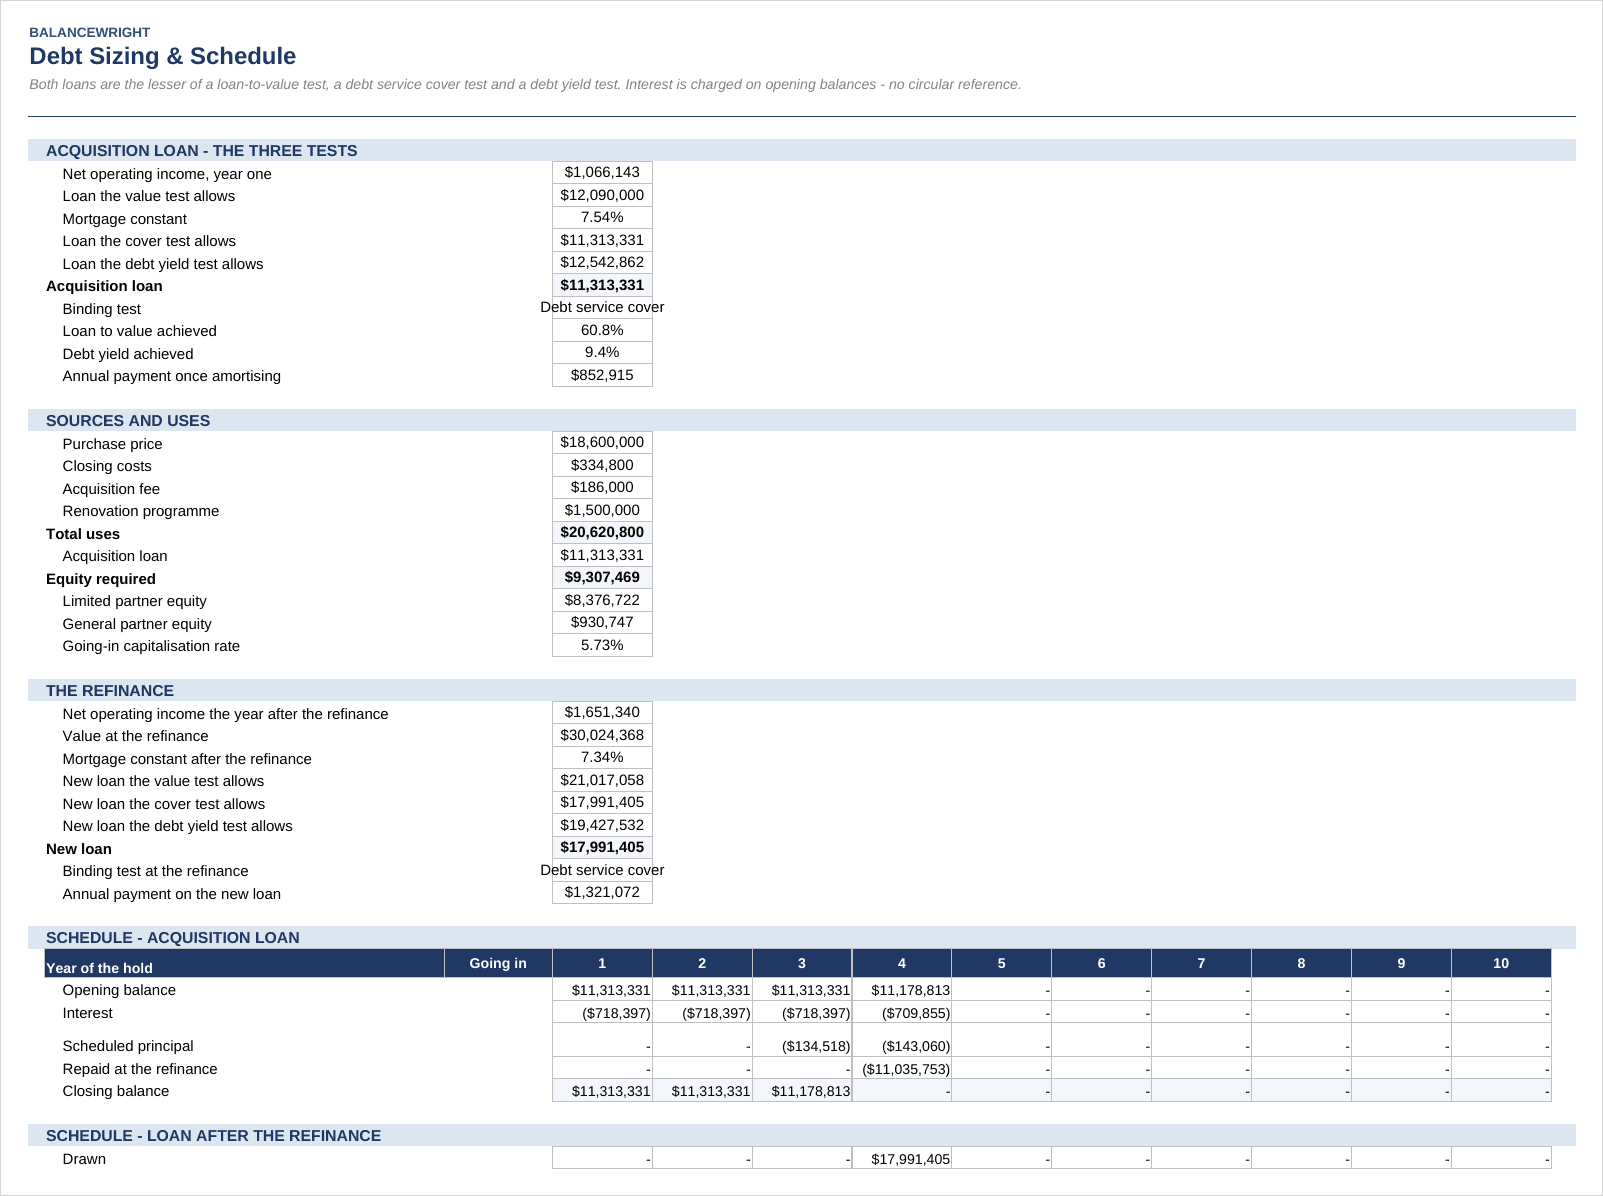
Most value-add templates ask you to enter a loan amount and then report a debt service cover ratio that nothing in the file acts on. Here the loan is the smallest of the three tests a lender actually runs — loan to value, debt service cover and debt yield — solved in closed form through the mortgage constant, and the binding test is named in a cell you can read. In the worked example the value test allows $12.09m, the cover test allows $11.31m and the debt yield test allows $12.54m, so the loan is $11.31m, the binding test is debt service cover, and the 60.8% loan to value that results is a consequence rather than an assumption. Raise the rents and the loan moves on its own.
The renovation programme is modelled unit by unit
Thirty units turn a year until the property runs out of units. A unit turned in year three earns the renovated rent for eleven of that year’s twelve months and for all twelve of every year after, while the units still waiting earn the in-place rent and carry a loss to lease the model reports on its own line. The programme funds itself from a reserve raised at close, drawn down as the units turn, with anything left released into the sale.
The refinance is sized the same way, against stabilised income
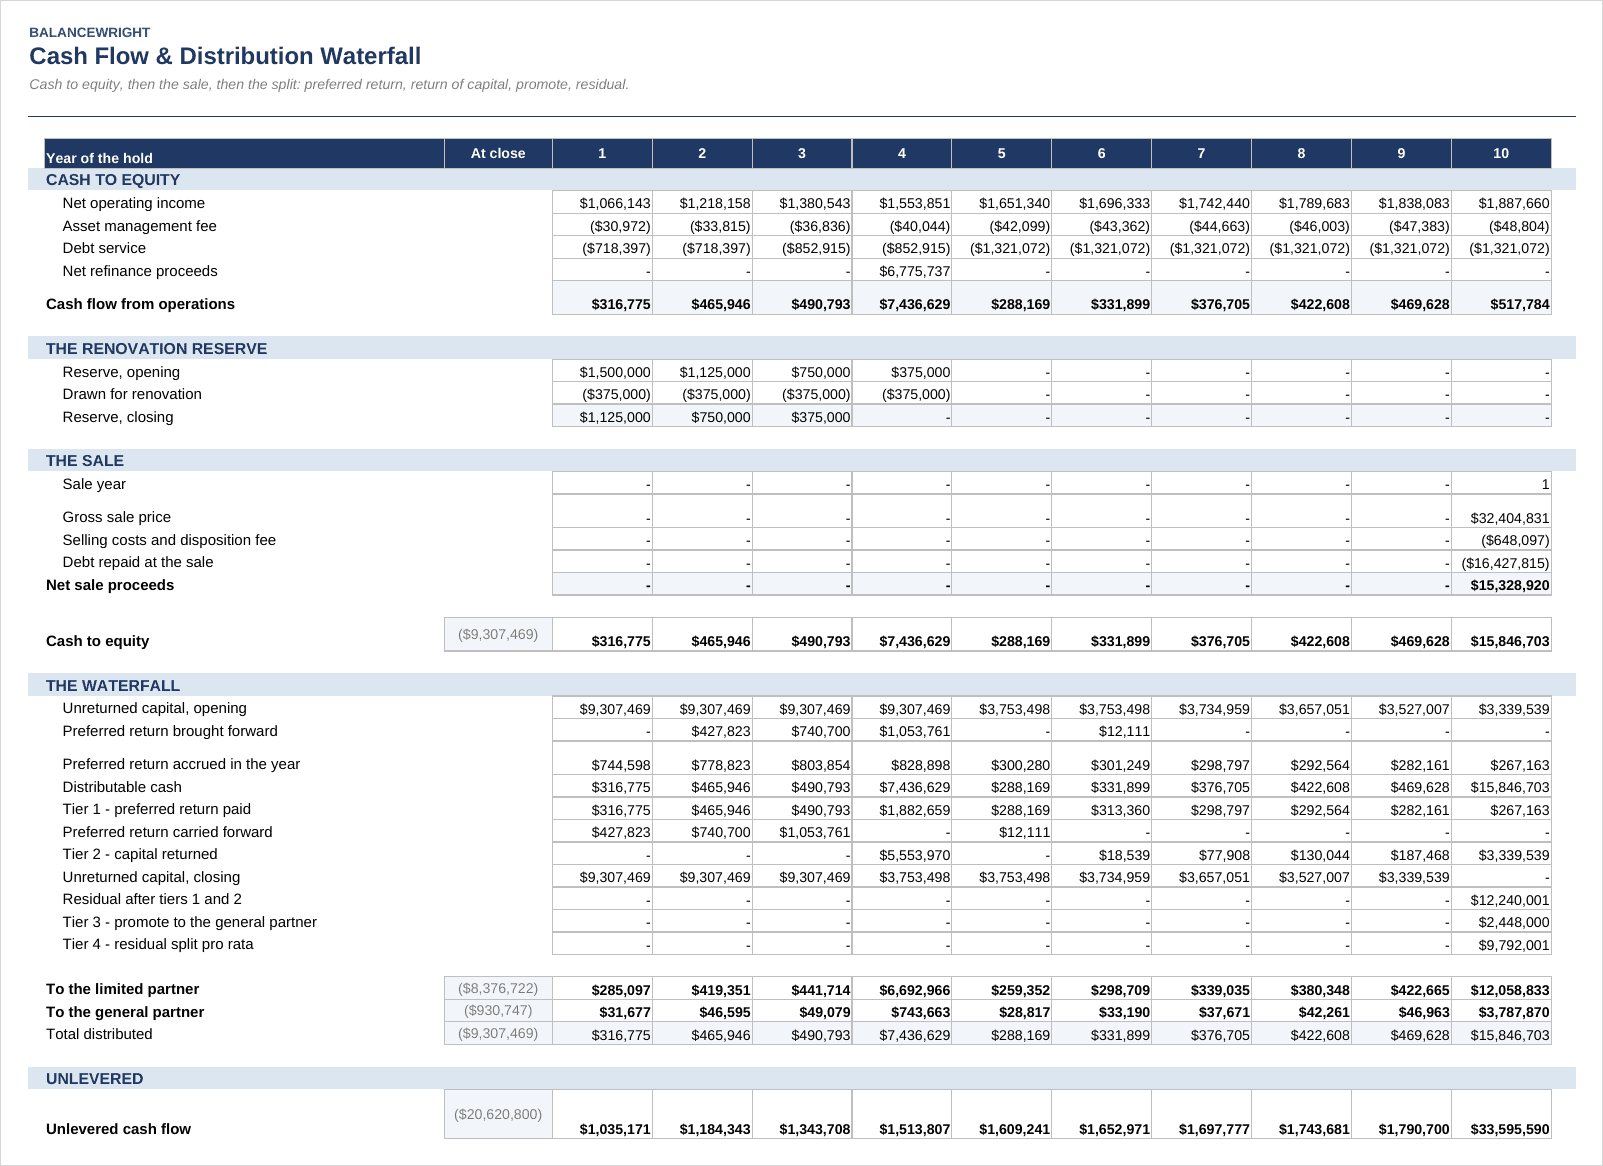
Three tests again, run on the net operating income of the year after the refinance rather than the income at close — which is the entire point of refinancing a value-add deal. In the worked example the property is refinanced in year four at a 5.5% cap rate against $1.65m of NOI, the new loan is $17.99m, and net proceeds of $7.44m return most of the $9.31m of equity in year four.
The waterfall shows what the promote costs
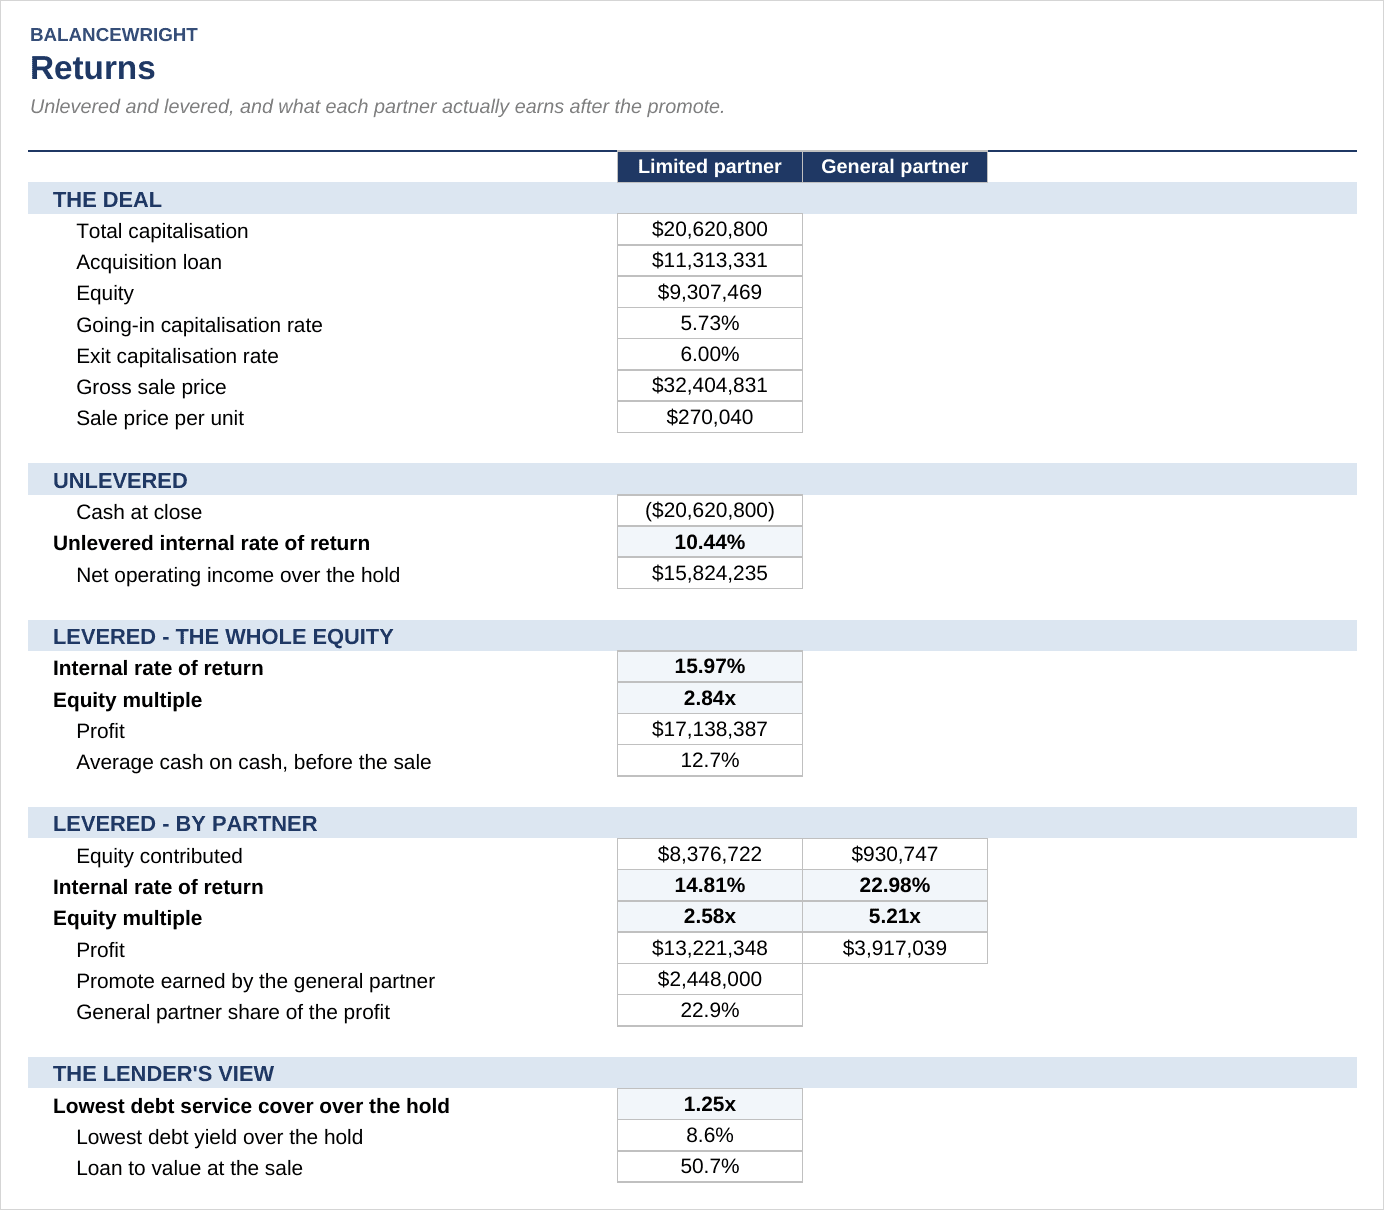
Four tiers: a compounding 8% preferred return that accrues on unreturned capital and on preferred return that went unpaid, then return of capital, then a 20% promote on the residual, then a pro rata split. The whole equity earns 15.97% and 2.84x. The limited partner earns 14.81% and 2.58x. The general partner takes 22.9% of the profit on 10% of the equity. All three numbers sit next to each other on the Returns tab, which is not where a sponsor usually puts them.
Twenty checks
Each measures a number that must be nil or a condition that must hold in every year: the programme never renovates more units than the property has, gross potential rent equals the sum of its three parts, the loan equals the smallest of the three tests, sources equal uses, the waterfall distributes exactly the cash available, and capital and preferred return are both fully settled by the end of the hold.
Tabs: Read Me, Assumptions, Rent Roll & Renovation, Operating, Debt, Cash Flow & Waterfall, Returns, Checks.
Worked example
Kestrel Park Apartments — 120 units at $18.6m, in-place rent $1,450 against a $1,500 market, a $250 renovated premium, 30 units a year for four years at $12,500 each, refinanced in year four, sold in year ten at a 6.0% exit cap for $32.4m, or $270,040 a unit. Going-in cap 5.73%, unlevered IRR 10.44%, levered IRR 15.97%, average cash on cash 12.7%, lowest debt service cover 1.25x.
What you change
Everything is on one Assumptions tab: the asset, the renovation programme, vacancy and concessions, five expense lines with three separate growth rates, acquisition and exit, the lender’s three tests, the refinance, and the waterfall. Set the renovation years to zero for a stabilised acquisition and the renovation machinery switches itself off. Set the refinance year to zero and there is no refinance.
How it is built
Microsoft Excel (.xlsx). No macros, no add-ins, no external links, no password protection, no locked cells, and iterative calculation off — interest is charged on opening balances, so the whole financing block resolves left to right in one pass and returns the same numbers in Excel, LibreOffice, Numbers and Google Sheets.
Every figure in this model was independently re-derived before publication: the whole deal was rebuilt in a second implementation and compared to the workbook in 129 separate tests, with both internal rates of return solved by bisection rather than by Excel’s IRR.
What this model is not
Annual, not monthly. One property, not a portfolio. No tax, no depreciation, no cost segregation. A value-add acquisition, not a development.
A 12-page guide and preview PDF is included with the download.
Similar ProductsOther customers were also interested in...



 eFinancialModels
Electric Vehicle (EV) Charging Station Financial M...
With this comprehensive 5- or 10-year monthly tool, investors can assess the viability of setting up... Read more

Financial Model for Mobile App | Mobile App Busine...
The Mobile App Financial Plan Template in Excel allows you to develop financial projections when lau... Read more

 HenrySheykin
Food Truck Financial Model Excel Template
The Food Truck Financial Model helps entrepreneurs, founders, business owners, consultants, and anal... Read more

Green Hydrogen Production from Wind Energy Financi...
The Green Hydrogen from Wind Financial Model aims to comprehensively forecast a horizon of 40 years ... Read more

Simple Mutual Non-Disclosure Agreement Template
Protect your business secrets with ease using our Simple Mutual Non-Disclosure Agreement Template. S... Read more

Solar Energy Financial Model
The Solar Energy Financial Model Spreadsheet Template in Excel assists you in preparing a sophistica... Read more

 Peter Graf
The Customer-Centric Financial Model for Restauran...
Starting a restaurant without a financial plan is like driving a car blindfolded. You wouldn´t do i... Read more
You must log in to submit a review.