
0 ITEMS

Institutional-Grade DCF Valuation Model (Excel Financial Model) — 10-Year Unlevered FCF, WACC Builder, Scenarios & Sensitivity
10-year DCF in Excel: unlevered FCF, WACC builder (CAPM, Hamada, CSRP), Base/Bull/Bear toggle, two sensitivity grids, exit-multiple cross-check, AI commentary prompts. Pre-filled Microsoft worked example, every input sourced and dated. No macros.
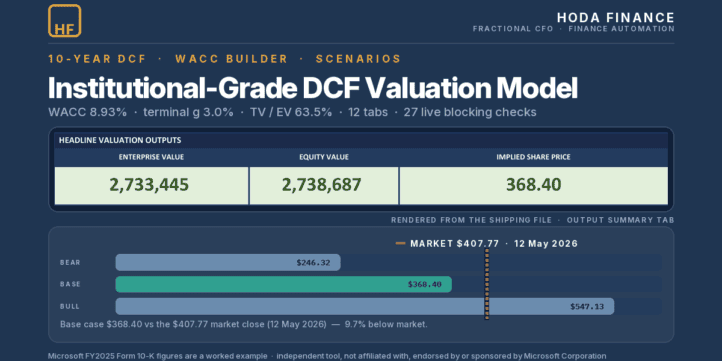
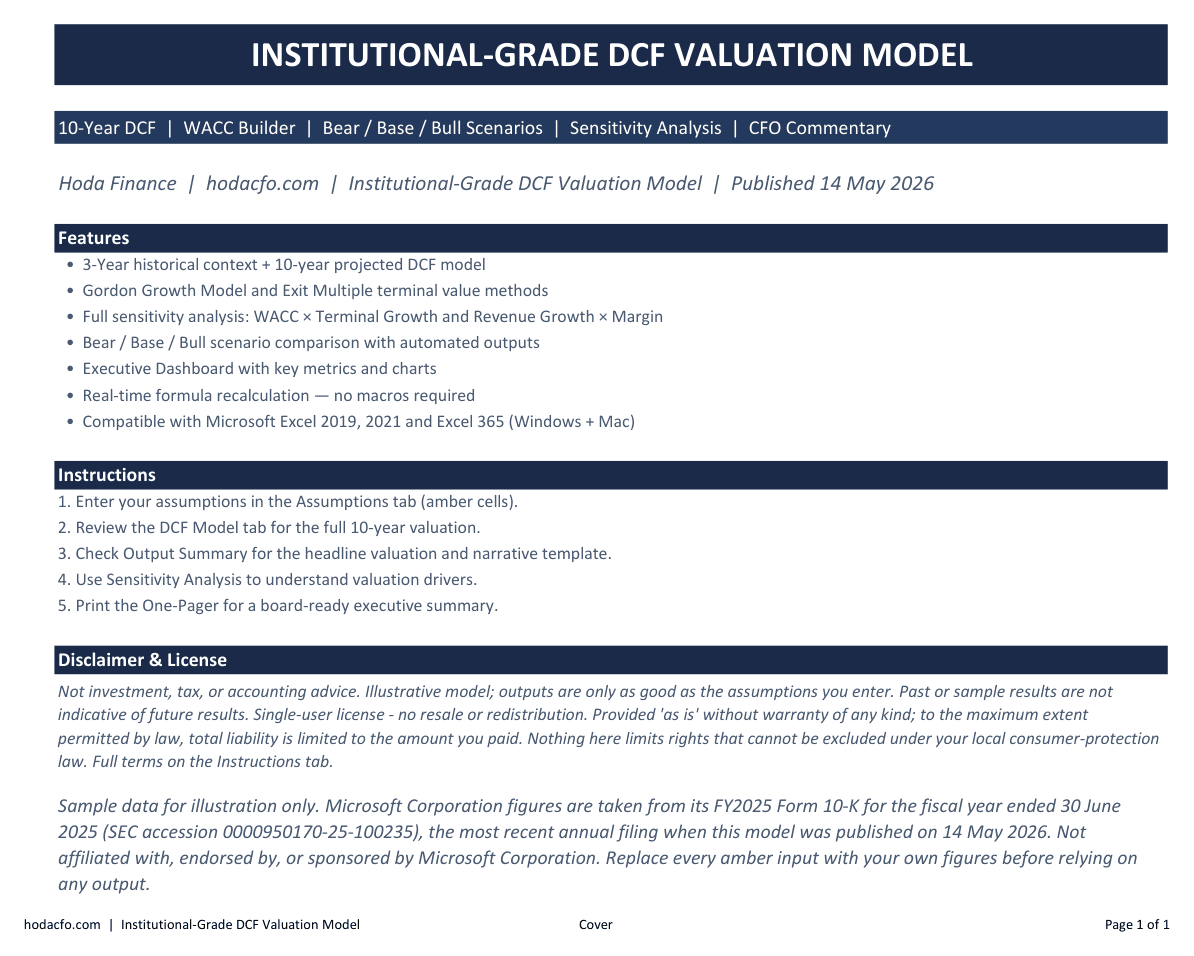
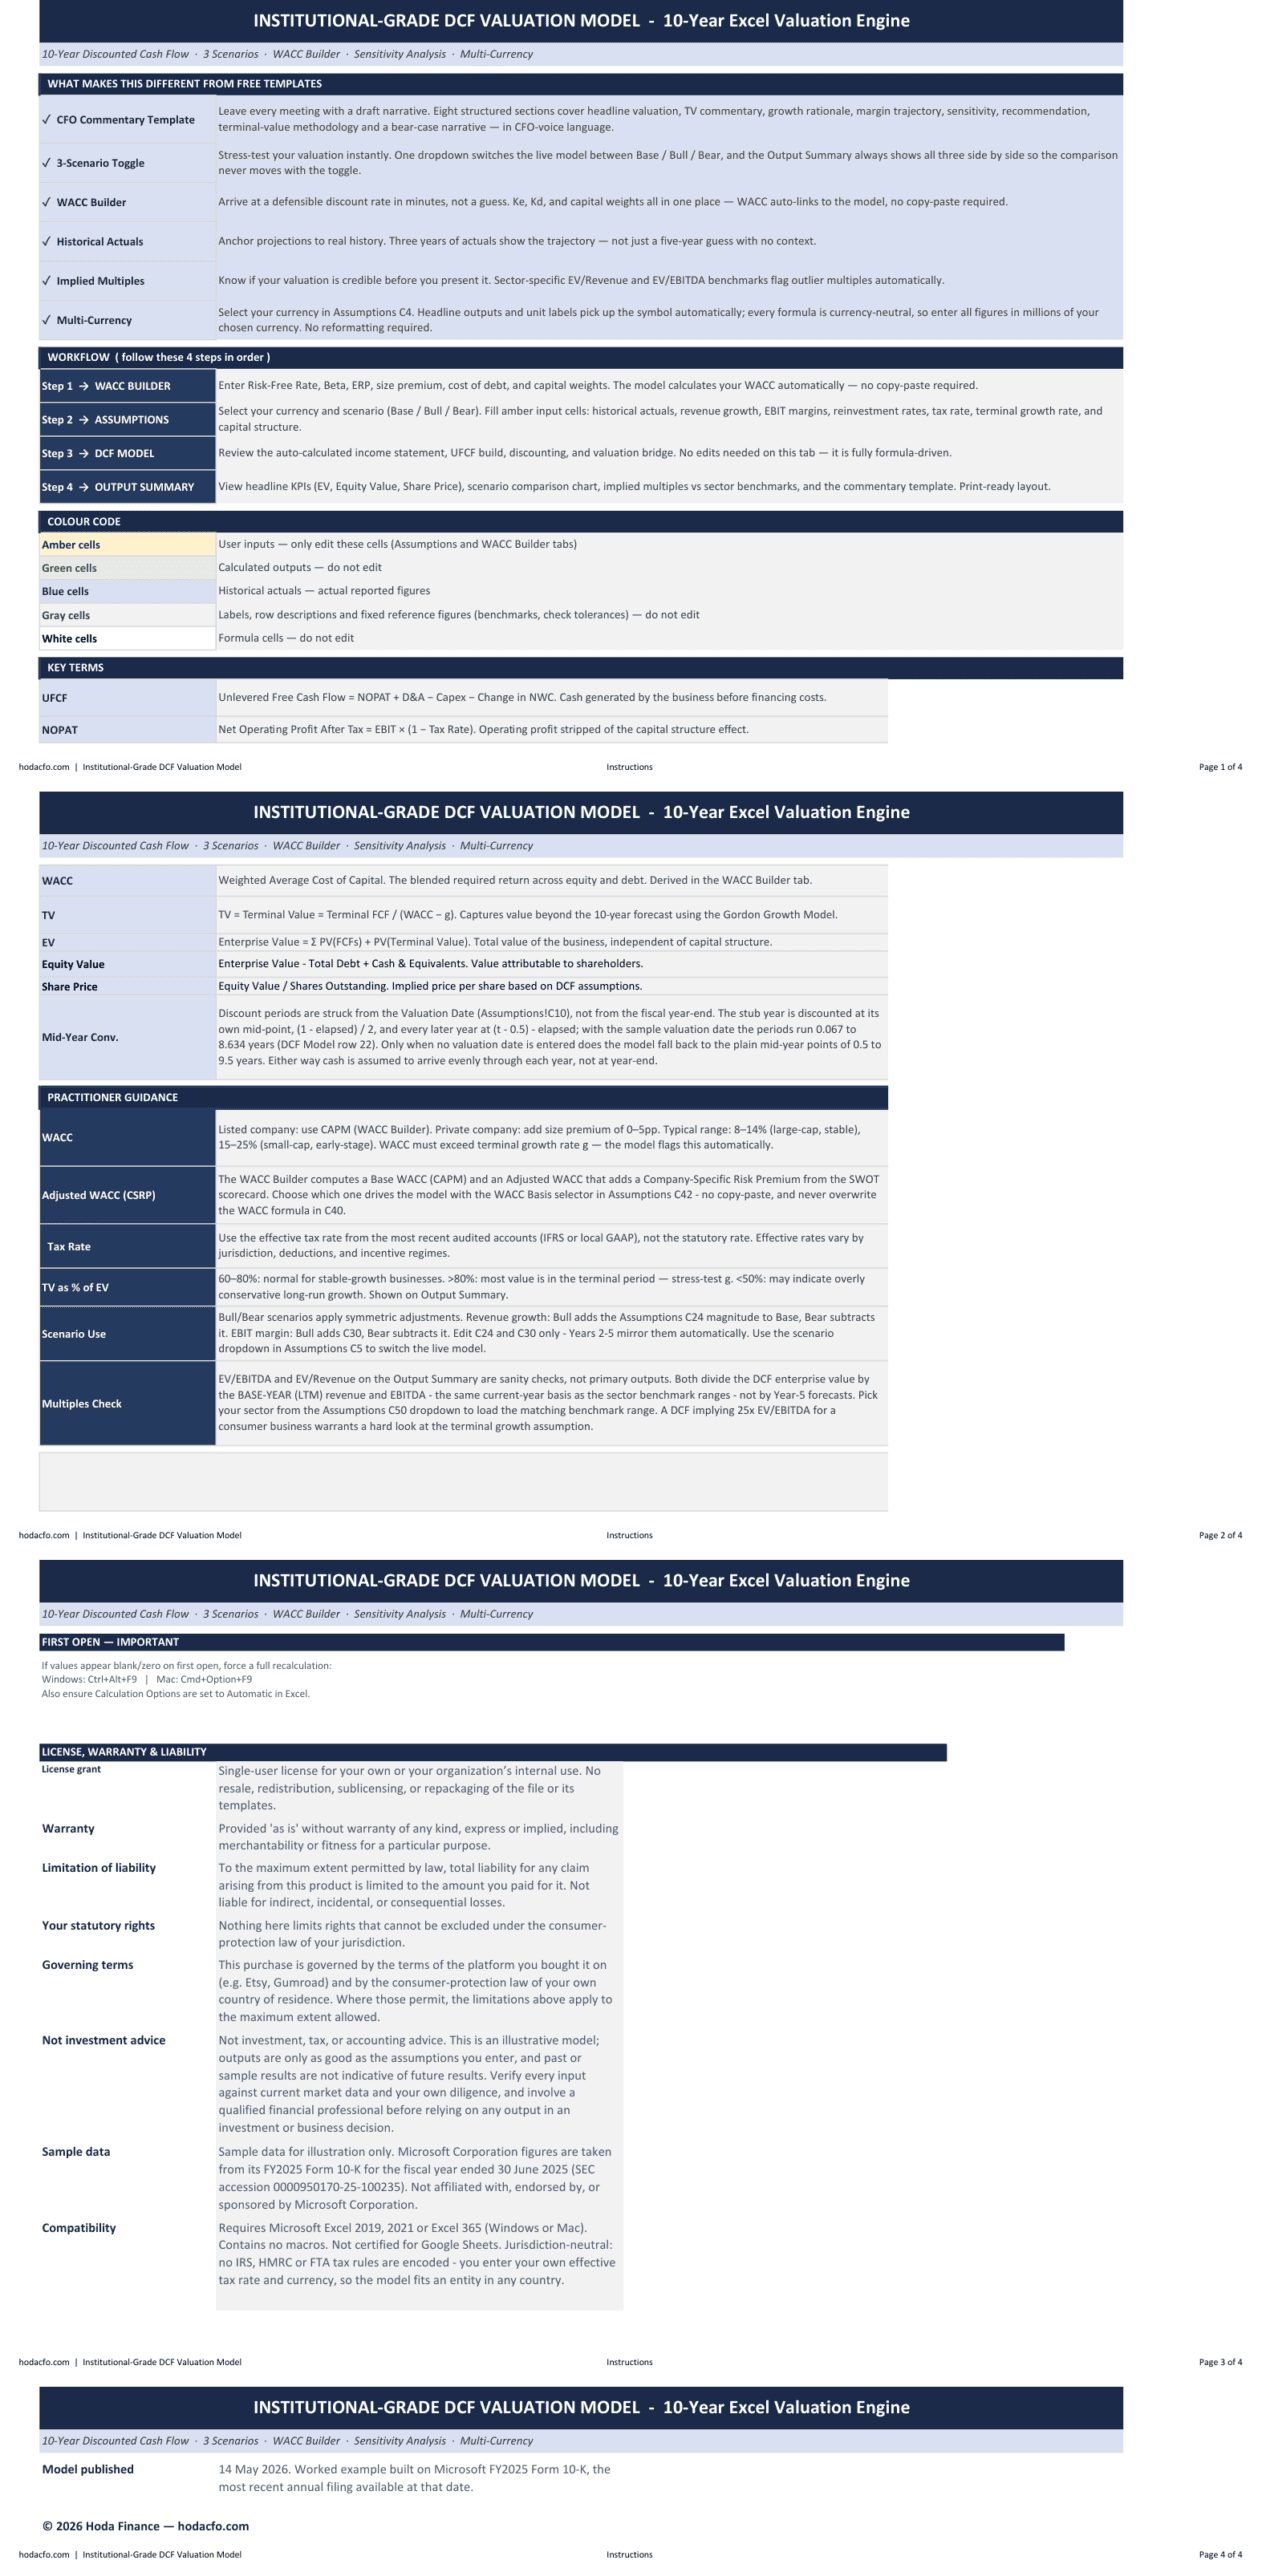
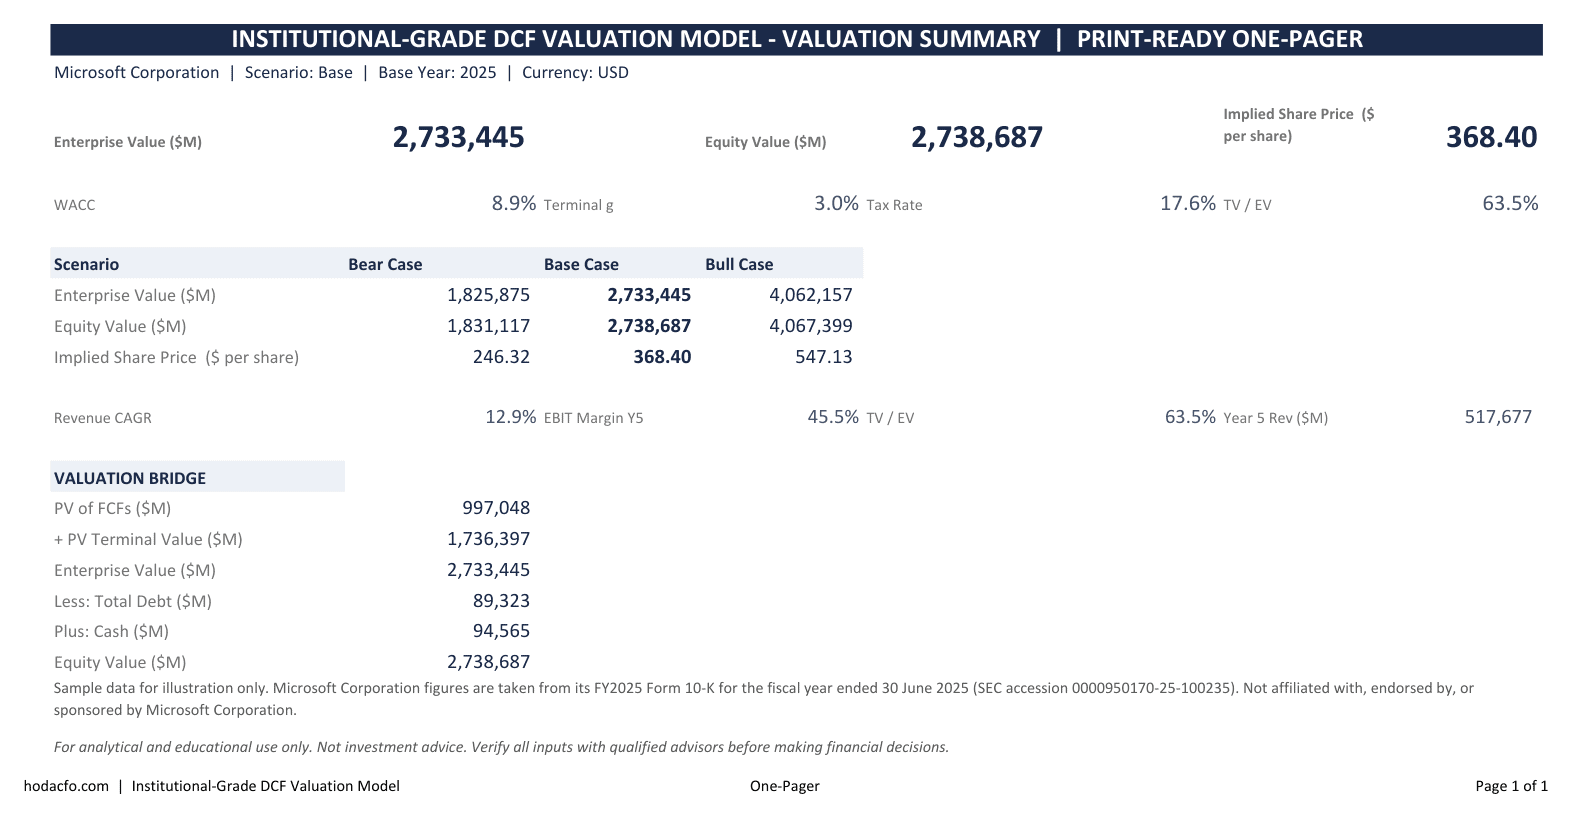
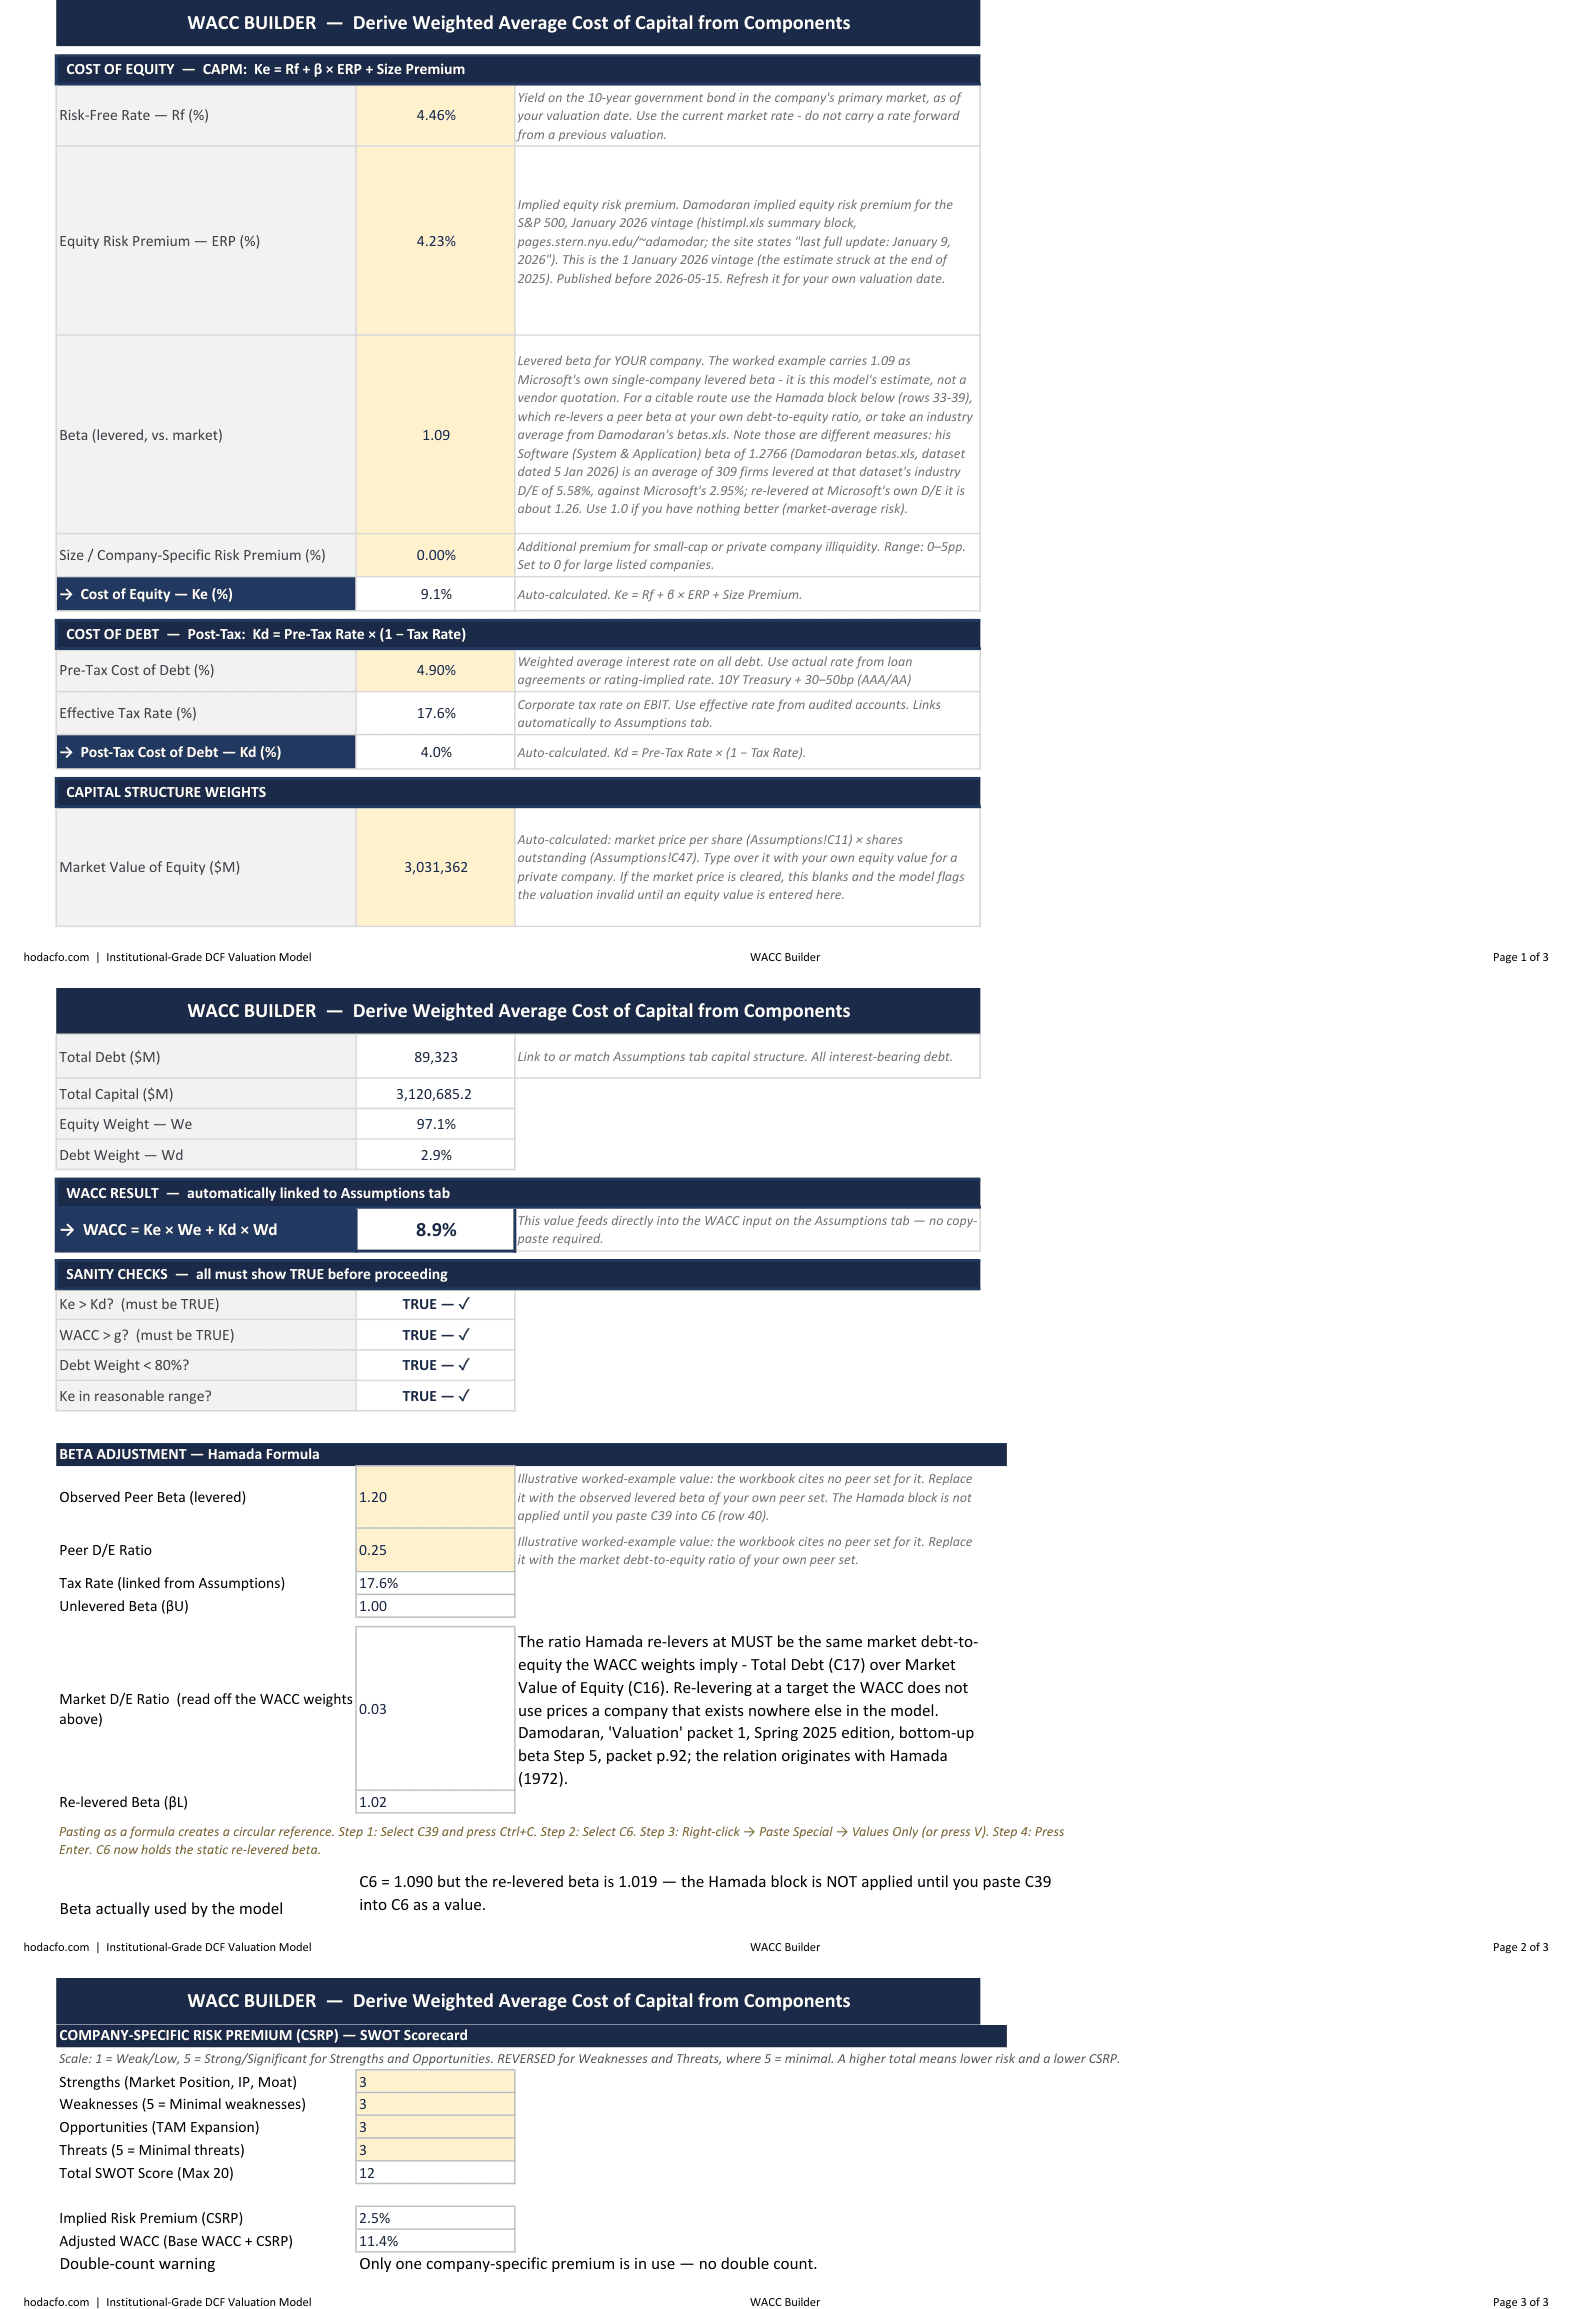
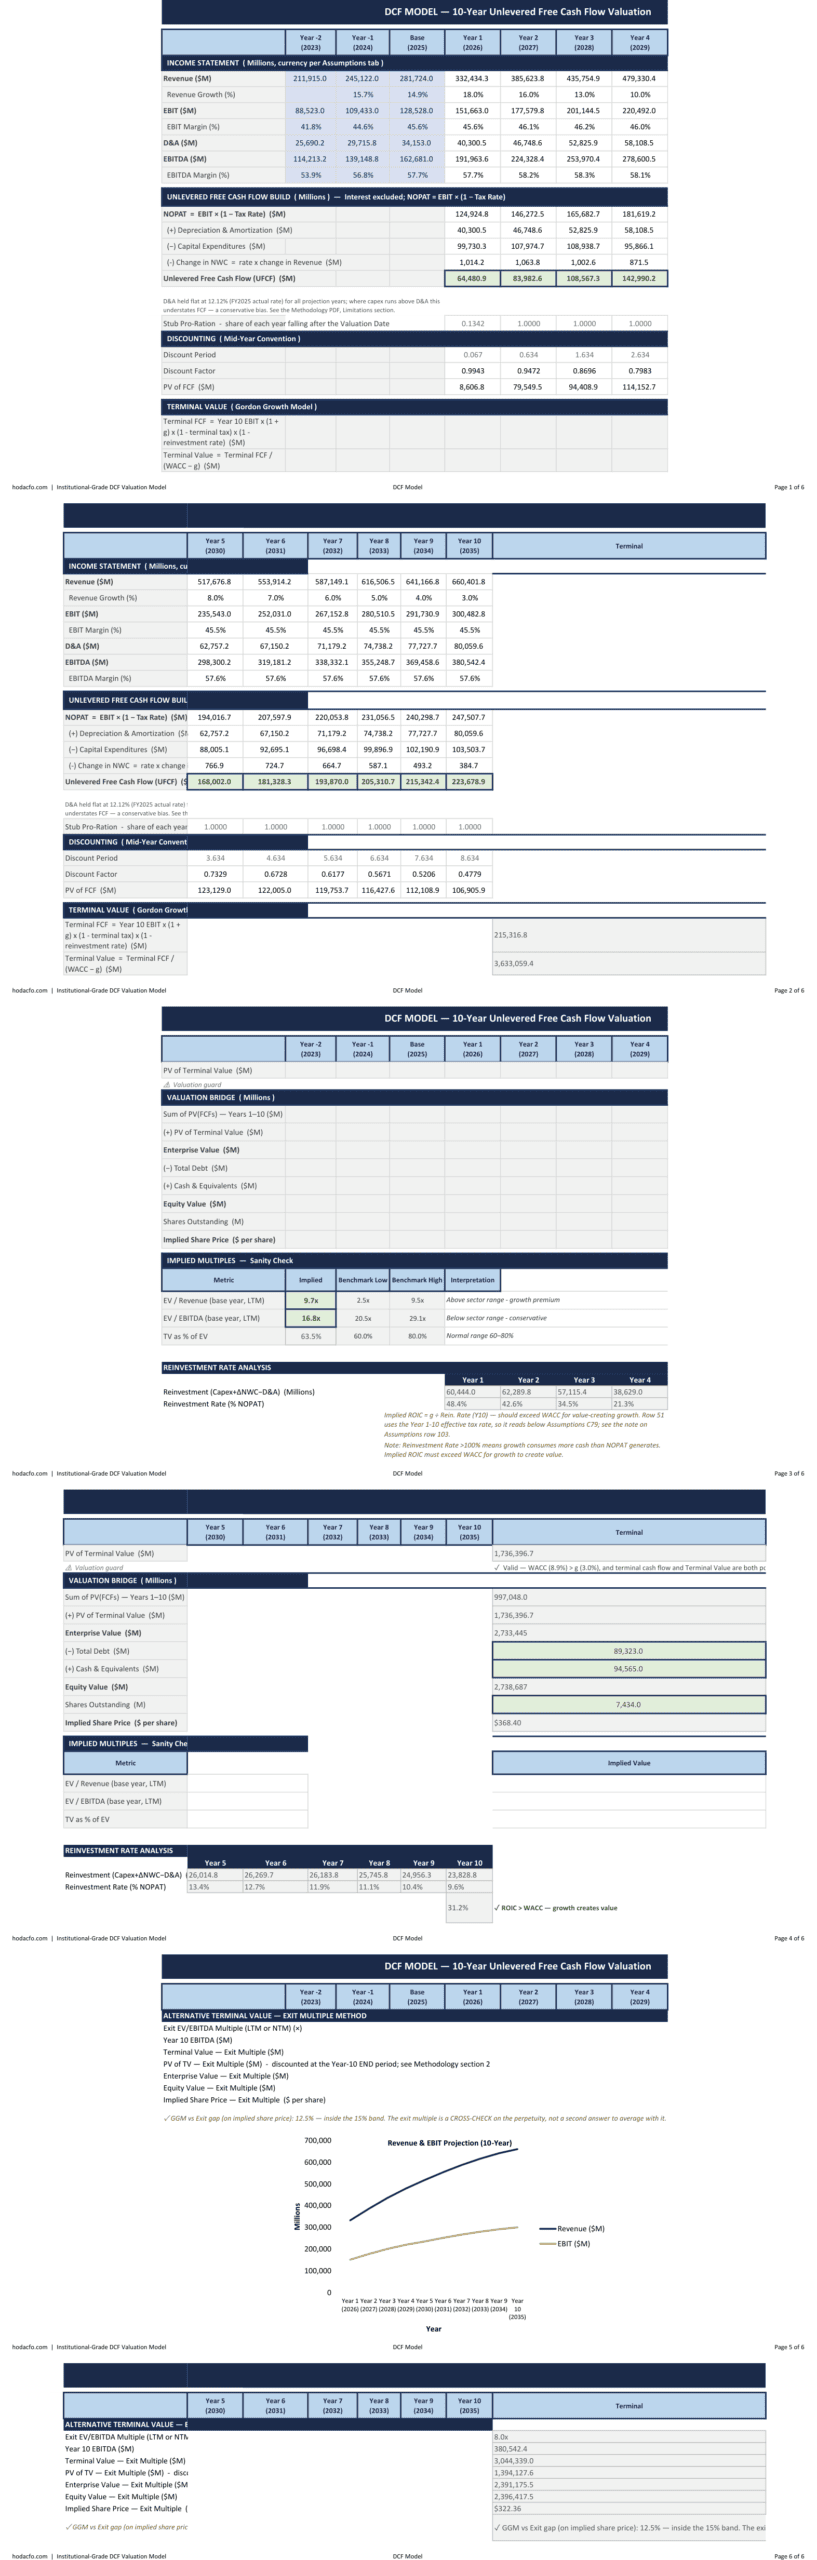
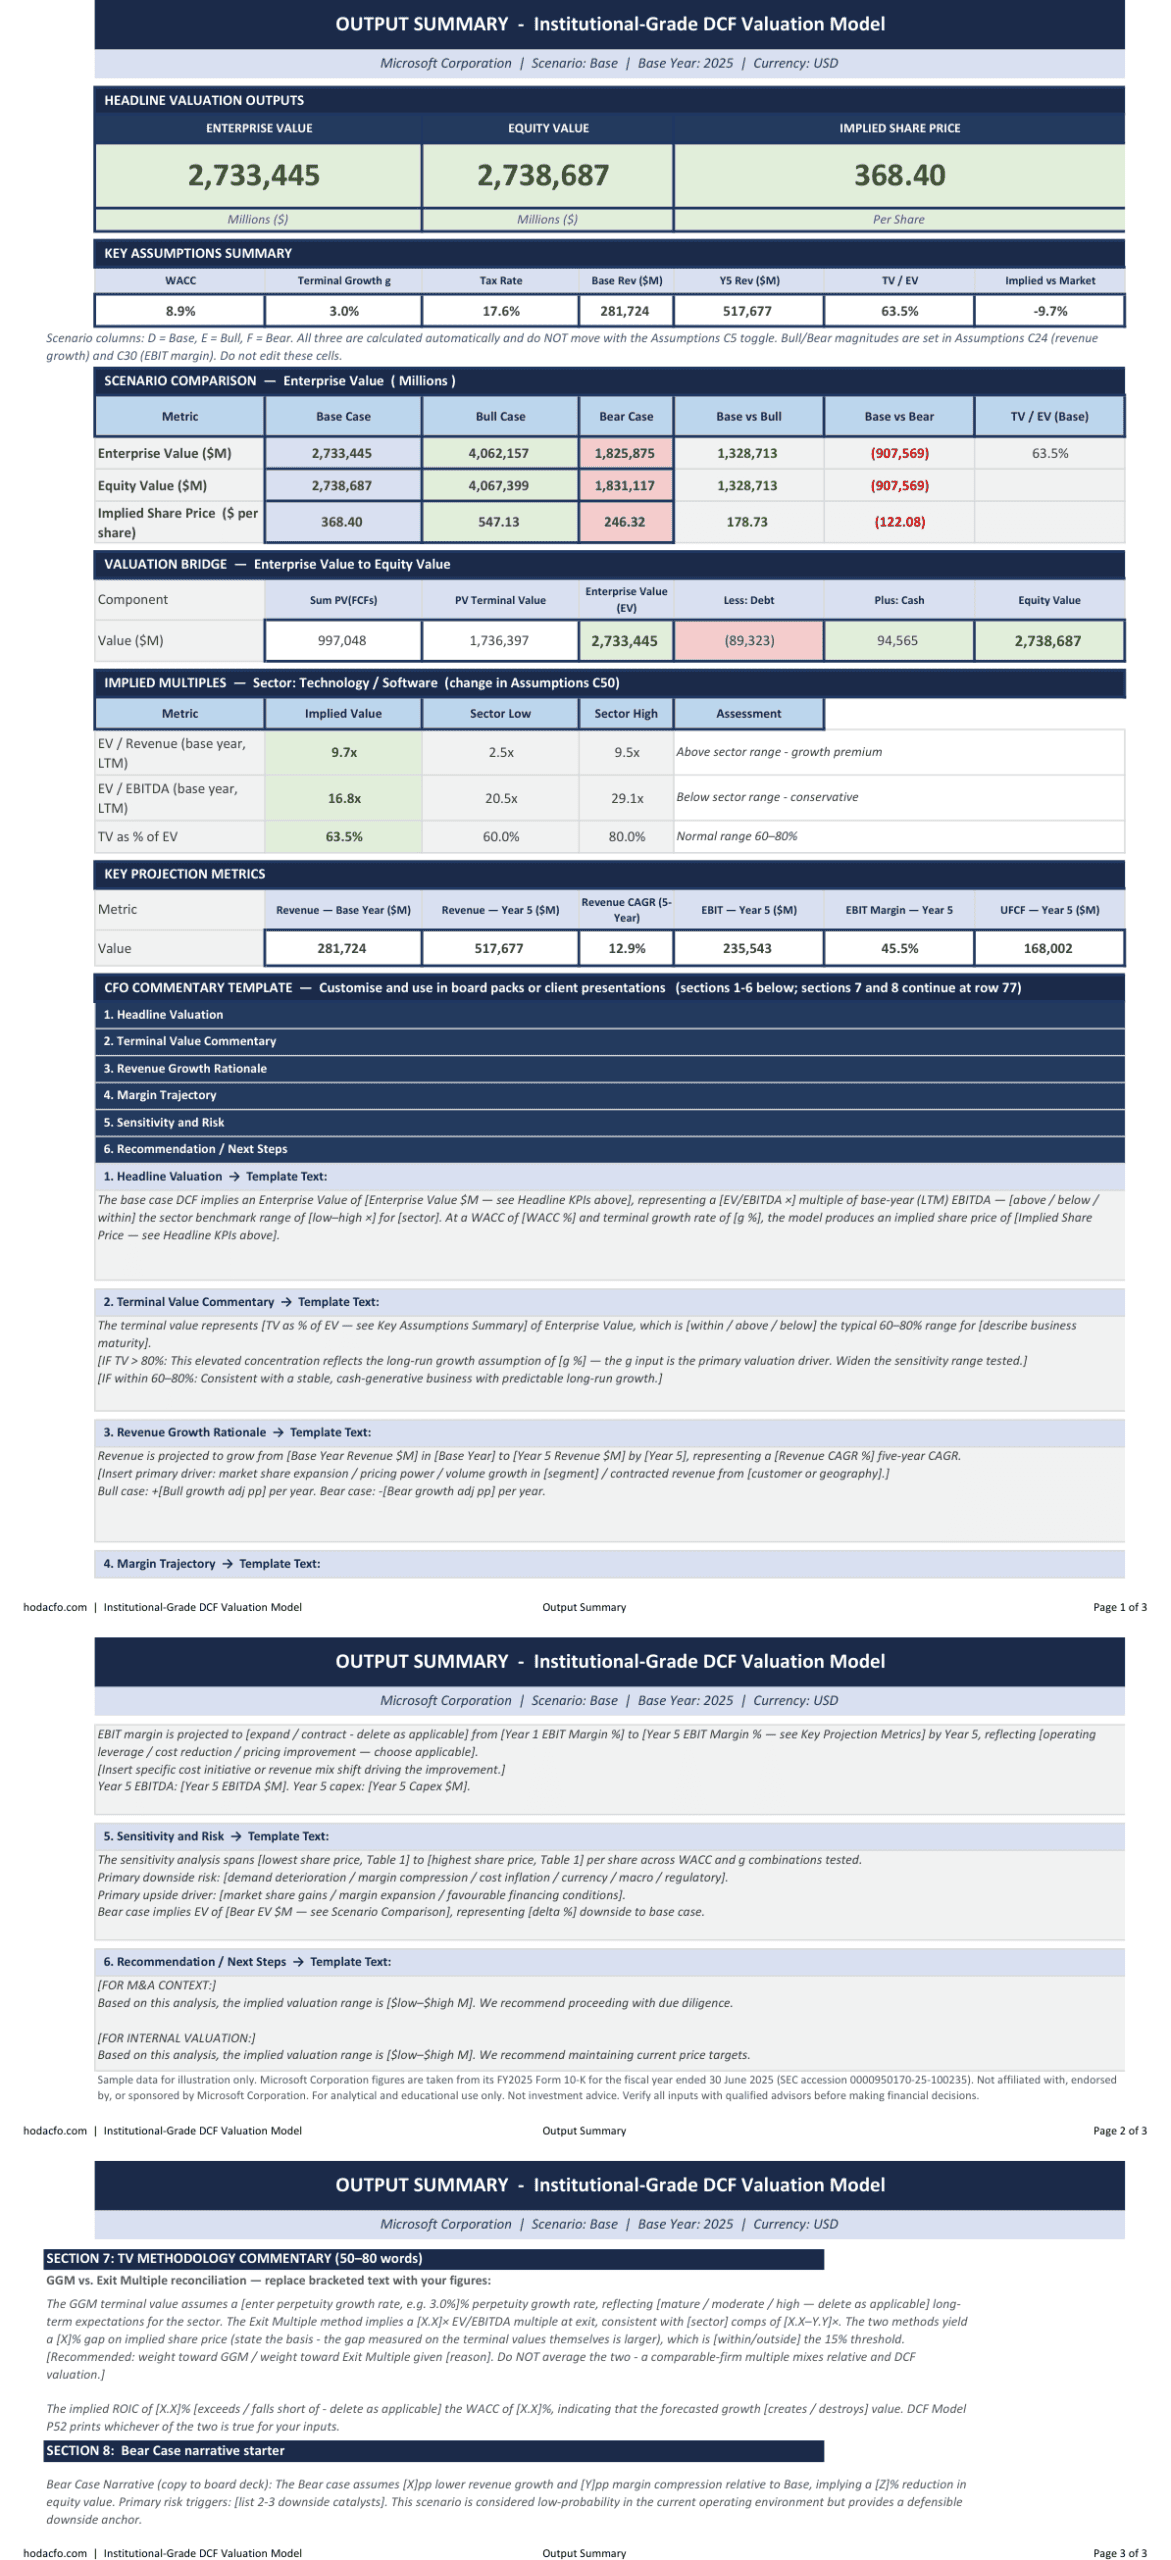
The Institutional-Grade DCF Valuation Model is a self-contained intrinsic-valuation engine for analysts, CFOs, M&A advisors and investors who have to put a defensible number in front of an investment committee, a board or a client. Enter revenue growth, margin, D&A, capex and working-capital assumptions plus a WACC built from sourced components, and the model produces a 10-year unlevered free cash flow projection with mid-year discounting, a guarded Gordon Growth terminal value cross-checked against an exit multiple, Base/Bull/Bear scenarios, two sensitivity grids that are checked back against the live model — Table 2 by a verdict line on its own tab, Table 1 by check 24 on the Checks tab — implied multiples against published sector aggregates, and a board-ready one-pager and dashboard. It ships pre-filled with a complete, tied-out Microsoft Corporation worked example in which every market input is dated on the workbook’s own DATA AS-OF block and named to its source in the accompanying Methodology PDF, and the single modelling assumption – the levered beta – is documented in that PDF as an assumption, with the providers whose published regressions differ named so you can re-derive it for your own valuation date. The workbook’s own beta cell says so on its face: its note (WACC Builder!D6) states that the worked-example beta is this model’s estimate rather than a vendor quotation, and points to the Hamada block and Damodaran’s industry betas as the citable routes; the sourcing itself lives in the Methodology PDF.
**Method**
Unlevered free cash flow is built as NOPAT (EBIT × (1 − tax)) plus D&A, less capex and the change in net working capital, discounted on the mid-year convention struck from the valuation date (periods 0.0671 to 8.6342). Terminal value follows the Gordon Growth Model — Year-10 EBIT × (1 + g) × (1 − terminal tax) × (1 − reinvestment rate) / (WACC − g) — behind a guard that returns an explicit error rather than a nonsense number if g reaches WACC, and is cross-checked against an EV/EBITDA exit multiple with an automated divergence flag. The enterprise-to-equity bridge deducts total debt and adds cash and equivalents; the implied share price divides by shares outstanding. The WACC Builder assembles CAPM cost of equity (Ke = Rf + β × ERP + Size Premium), post-tax cost of debt and market-value capital-structure weights, with a Hamada beta un-lever/re-lever block for private companies, a company-specific risk premium (0–5%) derived from a structured SWOT scorecard, and four automated sanity checks. A reinvestment-rate block compares implied ROIC with WACC so terminal growth can be defended rather than asserted. The scenario system computes the Base case unconditionally in its own block, so the Base/Bull/Bear comparison is always live regardless of which scenario the toggle shows.
**Verification**
The arithmetic is checked, not assumed — and re-checked on the bytes you receive. On the shipping workbook, sha256[:16] 6df9a6e4ffd73b6f: an Excel full rebuild across all 12 tabs reports zero error cells; the golden case — an oracle reconstructed in Python from the FY2025 10-K input set without reading a single spreadsheet formula — reproduces 18 of 18 stored answers within tolerance, largest absolute difference 0; and the valuation was rebuilt independently outside Excel from the input cells alone, reproducing 13 headline figures and all 84 sensitivity-grid cells with a worst relative difference of 1.9e-15. The workbook’s own Checks tab ties 27 blocking checks live, including the headline enterprise value and implied share price against the separate scenario engine that feeds the summary tabs, and Sensitivity Table 1’s centre cell against the live model (check 24). Table 2 carries three further ties of its own on the Sensitivity Analysis tab, printed there as a verdict line — four grid tie points in all, each a tolerance test, the largest gap measured at 2.3e-10. Those checks are themselves mutation-tested: 21 defects were seeded into the workbook in Excel — a text discount rate, a broken scenario link, a terminal growth rate one part in ten million below the WACC — and every one was caught. An independent reconstruction of enterprise value, equity value and implied share price outside Excel reproduces the workbook’s stated figures exactly.
**What it contains (12 tabs)**
Cover · Quick Start · Instructions · WACC Builder · Assumptions · DCF Model · Sensitivity Analysis · One-Pager · Executive Dashboard · Output Summary · Checks · AI Prompts.
The Output Summary carries the headline outputs, a three-scenario comparison computed in parallel (so it does not move with the live scenario toggle), the valuation bridge, implied EV/Revenue and EV/EBITDA on the base year (LTM) against published Damodaran sector aggregates (sector selectable by dropdown), a Share Price by Scenario bar chart, and an 8-section CFO Commentary Template in practitioner register. The workbook holds four native Excel charts in total: a 10-year Revenue & EBIT line chart on the DCF Model tab and the scenario bar chart on the Output Summary, both repeated on the Executive Dashboard. The AI Prompts tab holds five structured prompts — Investment Memo Generation, ROIC & Growth Defense, Sensitivity Table Narrative, Bear Case Narrative, and Terminal Value Defense — each with a role assignment, exact cell-copy instructions and anti-hallucination guardrails, two of them (Investment Memo, Sensitivity Table Narrative) also specifying the output format; they work by pasting into ChatGPT, Claude or Copilot, with no API or subscription.
**Worked example (included, tied out)**
Microsoft Corporation, FY2025 Form 10-K (SEC accession 0000950170-25-100235), valued as at 12 May 2026. Revenue $211,915M → $245,122M → $281,724M; FY2025 EBIT $128,528M; effective tax 17.63%. WACC 8.93% (Ke 9.07% from Rf 4.46%, β 1.09, implied ERP 4.23%; post-tax Kd 4.04%). PV of FCFs $997,048.0M plus PV of terminal value $1,736,396.7M gives enterprise value $2,733,444.7M; adding cash of $94,565M and deducting debt of $89,323M gives equity value $2,738,686.7M over 7,434M shares — $368.40 per share against a $407.77 market close, a -9.7% implied-vs-market gap the model prints explicitly. Bear $246.32 / Bull $547.13; exit-multiple cross-check $322.36 at 8.0x; TV/EV 63.5%; sensitivity span $272.80–$598.52 across the WACC × growth grid. The risk-free rate is the 10-year government-bond yield at the valuation date — the Methodology PDF sources it to the US Treasury daily yield-curve close — and the ERP is Damodaran’s published January 2026 implied premium. The accompanying Methodology PDF documents every input’s source; the workbook itself dates each anchor on the Checks tab. Figures quoted at the shipped default state: currency USD, scenario Base, WACC basis Base.
**Specification**
12 tabs · 1,638 formula cells · 4 charts · Excel 2019 / 2021 / 365 (Windows & Mac) · common functions only — no XLOOKUP, no LAMBDA, no LET, no dynamic arrays · no macros, no VBA · calculated cells locked with no password, amber inputs editable · multi-currency labels (USD, GBP, EUR, CAD, AUD) · sha256[:16] 6df9a6e4ffd73b6f · includes a 7-page Practitioner’s Guide PDF and a 12-page Methodology & Input Sources PDF · jurisdiction-neutral: no IRS, HMRC or FTA tax rules are encoded — you enter your own effective tax rate, so it fits entities in any country · your data stays with you: no macros, no external links, nothing transmitted — the AI prompts are text you paste into an AI tool under your own account
**Scope**
Covered: single-company intrinsic (DCF) valuation for public or private operating companies, 10-year horizon, scenario and sensitivity analysis, private-company WACC adjustment (a re-levered beta is pasted into the CAPM block as a value and the company-specific premium is switched in by the WACC Basis selector — two deliberate, visible steps the sheet spells out). Not covered: banks, insurers and financial institutions (an unlevered-FCF DCF is the wrong tool — use dividend-discount or excess-return methods), three-statement modelling, LBO or merger analysis, sum-of-the-parts consolidation, quarterly periodicity, real options/APV/DDM, FX translation. Excel only — not certified for Google Sheets.
ABOUT THE AUTHOR
Built by Hoda Elmorshidy — Financial Controller & Fractional CFO, in senior finance since 2017: IFRS reporting, FP&A, finance automation, Quantitative Analysis, Financial Modeling, and UAE VAT & Corporate Tax. Practitioner-grade tools, not generic templates.
DISCLAIMER
Not investment, tax, or accounting advice. This is an illustrative analytical model; outputs are only as good as the assumptions you enter, and past or sample results are not indicative of future results. Verify all inputs and assumptions with a qualified financial professional before use in any investment or business decision. Sample data for illustration only: Microsoft Corporation figures are from its FY2025 Form 10-K (SEC accession 0000950170-25-100235, fiscal year ended 30 June 2025), market anchor dated 12 May 2026; this product is not affiliated with, endorsed by, or sponsored by Microsoft Corporation.
LICENSE & LIABILITY
LICENSE GRANT: Single-user license for your own or your organization’s internal use. No resale, redistribution, sublicensing, or repackaging of the file or its templates.
AS IS: Provided “as is” without warranty of any kind, express or implied, including merchantability or fitness for a particular purpose.
LIMITATION OF LIABILITY: To the maximum extent permitted by law, total liability for any claim arising from this product is limited to the amount you paid for it. Not liable for indirect, incidental, or consequential losses.
NON-WAIVABLE RIGHTS: Nothing here limits rights that cannot be excluded under the consumer-protection law of your jurisdiction.
GOVERNING LAW: This purchase is governed by the terms of the platform you bought it on and by the consumer-protection law of your own country of residence. Where those permit, the limitations above apply to the maximum extent allowed.
REFUNDS & FIXES: This is an instant digital download, sold on a fix-first basis rather than a returns basis. If something is genuinely wrong with the file — it will not open, a formula returns an error, a tab or feature described on this page is missing, or a stated calculation is wrong — contact me through the platform you bought on, or email [email protected], with your order number and a screenshot. If something genuinely cannot be fixed, I will tell you so plainly rather than leave it open. Change-of-mind refunds are not offered: the file is delivered in full and immediately, and the scope is set out before you buy, so you can check the fit first. Outputs that depend on your own assumptions, and anything listed as out of scope, are not defects. Nothing here limits rights that cannot be excluded under the consumer-protection law of your country, and the terms of the platform you bought on also apply.
TRADEMARKS & NON-AFFILIATION: Microsoft, Excel and Copilot are trademarks of Microsoft Corporation. This product is an independent analytical tool: it is NOT affiliated with, endorsed by, or sponsored by Microsoft Corporation, and Microsoft’s publicly filed figures are used solely as a worked example. Windows is a trademark of Microsoft Corporation; Mac and macOS are trademarks of Apple Inc.; Google Sheets is a trademark of Google LLC; ChatGPT is a trademark of OpenAI; Claude is a trademark of Anthropic; Etsy is a trademark of Etsy, Inc.; Gumroad is a trademark of Gumroad, Inc. — none is affiliated with this product. References to Damodaran datasets, the US Treasury yield curve, SEC EDGAR/XBRL and other public sources are source attributions only and imply no affiliation or endorsement.
Similar ProductsOther customers were also interested in...



 eFinancialModels
Electric Vehicle (EV) Charging Station Financial M...
With this comprehensive 5- or 10-year monthly tool, investors can assess the viability of setting up... Read more

Financial Model for Mobile App | Mobile App Busine...
The Mobile App Financial Plan Template in Excel allows you to develop financial projections when lau... Read more

 HenrySheykin
Food Truck Financial Model Excel Template
The Food Truck Financial Model helps entrepreneurs, founders, business owners, consultants, and anal... Read more

Green Hydrogen Production from Wind Energy Financi...
The Green Hydrogen from Wind Financial Model aims to comprehensively forecast a horizon of 40 years ... Read more

Simple Mutual Non-Disclosure Agreement Template
Protect your business secrets with ease using our Simple Mutual Non-Disclosure Agreement Template. S... Read more

Solar Energy Financial Model
The Solar Energy Financial Model Spreadsheet Template in Excel assists you in preparing a sophistica... Read more

 Peter Graf
The Customer-Centric Financial Model for Restauran...
Starting a restaurant without a financial plan is like driving a car blindfolded. You wouldn´t do i... Read more
You must log in to submit a review.