
0 ITEMS

Ice Cream Truck Financial Model Excel Template
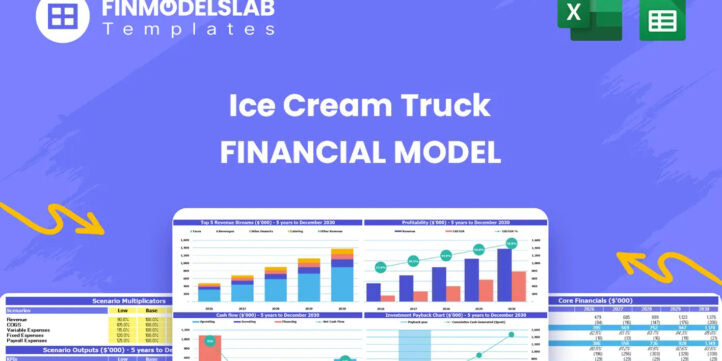
The Ice Cream Truck Financial Model helps entrepreneurs and planners turn a mobile dessert business idea into a structured five-year financial forecast. Instead of starting with a blank spreadsheet, users can work from a ready-to-use model built around the practical drivers of an ice cream truck operation, including customer traffic, average order value, weekday and weekend sales patterns, private events, product mix, operating expenses, payroll, startup costs, cash flow, and profitability. It is designed to help users understand how the business may perform before investing in a truck, equipment, inventory, staff, permits, marketing, or expansion. This financial model template is useful for founders, business owners, consultants, analysts, accountants, and anyone preparing an ice cream truck business plan, loan application, investor presentation, or internal budget. The model gives users a clear place to enter assumptions and review the resulting financial statements, charts, KPIs, and performance metrics. It supports practical decision-making by showing how pricing, customer volume, costs of goods sold, staffing, fixed expenses, and capital investment can affect revenue, margins, cash flow, break-even timing, and long-term profitability. Because mobile food businesses can be seasonal, location-dependent, and highly sensitive to daily demand, this template helps users test the financial impact of different assumptions before making commitments. Users can compare conservative, expected, and upside scenarios, review whether projected sales can support the operating cost structure, and identify the funding needed to launch or grow the business. The model is fully editable, so assumptions can be adjusted for a single truck, multiple routes, event-based sales, catering bookings, different product categories, or local cost conditions. The Ice Cream Truck Financial Model is built for professional financial planning without requiring users to build formulas from scratch. It includes investor-ready outputs, bank-friendly reports, visual charts, dashboard summaries, revenue modeling, cash flow forecasting, profitability analysis, and break-even analysis. Whether the goal is to validate a new concept, secure financing, prepare a business plan, compare route strategies, or manage an existing operation, the template provides an organized framework for understanding the numbers and making more confident decisions.


Financial Model Overview
The Ice Cream Truck Financial Model is a ready-to-use financial model template designed to help entrepreneurs, business owners, consultants, and analysts plan the economics of a mobile ice cream and food truck business. It brings the key parts of the business into one structured forecast, including revenue assumptions, customer volume, average order value, product mix, operating expenses, payroll, capital expenditures, cash flow, profitability, and investor metrics. For an ice cream truck business, financial planning is especially important because results can vary by weekday and weekend traffic, event bookings, route quality, seasonality, menu pricing, inventory costs, and staffing decisions. This template gives users a practical way to replace guesswork with a more organized set of assumptions and outputs. Users can enter their own business data, adjust the pre-built assumptions, review five-year projections, and create reports that can support business planning, loan applications, investor discussions, budgeting, and day-to-day decision-making.
All-in-One Dashboard
The all-in-one dashboard gives users a central view of the most important inputs and outputs in the Ice Cream Truck Financial Model. Instead of searching through multiple tabs to understand the business, users can review core assumptions, financial summaries, and key results from one organized area. The dashboard may include revenue, gross profit, EBITDA, net income, cash balance, funding needs, payback timing, and other high-level indicators that show whether the business plan is financially realistic. For an ice cream truck, this is useful because owners need to quickly understand how customer traffic, average order value, daily sales patterns, costs of goods sold, staffing, and overhead translate into financial performance. The dashboard helps users monitor the overall business case, identify whether assumptions need to be adjusted, and communicate the financial story to partners, lenders, investors, or internal stakeholders. It is especially valuable during planning because it connects the model’s detailed calculations with a clear executive-level view of expected results.
Low, Base, and High Scenario Analysis
The low, base, and high scenario analysis component helps users evaluate how the ice cream truck business may perform under different operating conditions. A mobile food business can be affected by weather, location quality, weekend demand, special events, school calendars, tourism, competition, and customer spending behavior, so a single forecast may not be enough for serious planning. This section allows users to compare conservative, expected, and upside cases by changing drivers such as customer count, average order value, sales mix, event bookings, cost levels, payroll requirements, and operating efficiency. The outputs show how these changes affect revenue, profit margins, cash flow, funding needs, and overall financial stability. For business planning and investor preparation, scenario analysis helps demonstrate that the user understands both risk and opportunity. It can support better decision-making by showing what happens if traffic is lower than expected, if weekend demand is stronger than planned, or if costs rise. This makes the template useful for stress-testing assumptions before committing capital.
Professional Charts
The professional charts component turns financial data into clear visual reports that are easier to review, explain, and present. In an ice cream truck business plan, charts can help show revenue growth, cost behavior, profitability trends, cash flow movement, customer volume, margin development, and other financial metrics over time. This matters because lenders, investors, partners, and internal decision-makers often need to understand the business quickly without reading every formula or line item. The charts can translate the model’s assumptions and calculations into presentation-ready visuals that support funding documents, strategy reviews, and management discussions. Users can use these charts to identify trends, compare performance across years, and highlight the relationship between sales, costs, and cash generation. For example, a chart may reveal whether revenue growth is being supported by healthy margins or whether operating expenses are increasing too quickly. By making the forecast more visual, this component helps users communicate the financial case for the ice cream truck more confidently and professionally.
ROE Components and DuPont Analysis
The ROE components and DuPont analysis section helps users understand the drivers behind return on equity rather than looking only at a single profitability figure. This type of analysis breaks return performance into underlying elements such as profit margin, asset efficiency, and financial leverage, helping users see how the business creates returns for owners or investors. For an ice cream truck business, this can be useful because the model may include meaningful upfront investment in the vehicle, kitchen equipment, systems, inventory, branding, and launch preparation. The DuPont view helps users evaluate whether returns are coming from strong operating margins, efficient use of assets, or the way the business is financed. Inputs may be connected to net income, revenue, total assets, equity, debt assumptions, and balance sheet outputs. The resulting analysis is useful for investor discussions, internal decision-making, and business plan refinement because it shows not just whether the business is profitable, but how efficiently it uses capital. This can help users assess whether expansion, debt financing, or additional trucks would improve or weaken overall returns.
Revenue Inputs
The revenue inputs component is where users define the assumptions that drive sales for the ice cream truck business. These inputs may include weekday and weekend customer counts, average order value, sales days, event activity, catering bookings, product categories, pricing, revenue mix, and growth rates over the forecast period. Because mobile food revenue depends heavily on traffic and transaction size, this section gives users a practical way to model how the business makes money. Users can adjust assumptions for different route strategies, local demand levels, school or park locations, festivals, private parties, corporate events, or seasonal operating schedules. The outputs from this section feed into the revenue forecast, profit and loss statement, cash flow projection, and dashboard. This is valuable because small changes in customer volume or average order value can have a major effect on profitability and break-even timing. By organizing revenue assumptions in a clear and editable format, the template helps users build a more realistic sales forecast and test whether the business can support its planned cost structure.
Bank-Ready Reports
The bank-ready reports component provides organized financial outputs that can support lender discussions, loan applications, and professional business plan submissions. Banks and financing partners typically want to see clear financial statements, logical assumptions, funding requirements, cash flow projections, profitability expectations, and repayment capacity. This section helps users present the Ice Cream Truck Financial Model in a format that is easier for lenders and stakeholders to review. It may include summaries of revenue, expenses, profit and loss, cash flow, balance sheet outputs, startup investment, debt assumptions, and key financial metrics. For an ice cream truck business, bank-ready reporting is useful because financing may be needed for the truck, equipment, initial inventory, permits, marketing, working capital, and other launch costs. A clean report structure helps show how the requested funding will be used and whether the business is projected to generate enough cash to operate and service obligations. This component saves time and helps users move from informal planning to more polished financial documentation.
Revenue Breakdown
The revenue breakdown component gives users a more detailed view of how total sales are built across the business. Rather than showing only one revenue number, this section may separate income by product category, customer segment, sales channel, event type, or operating period. For an ice cream truck, revenue may come from ice cream and frozen desserts, beverages, packaged snacks, food items, private events, catering, weekend festivals, and high-traffic routes. Breaking revenue into separate streams helps users understand which parts of the business contribute the most to sales and which may offer better margins or growth opportunities. Inputs may include the percentage of revenue by stream, pricing assumptions, transaction volume, frequency of events, and annual growth rates. The outputs help users evaluate the quality of revenue, identify reliance on specific categories, and adjust strategy accordingly. This is useful for planning menu design, route selection, marketing campaigns, inventory purchasing, staffing levels, and event outreach. It also improves the credibility of the forecast because stakeholders can see the logic behind total revenue projections.
KPI Dashboard
The KPI dashboard component focuses on the performance metrics that help users monitor the health of the ice cream truck business over time. Key performance indicators may include revenue growth, gross margin, EBITDA margin, net profit margin, customer volume, average order value, cash balance, burn rate, return metrics, break-even timing, and expense ratios. For a mobile ice cream truck operation, KPIs are valuable because owners need to track whether the business is converting foot traffic into profitable sales, whether product costs are under control, and whether operating expenses are aligned with revenue. This dashboard can also help compare projected performance against industry benchmarks or internal targets. Users can use the KPI view to identify weak points in the business plan, such as low margins, excessive payroll, insufficient event revenue, or cash pressure during the launch phase. For consultants and analysts, KPI reporting makes it easier to summarize conclusions for clients or stakeholders. For founders and operators, it supports practical decision-making by turning detailed financial data into measurable performance targets.
Startup Cost and CAPEX Schedule
The startup cost and CAPEX schedule helps users estimate the initial investment required to launch or expand an ice cream truck business. This section may include the truck purchase or lease setup, vehicle customization, refrigeration equipment, kitchen equipment, point-of-sale systems, branding, signage, permits, licenses, initial inventory, packaging, insurance deposits, marketing launch costs, working capital, and other pre-opening expenses. It may also separate one-time capital expenditures from ongoing operating expenses, which is important for understanding how much funding is needed before the business starts generating revenue. The outputs from this schedule can feed into the balance sheet, depreciation calculations, cash flow forecast, funding requirement analysis, and investor returns. For planning purposes, this component helps users avoid underestimating the cost of getting operational. For lender or investor presentations, it shows how capital will be allocated and why the requested funding amount is reasonable. Because ice cream truck businesses often require both vehicle investment and food service equipment, a detailed startup cost schedule is essential for building a credible launch plan.
Break-Even Analysis
The break-even analysis component helps users estimate when the ice cream truck business can generate enough revenue to cover its fixed and variable costs. This section may use assumptions such as sales volume, average order value, cost of goods sold, payroll, rent or commissary fees, insurance, fuel, maintenance, marketing, permits, and other overhead expenses. The outputs can show the monthly or annual revenue required to break even, the number of customers or orders needed, and the timing of profitability based on the forecast. For an ice cream truck business, this is especially useful because profitability can depend on weekend performance, event bookings, route quality, and product margins. Understanding break-even helps users set sales targets, evaluate pricing, control costs, and decide whether the business model is viable before launching. It also supports funding discussions because investors and lenders often want to know how quickly the business can become self-sustaining. By connecting revenue assumptions with the cost structure, this component gives users a practical benchmark for managing risk and measuring progress.
File types:
Excel – Single-User: .xlsx
Excel – Multi-User: .xlsx
Similar ProductsOther customers were also interested in...


 HenrySheykin
Coffee Shop Financial Model Excel Template
The Coffee Shop Financial Model helps entrepreneurs, founders, business owners, consultants, and ana... Read more
Pizzeria Financial Model Excel Template
The Pizza Restaurant Financial Model Template helps entrepreneurs, restaurant owners, consultants, a... Read more

Food Truck Financial Model Excel Template
The Food Truck Financial Model helps entrepreneurs, founders, business owners, consultants, and anal... Read more
Gourmet Food Store Financial Model Excel Template
The Gourmet Food Store Financial Model helps entrepreneurs, founders, business owners, consultants, ... Read more
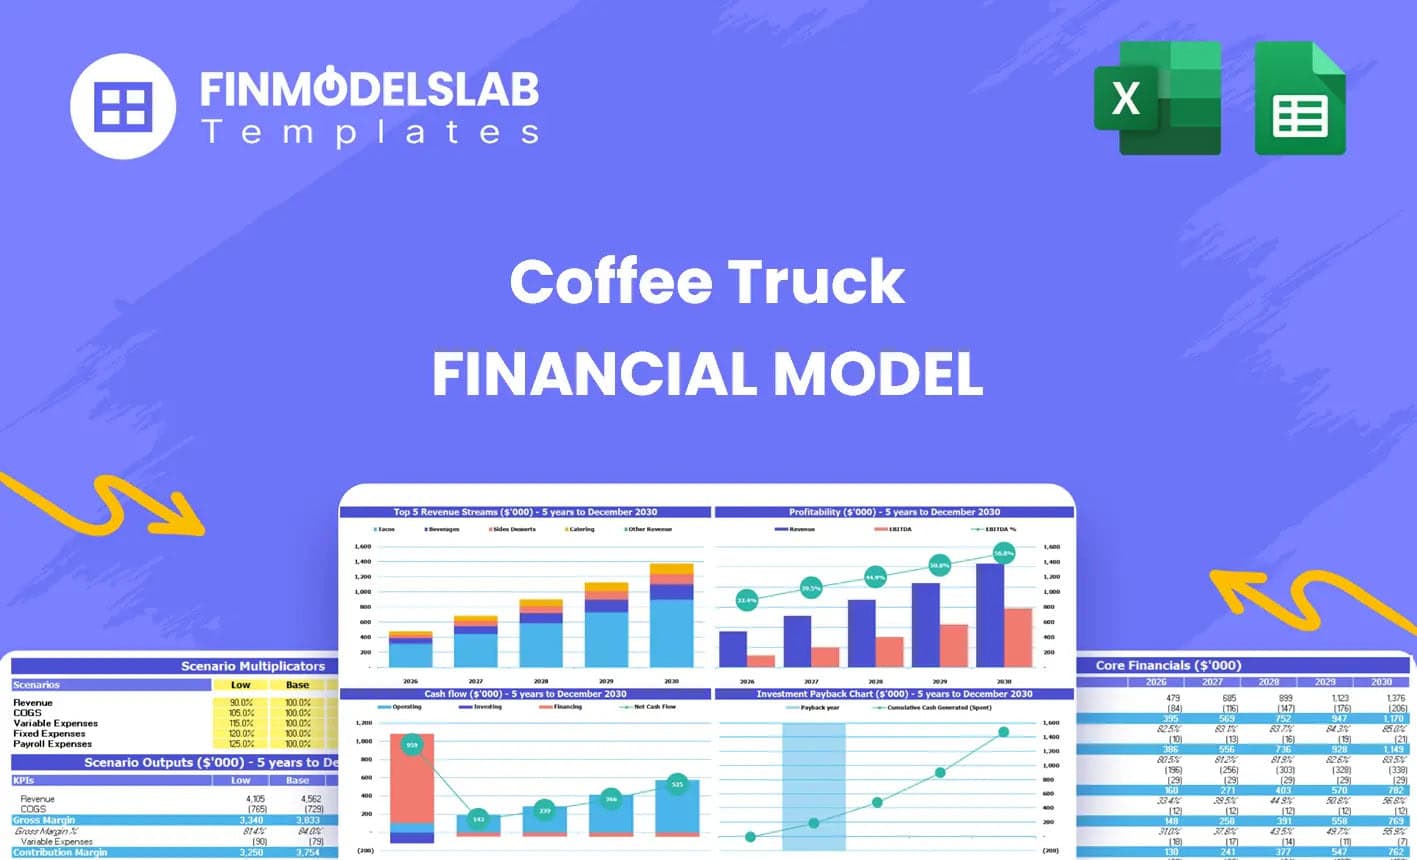
Coffee Truck Financial Model Excel Template
The Coffee Truck Financial Model Template helps entrepreneurs, founders, consultants, and business p... Read more
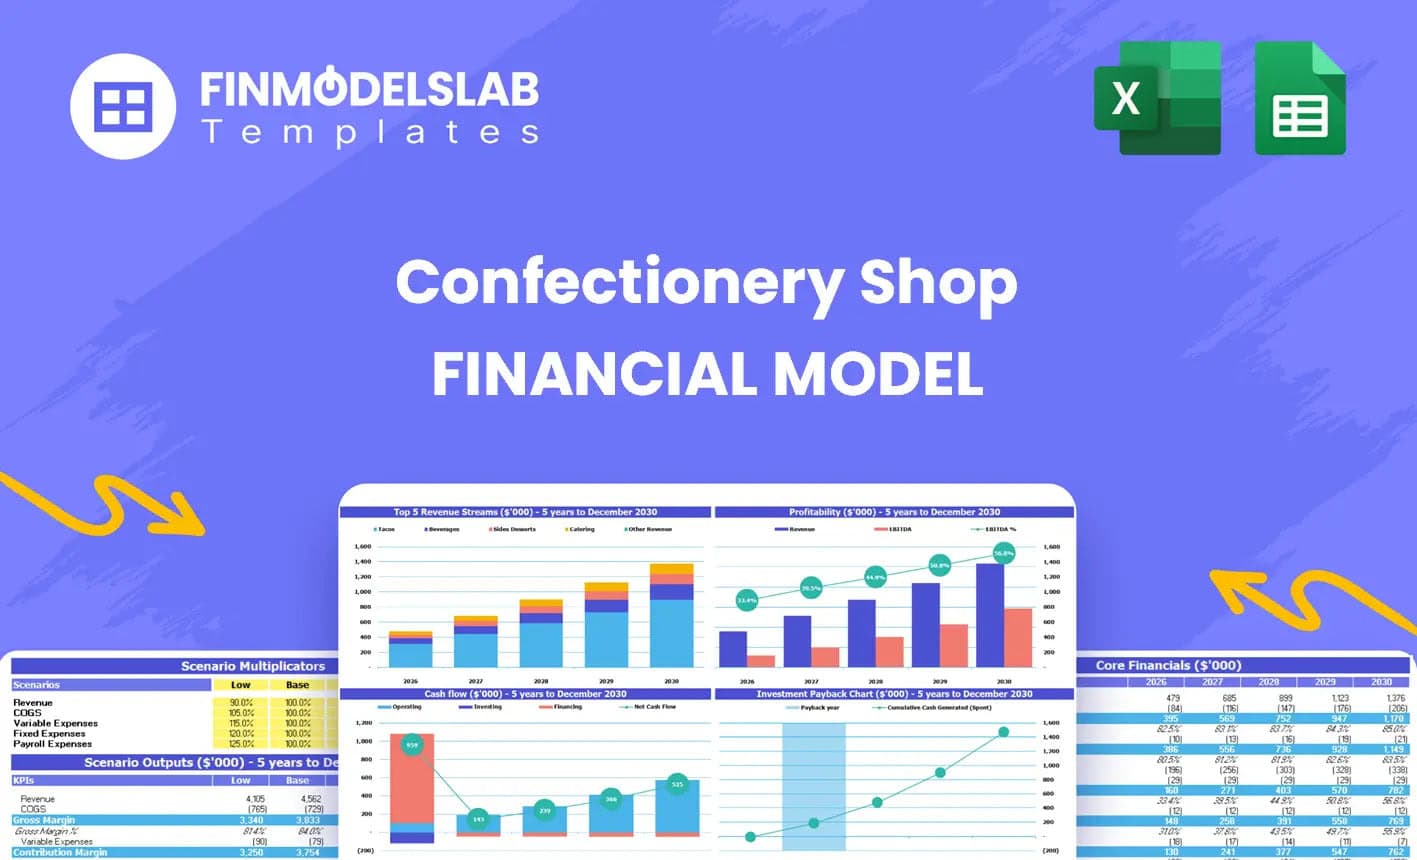
Confectionery Shop Financial Model Excel Template
The Confectionery Shop Financial Model helps turn a candy shop, sweet shop, dessert retail concept, ... Read more

Coffee And Snack Financial Model Excel Template
The Coffee and Snack Shop Financial Model helps entrepreneurs, founders, business owners, consultant... Read more
 Pushkar
Pizzeria – 3 Statement Financial Model with ...
This Pizzeria business Plan Model is a perfect tool for a financial feasibility study on launching a... Read more
BAKERY – 3 Statement Financial Model with 5 ...
This Bakery Business Plan Model is a perfect tool for a financial feasibility study on launching a B... Read more
 Giorgos
Food Truck Financial Model – 5 Year Financial Fo...
This Financial Model presents an advanced 5-year financial plan for a startup or operating Food Truc... Read more
You must log in to submit a review.