
0 ITEMS

Gross Profit Margin (GP%) Decomposition & Scenario Analysis Excel Model
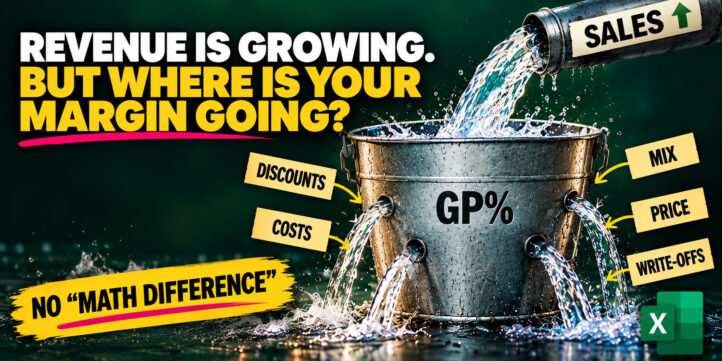
Revenue is growing — but where is your margin going? Find exactly what is creating or destroying your GP% — without an artificial “Math Difference”. Use the model in two ways: explain what is driving margin today, or model Price, D&A, Mix and Cost changes to see what happens tomorrow — and what it takes to protect your margin.
Revenue is growing — but where is your margin going?
Sales can increase while Gross Profit Margin quietly deteriorates. Cost inflation can absorb your pricing. Higher discounts can drive volume while destroying margin. An unfavorable mix can make revenue look healthy while profitability moves in the opposite direction.
In a constantly changing business environment, knowing revenue and Gross Profit is not enough. You need to understand what is driving your GP% today — and what could happen tomorrow.
The Gross Profit Margin (GP%) Decomposition & Scenario Analysis Excel Model is built to do both.
1. Understand what is driving your margin TODAY
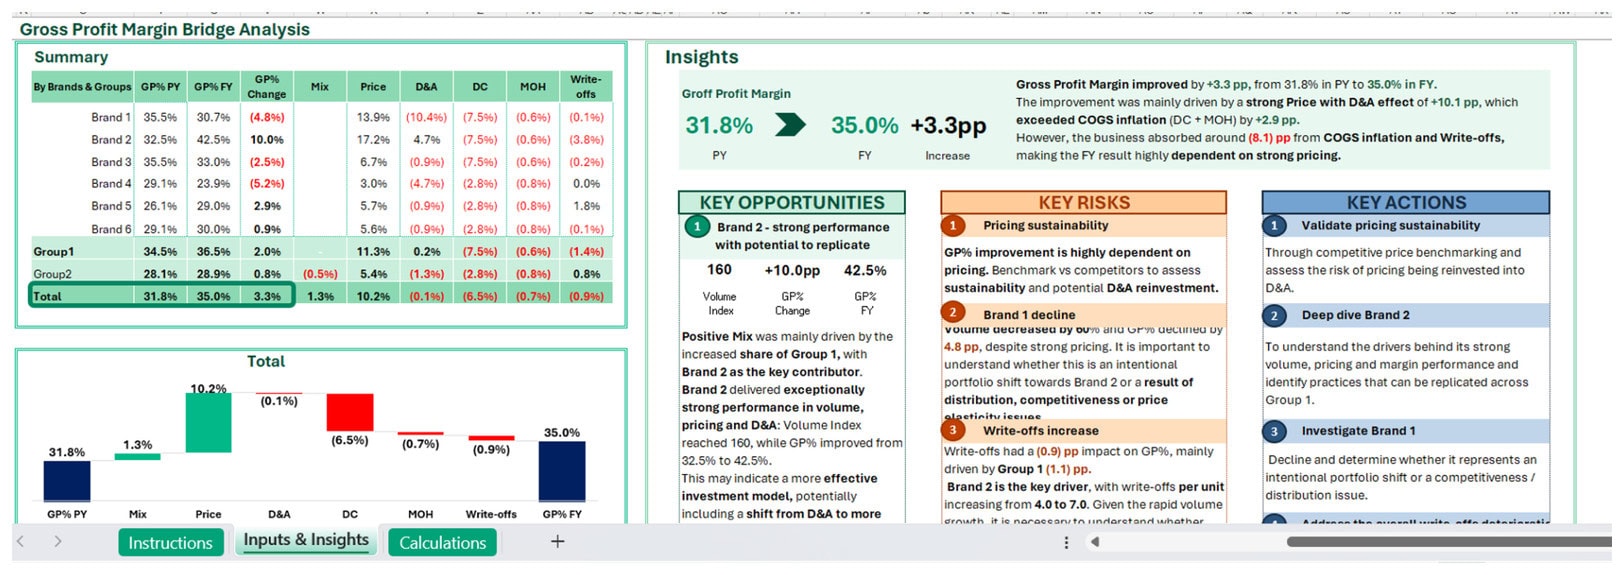
Compare any two selected periods and decompose the change in GP% into:
Price | Discounts & Allowances | Mix | Direct Costs | Manufacturing Overheads | Write-offs
Unlike approaches that leave part of the movement unexplained, the model provides a reconciled GP% decomposition without relying on an artificial “Math Difference” bucket.
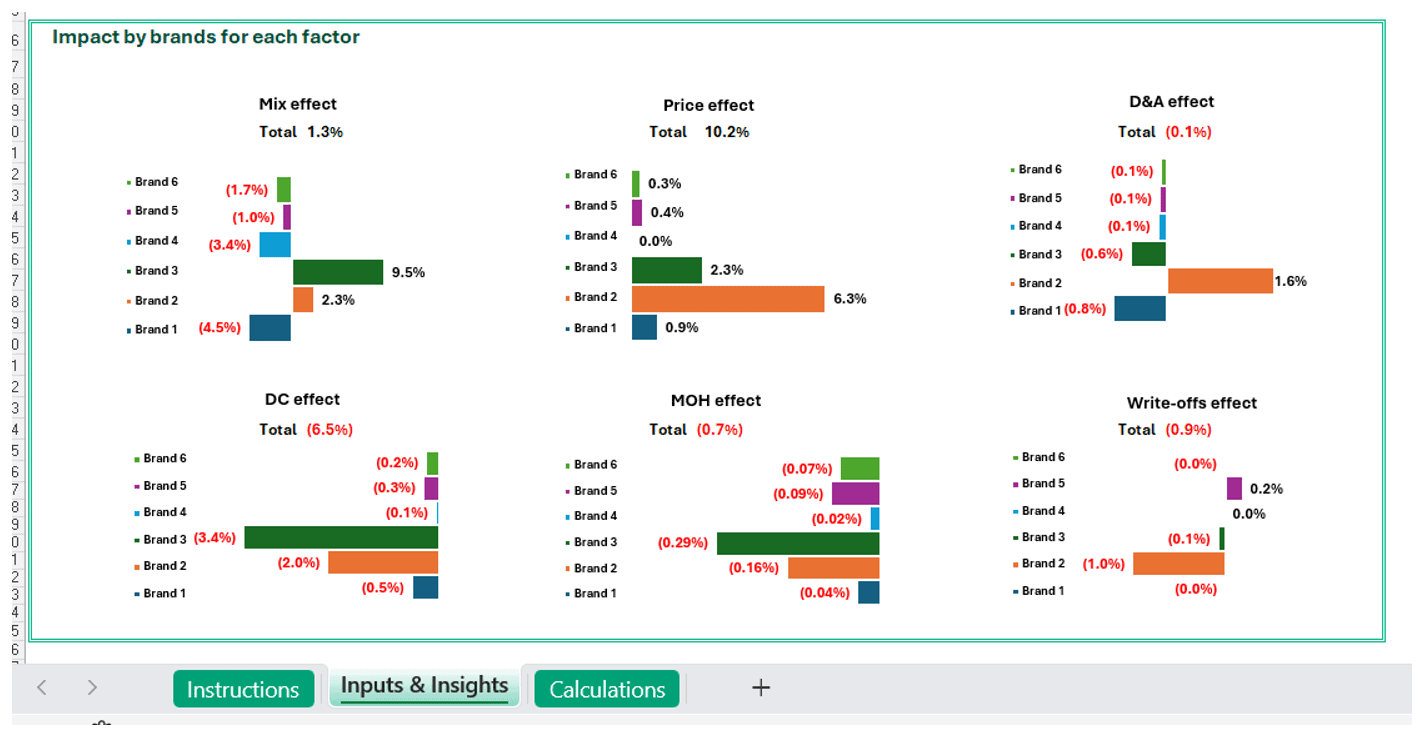
See what created or destroyed margin, identify the brands and drivers behind the movement, and assess whether the result is sustainable.
2. Model what could happen TOMORROW
Use forward-looking assumptions to test future GP% before changes hit your P&L.
Raw materials +10% — what happens to margin?
How much pricing may be needed to offset inflation?
Can D&A or Mix help protect target GP%?
What combination of actions delivers the required margin?
Change Price, D&A, Mix and Cost assumptions, compare scenarios and understand what needs to happen to protect or improve profitability.
From analysis to management-ready output
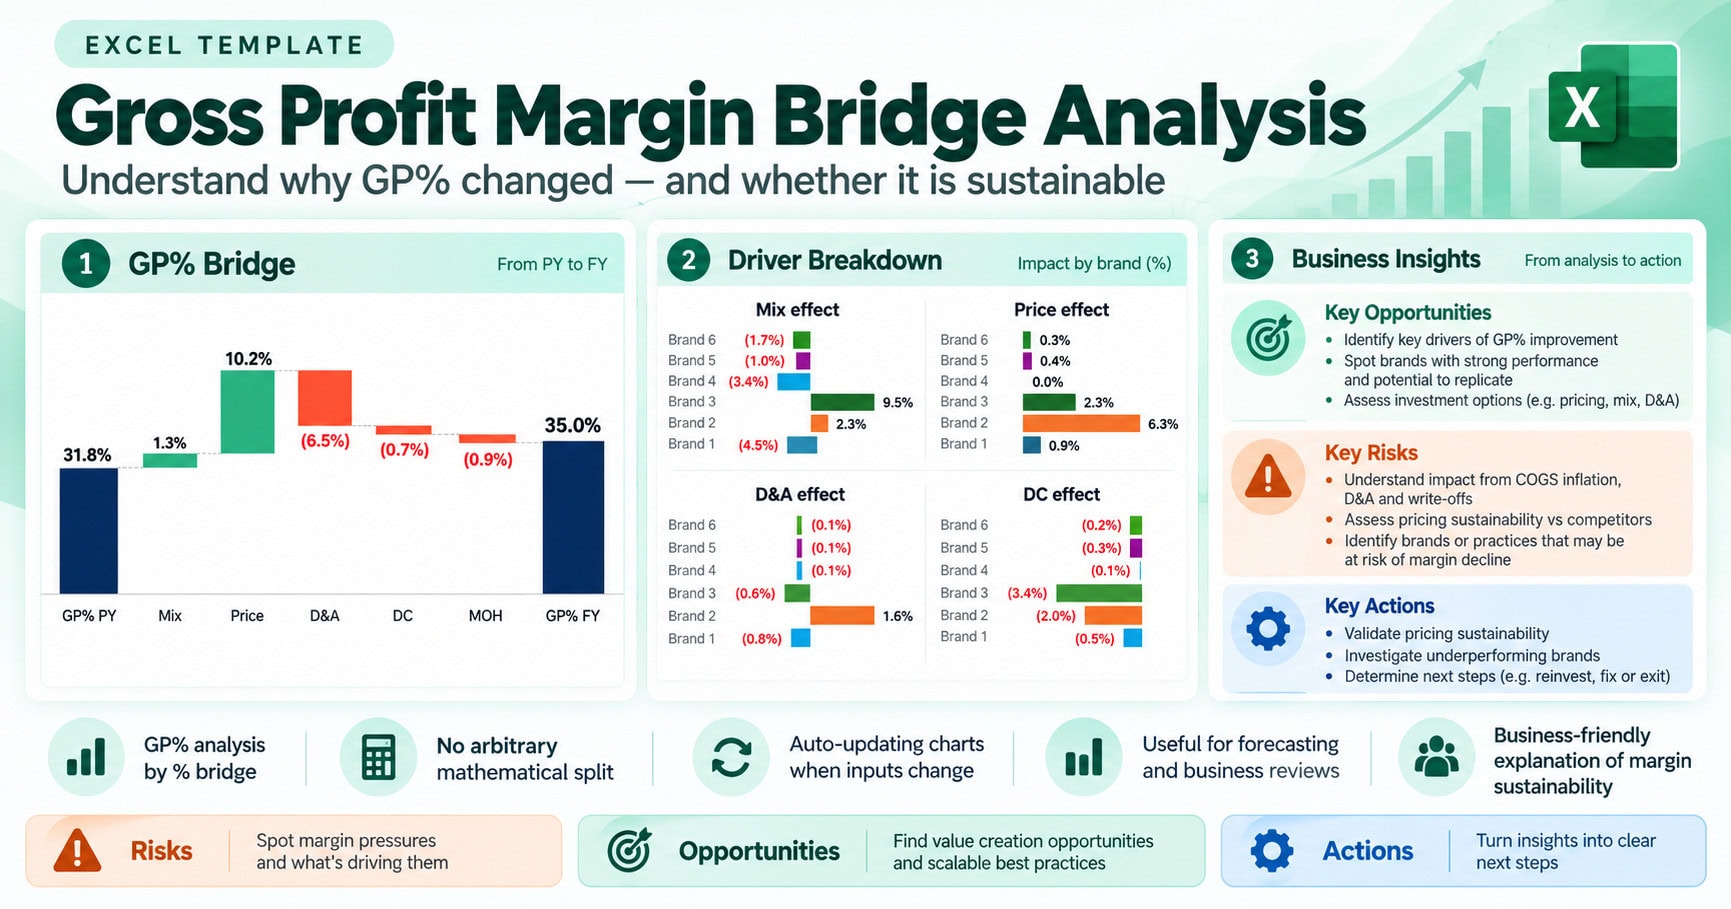
The model does more than calculate the answer. Linked charts, GP% bridges, driver breakdowns and executive insights update with your inputs, giving you presentation-ready visuals and nearly ready-to-use management slides.
Instead of rebuilding the analysis in PowerPoint, use the outputs to communicate:
Performance | Key Drivers | Risks | Opportunities | Actions
This makes the model useful for performance reviews, forecasting, budgeting, pricing decisions, RGM discussions, scenario planning and management presentations.
Built for people responsible for profitability
Designed for FP&A, Finance Business Partners, Commercial Finance, RGM, Pricing, Finance Managers, Controllers, Business Owners and Founders.
For Finance teams: explain GP% movements, build scenarios and turn analysis into a management story.
For Business Owners: answer the question:
“Revenue is growing — so why am I not making more money?”
What you get
✓ GP% decomposition across any two periods
✓ No artificial “Math Difference” bucket
✓ Price, D&A, Mix, Cost, MOH and Write-off impacts
✓ Brand-level driver analysis
✓ Forward-looking scenarios
✓ Pricing vs. cost-inflation analysis
✓ Automatically updated charts and management visuals
✓ Risks, Opportunities and Actions
✓ Fully editable Excel model with sample data
Don’t just report GP%. Take control of it.
Understand what drives your margin today. Model what could happen tomorrow. Know what needs to change before profitability disappears.
Explain it. Forecast it. Protect it.
Similar ProductsOther customers were also interested in...



 eFinancialModels
Electric Vehicle (EV) Charging Station Financial M...
With this comprehensive 5- or 10-year monthly tool, investors can assess the viability of setting up... Read more

Financial Model for Mobile App | Mobile App Busine...
The Mobile App Financial Plan Template in Excel allows you to develop financial projections when lau... Read more

 HenrySheykin
Food Truck Financial Model Excel Template
The Food Truck Financial Model helps entrepreneurs, founders, business owners, consultants, and anal... Read more

Green Hydrogen Production from Wind Energy Financi...
The Green Hydrogen from Wind Financial Model aims to comprehensively forecast a horizon of 40 years ... Read more

Simple Mutual Non-Disclosure Agreement Template
Protect your business secrets with ease using our Simple Mutual Non-Disclosure Agreement Template. S... Read more

Solar Energy Financial Model
The Solar Energy Financial Model Spreadsheet Template in Excel assists you in preparing a sophistica... Read more

 Peter Graf
The Customer-Centric Financial Model for Restauran...
Starting a restaurant without a financial plan is like driving a car blindfolded. You wouldn´t do i... Read more
You must log in to submit a review.