
0 ITEMS

Equity Waterfall Model with IRR Hurdles and Sponsor Promote (Real Estate JV and Syndication)
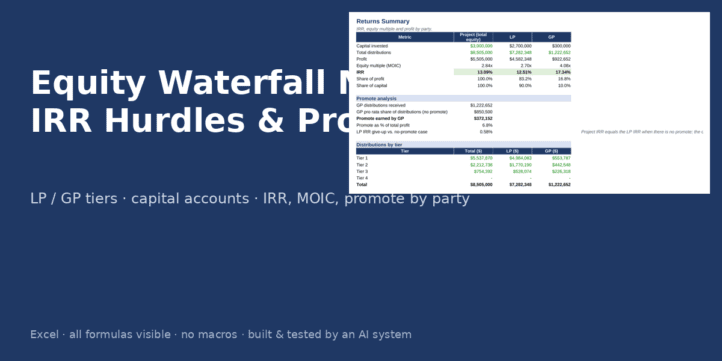
LP/GP distribution waterfall with up to four IRR hurdle tiers and a sponsor promote, showing the hypothetical capital account for every tier and returning IRR, equity multiple, profit and promote dollars for each party.

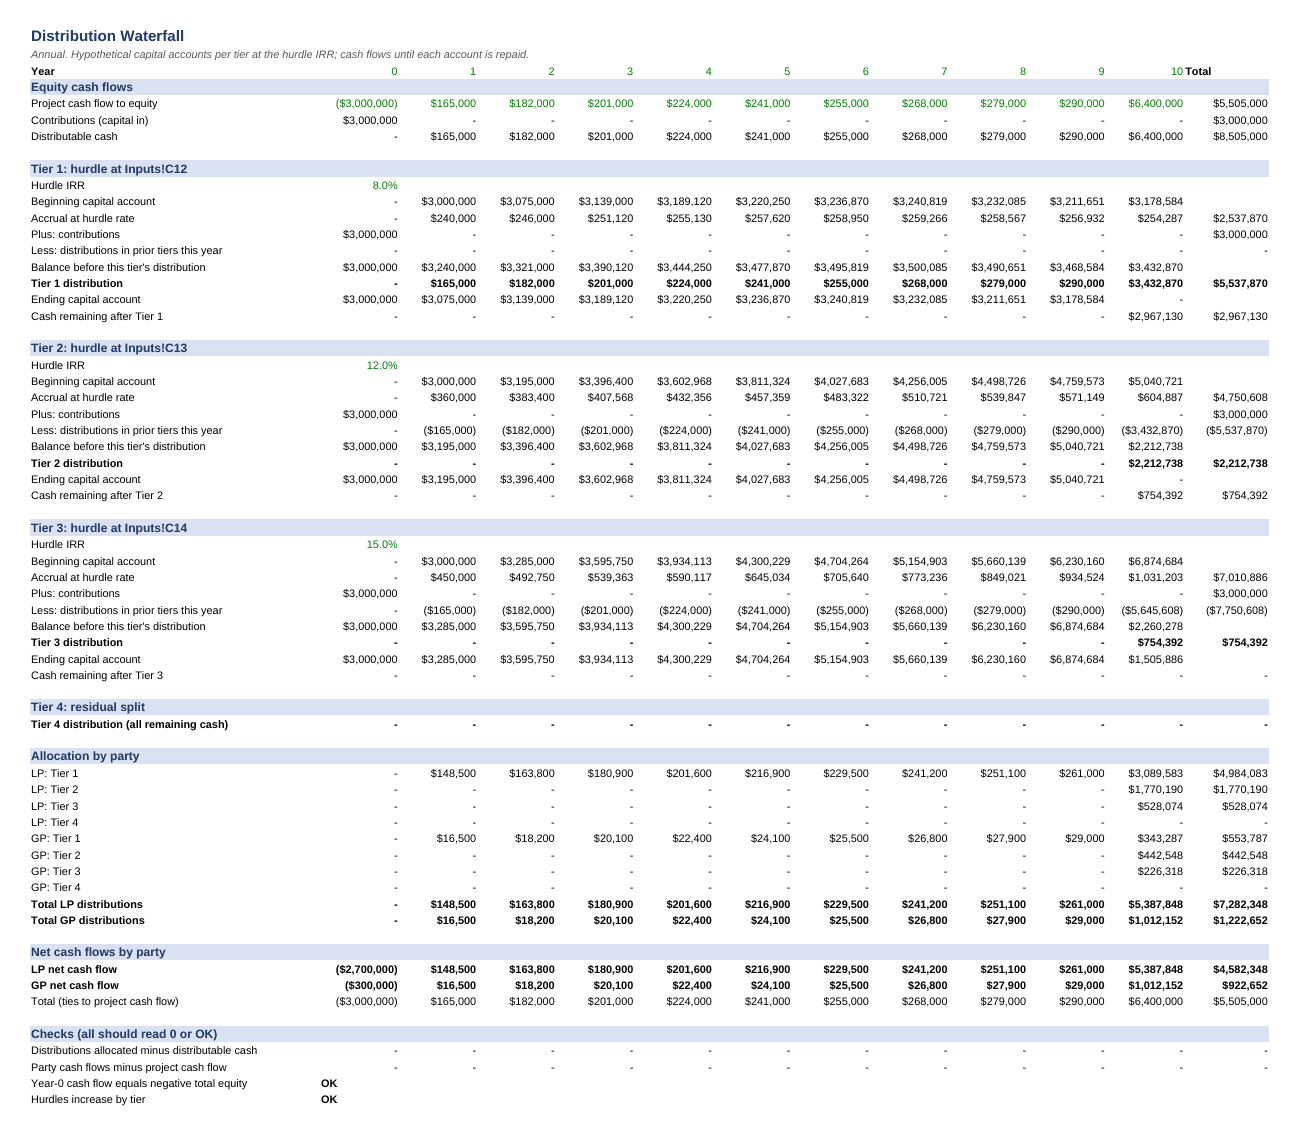
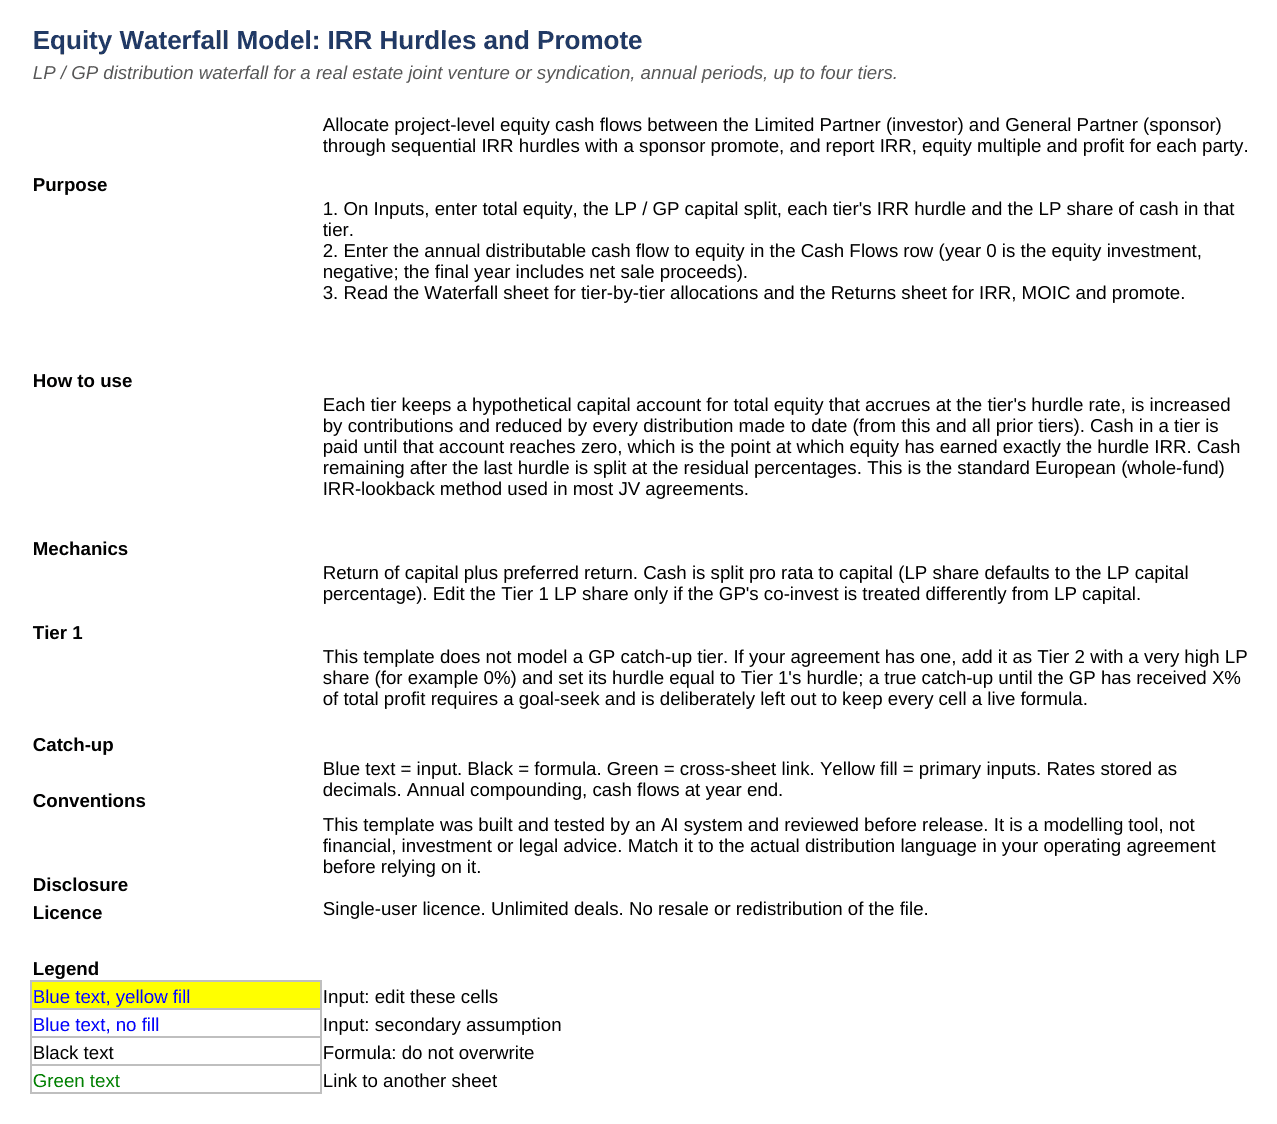
Most waterfall templates either hard-code a promote percentage or hide the mechanics inside a macro, which makes them useless when an investor asks exactly when the sponsor starts earning its share. This Excel model shows the hypothetical capital account for every hurdle tier so you can see, year by year, the point at which equity has earned its 8 percent, its 12 percent and so on, and how each dollar after that is split.
What the template is for
Sponsors use it to build and explain an offering. Limited partners use it to check a sponsor’s deck. Analysts use it to put a promote in front of an investment committee with the arithmetic visible. It suits any joint venture or syndication that distributes cash through sequential IRR hurdles.
What it includes
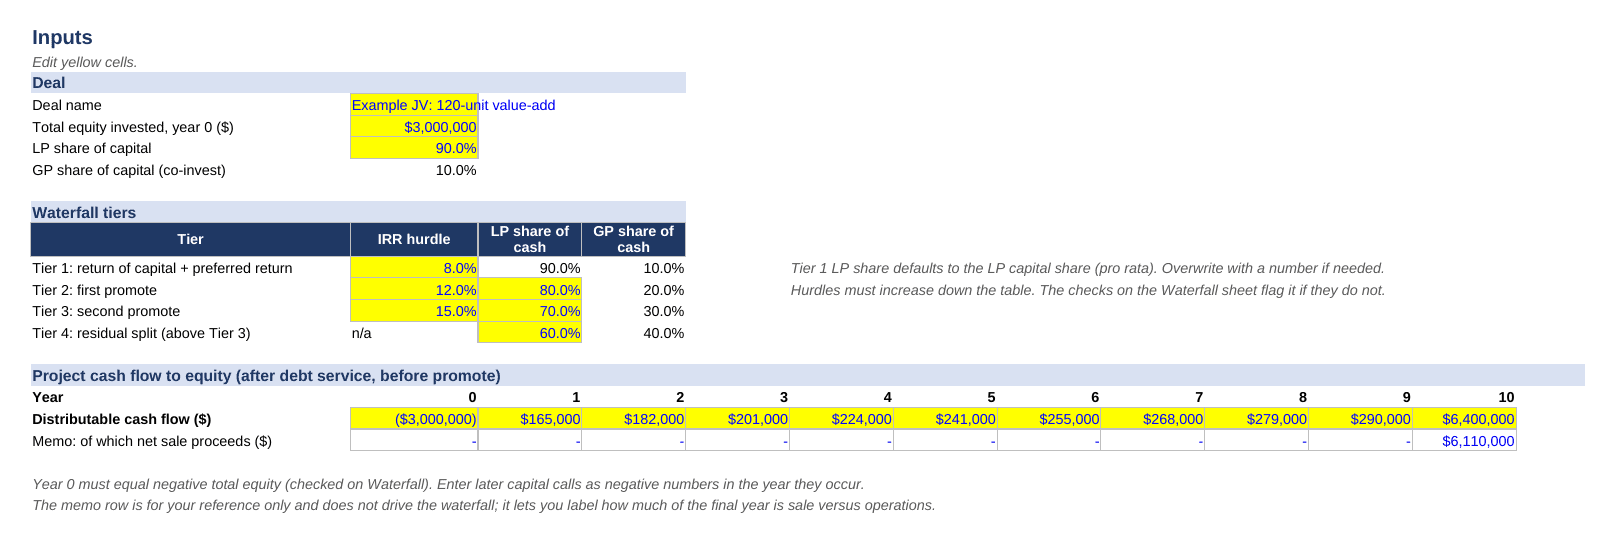
Inputs: total equity, the LP and GP capital split, three IRR hurdle rates plus a residual tier, the LP share of cash within each tier (the GP share is the remainder), and a ten-year row of distributable cash flow to equity with a memo row to label sale proceeds. The tier-one LP share defaults to the LP capital percentage, so the preferred return is pro rata unless you change it.
Waterfall: for each tier, the beginning capital account, accrual at the hurdle rate, contributions, distributions made in prior tiers in the same year, the balance available, the tier distribution, the ending balance and the cash remaining. Cash flows to the next tier only when the account reaches zero, which is precisely when the hurdle IRR has been achieved. Tier four takes all remaining cash at the residual split. Below that sit the allocation to LP and GP by tier, net cash flows by party, and four reconciliation checks that must read zero or OK: distributions allocated against distributable cash, party cash flows against project cash flow, the year-zero equity tie, and increasing hurdles.
Returns: capital, distributions, profit, equity multiple and IRR for the project, the LP and the GP; share of profit against share of capital; promote dollars earned by the GP; promote as a percentage of total profit; the LP’s IRR give-up relative to a no-promote deal; and distributions by tier.
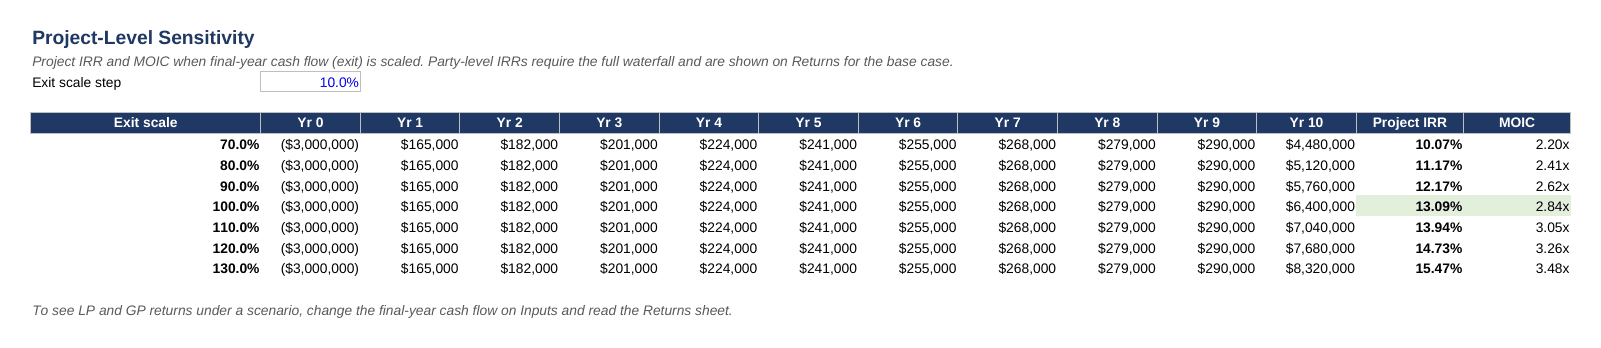
Sensitivity: project IRR and equity multiple across seven exit-value scenarios.
Method
The model uses the European, or whole-fund, IRR lookback structure found in most JV and syndication agreements, with annual compounding and year-end cash flows. The README explains how to adapt it to an agreement with a GP catch-up.
How to use it
Enter the equity, the split and the hurdles, paste your annual cash flow row, confirm the checks read OK and read the Returns sheet. Inputs are blue, formulas are black, cross-sheet links are green. No macros, no locked cells, no external links.
This template was built and tested by an AI system under a standing specification from a finance professional, recalculated with an independent engine and reviewed before release. All cells are unlocked and every formula is visible. Example data is included. It is a modelling tool, not financial, investment, lending or legal advice.
Similar ProductsOther customers were also interested in...



 eFinancialModels
Electric Vehicle (EV) Charging Station Financial M...
With this comprehensive 5- or 10-year monthly tool, investors can assess the viability of setting up... Read more

Financial Model for Mobile App | Mobile App Busine...
The Mobile App Financial Plan Template in Excel allows you to develop financial projections when lau... Read more

 HenrySheykin
Food Truck Financial Model Excel Template
The Food Truck Financial Model helps entrepreneurs, founders, business owners, consultants, and anal... Read more

Green Hydrogen Production from Wind Energy Financi...
The Green Hydrogen from Wind Financial Model aims to comprehensively forecast a horizon of 40 years ... Read more

Simple Mutual Non-Disclosure Agreement Template
Protect your business secrets with ease using our Simple Mutual Non-Disclosure Agreement Template. S... Read more

Solar Energy Financial Model
The Solar Energy Financial Model Spreadsheet Template in Excel assists you in preparing a sophistica... Read more

 Peter Graf
The Customer-Centric Financial Model for Restauran...
Starting a restaurant without a financial plan is like driving a car blindfolded. You wouldn´t do i... Read more
You must log in to submit a review.