
0 ITEMS

Colocation Data Center Financial Model – 5-Year Excel Projection & DCF Investor Ready
Data Center Financial Model – 5-Year Excel Projection Template Planning to build, buy or fund a data center? This data center financial model in Excel gives you an investor-ready 5-year forecast for colocation, edge, enterprise or AI / hyperscale data center projects. It includes monthly projections, linked financial statements, a DCF valuation and a one-page dashboard. It’s built for founders, developers, infrastructure investors, lenders and consultants who need to test a data center business plan, raise capital or run a feasibility study fast. Key Features – 5-year monthly forecast with annual summaries – Linked 3-statement model: Income Statement, Cash Flow and Balance Sheet – Scenario analysis: Base, Best and Worst case – DCF valuation with WACC, terminal value and equity value – Cap table covering several funding rounds and dilution – Breakeven, ROIC and payback period – English, Spanish and French, any currency, custom fiscal year – Investor dashboard and presentation-ready charts – No macros, transparent formulas, fully editable – Built-in example data you can replace with your own numbers What’s Inside Inputs: Dashboard (company, currency, scenario, loan terms, tax, working capital), Revenue (colocation per rack/kW, power pass-through, cross-connects, managed services), COGS & OPEX (power, PUE, cooling, maintenance, connectivity, G&A), Payroll, CAPEX (land, building, MEP, UPS, generators, racks) with depreciation, Cap Table and Capital (equity and debt). Statements: monthly and annual Income Statement, Cash Flow Statement and Balance Sheet. Analysis: Summary, Scenarios, Top Revenue, Top Expenses, Breakeven, ROIC, DCF Valuation, Sources & Uses, Ratios, DuPont Analysis, KPIs and Charts. Key Outputs – 5-year data center financial projections – Revenue, EBITDA, margins and net income – Funding needs and cash runway – Enterprise and equity value – Breakeven month, payback and ROIC Why This Model? Data centers are capital-intensive, so one wrong assumption about power costs, utilization or capex can ruin your returns. This template lets you stress-test every driver before committing capital. Enter your inputs and your data center pro forma is ready in hours, not weeks. Use the outputs directly in pitch decks, bank loan applications and investment memos. FAQ Can I use it for colocation or AI data centers? Yes. Revenue and cost sheets adapt to retail colocation, wholesale, edge and high-density GPU facilities. Do I need advanced Excel skills? No. Change the inputs and everything updates automatically. Does it include a valuation? Yes. A full DCF with WACC and terminal value, plus a cap table to track investor ownership. Is it suitable for lenders? Yes. The ratios, cash flow and Sources & Uses tabs show debt capacity and repayment ability. Format: Excel (.xlsx), compatible with Windows, Google Sheets and Mac.
Data Center Financial Model – 5-Year Excel Financial Projection, DCF Valuation & Business Plan Template
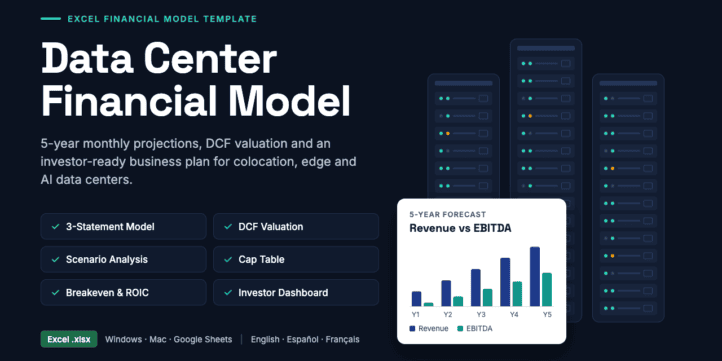
Planning to build, acquire, expand or invest in a data center? This data center financial model in Excel gives you a complete, investor-ready financial forecast for any data center project: retail colocation, wholesale leasing, edge facilities, enterprise data centers, or high-density AI and hyperscale data centers. In one easy-to-use template you get a 5-year monthly forecast, fully linked financial statements, a DCF valuation, a cap table, scenario analysis and a professional dashboard.
Data centers are some of the most capital-intensive infrastructure assets you can build. Land, power, cooling, electrical systems and IT equipment need large upfront investment, and returns depend on how fast capacity fills up, what you charge per kW or rack, and how well you control power costs. One wrong assumption can turn a profitable project into a loss. This data center financial model template lets you map every driver, stress-test your assumptions and present a credible data center business plan to investors, lenders and partners.
You don’t need to build a model from scratch or be an Excel expert. Enter your assumptions in the input sheets, and the income statement, cash flow, balance sheet, valuation, ratios and charts update automatically.
Who This Data Center Financial Model Is For
- Data center startups and founders raising seed, Series A or growth capital for a new facility
- Developers and real-estate investors evaluating a greenfield build, a powered-shell project or a conversion of an existing building
- Private equity and infrastructure funds carrying out due diligence on a data center investment or acquisition
- Colocation, hosting and cloud providers planning new sites, expansions or new service lines
- AI and GPU infrastructure companies modeling high-density compute capacity
- Banks and project finance lenders checking debt capacity, cash flow coverage and repayment ability
- Consultants, analysts and financial advisors preparing data center feasibility studies, valuations and pro formas for clients
Key Features at a Glance
- 5-year monthly forecast (60 months) with automatic annual summaries
- Fully integrated 3-statement model: Income Statement, Cash Flow Statement and Balance Sheet, linked and balanced every period
- Scenario analysis: switch between Base, Best and Worst case using adjustable revenue and cost multipliers
- Discounted cash flow (DCF) valuation with WACC, terminal value, enterprise value and equity value
- Cap table tracking several funding rounds, share issuance, pre-money and post-money valuation, and ownership dilution
- Breakeven analysis, return on invested capital (ROIC) and payback period
- Debt modeling with loan amount, interest rate, term and annuity repayment schedule
- Sources & Uses of funds summary for investors and lenders
- Financial ratios and DuPont analysis for deeper performance insight
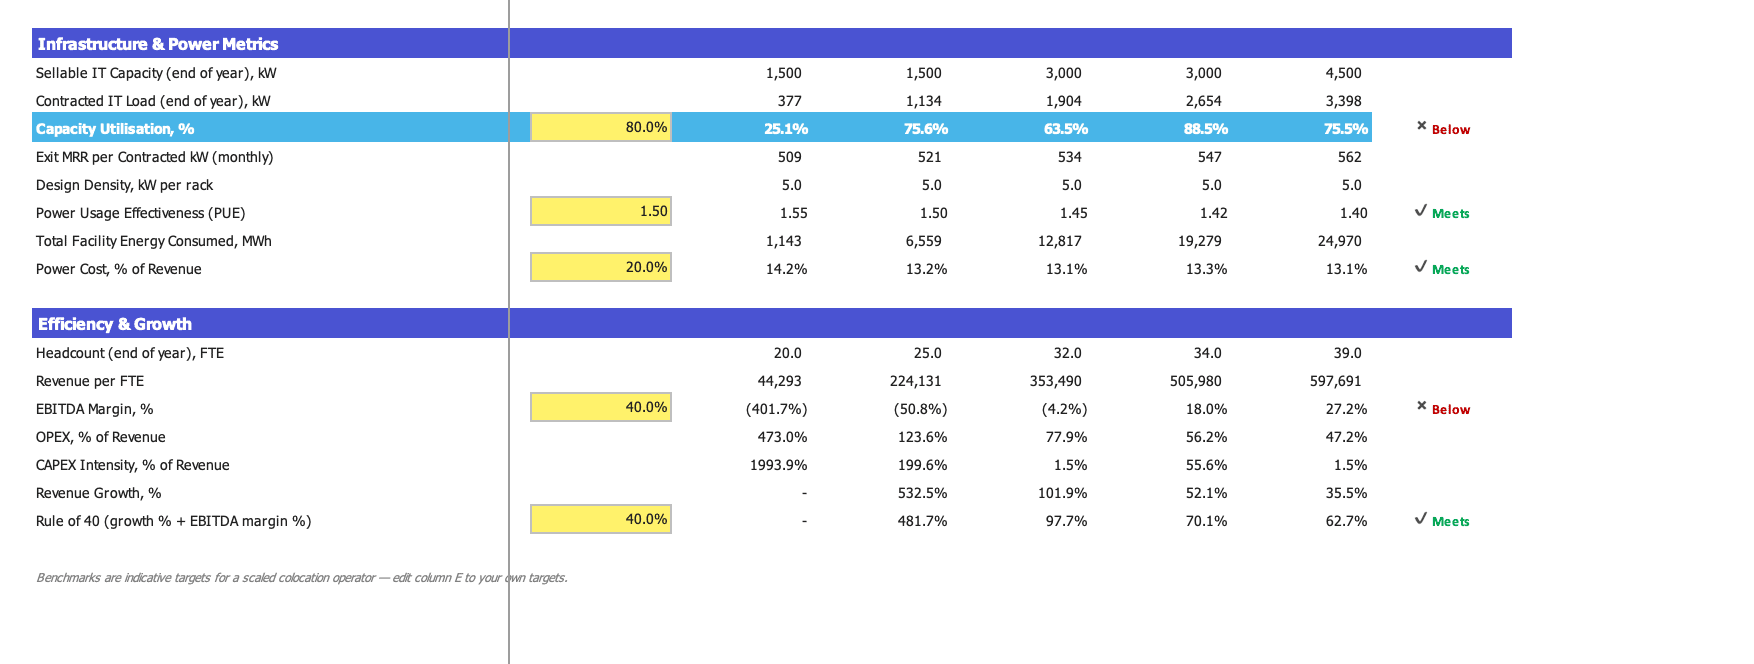
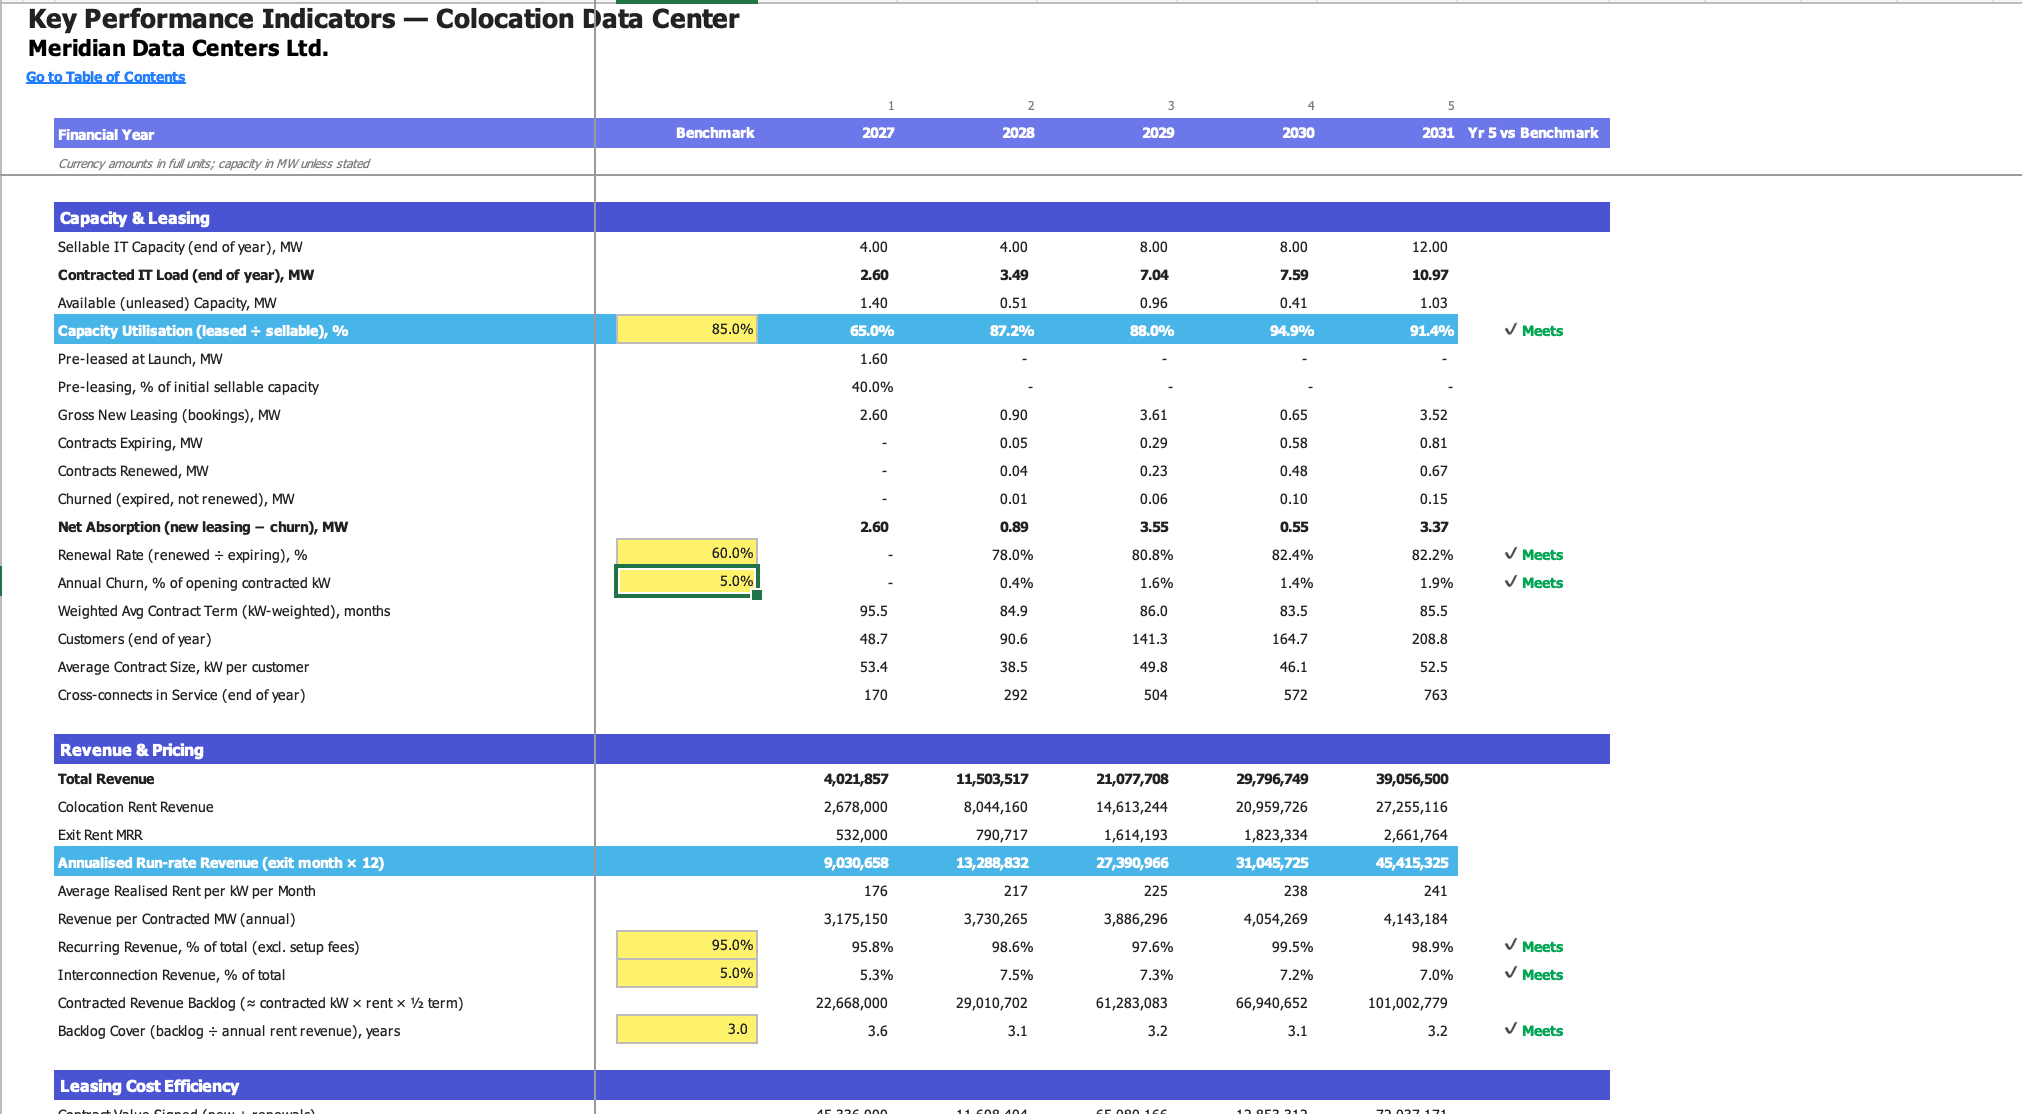
- Weighted KPI scorecard to track the metrics that matter most
- Top revenue and top expense analysis showing where money comes from and where it goes
- Investor dashboard and charts ready to drop into a pitch deck
- Multi-language: switch the entire model between English, Spanish and French with one click
- Any currency and a custom fiscal year-end month
- No macros, no VBA: transparent formulas you can audit and edit
- Built-in example data so you can see how the model works before entering your own numbers
What’s Inside: Detailed Worksheet Breakdown
The model is organized in a clear, logical flow: inputs → calculations → financial statements → analysis and reports. A table of contents with descriptions of each tab makes navigation easy.
Input Sheets
Dashboard (Main Inputs)
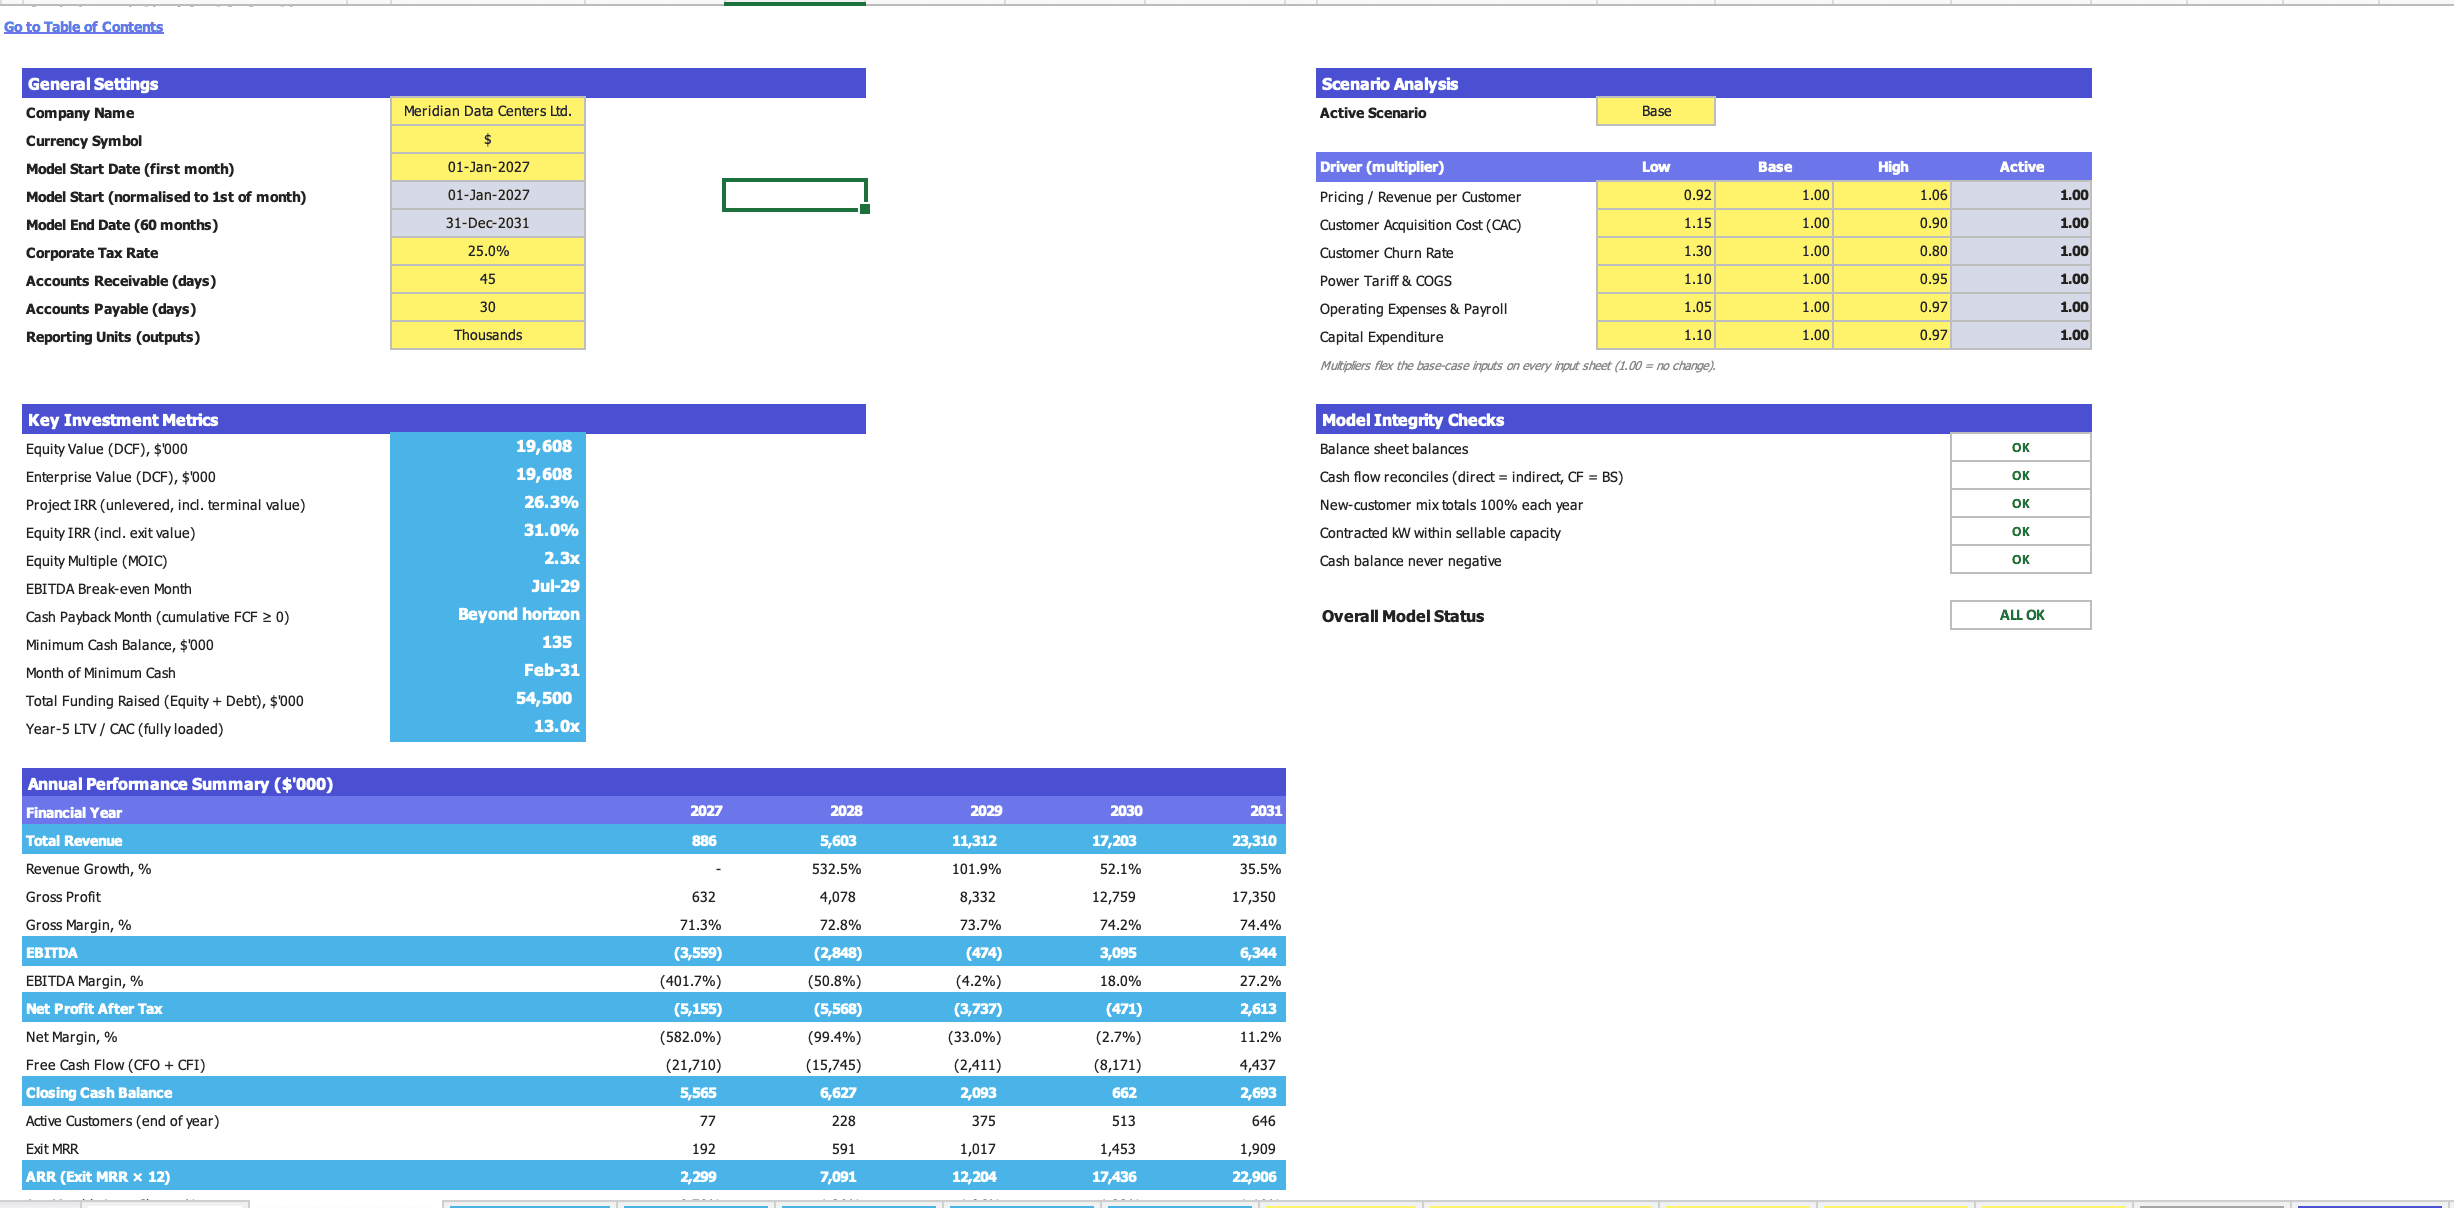
This is the control center of the model. Enter your company name, model start date, fiscal year-end month, reporting currency and display language. Choose the active scenario (Base, Best or Worst), set scenario multipliers, and define your loan terms: amount, interest rate, term in years and repayment type. Enter your corporate tax rate, depreciation period and working capital assumptions such as receivable days, payable days and inventory days. Changes here flow through the whole model at once.
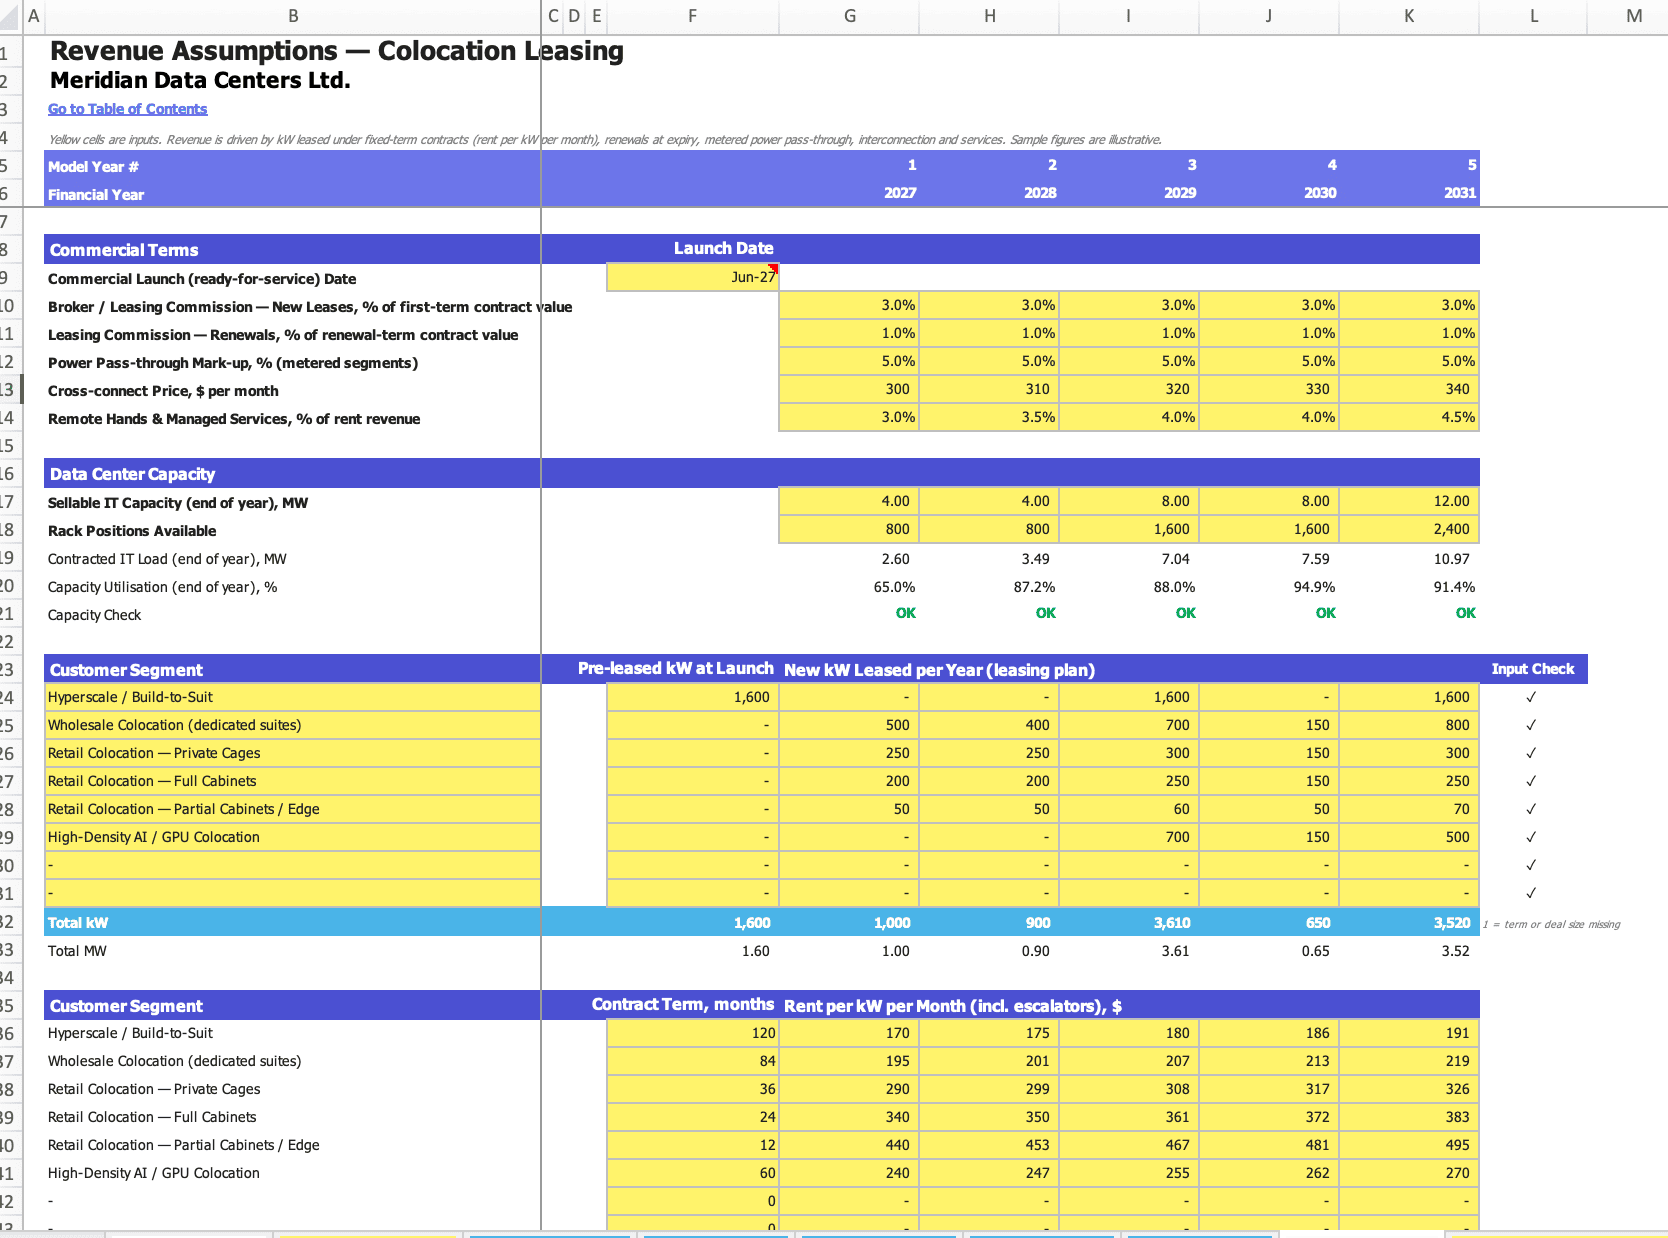
Revenue
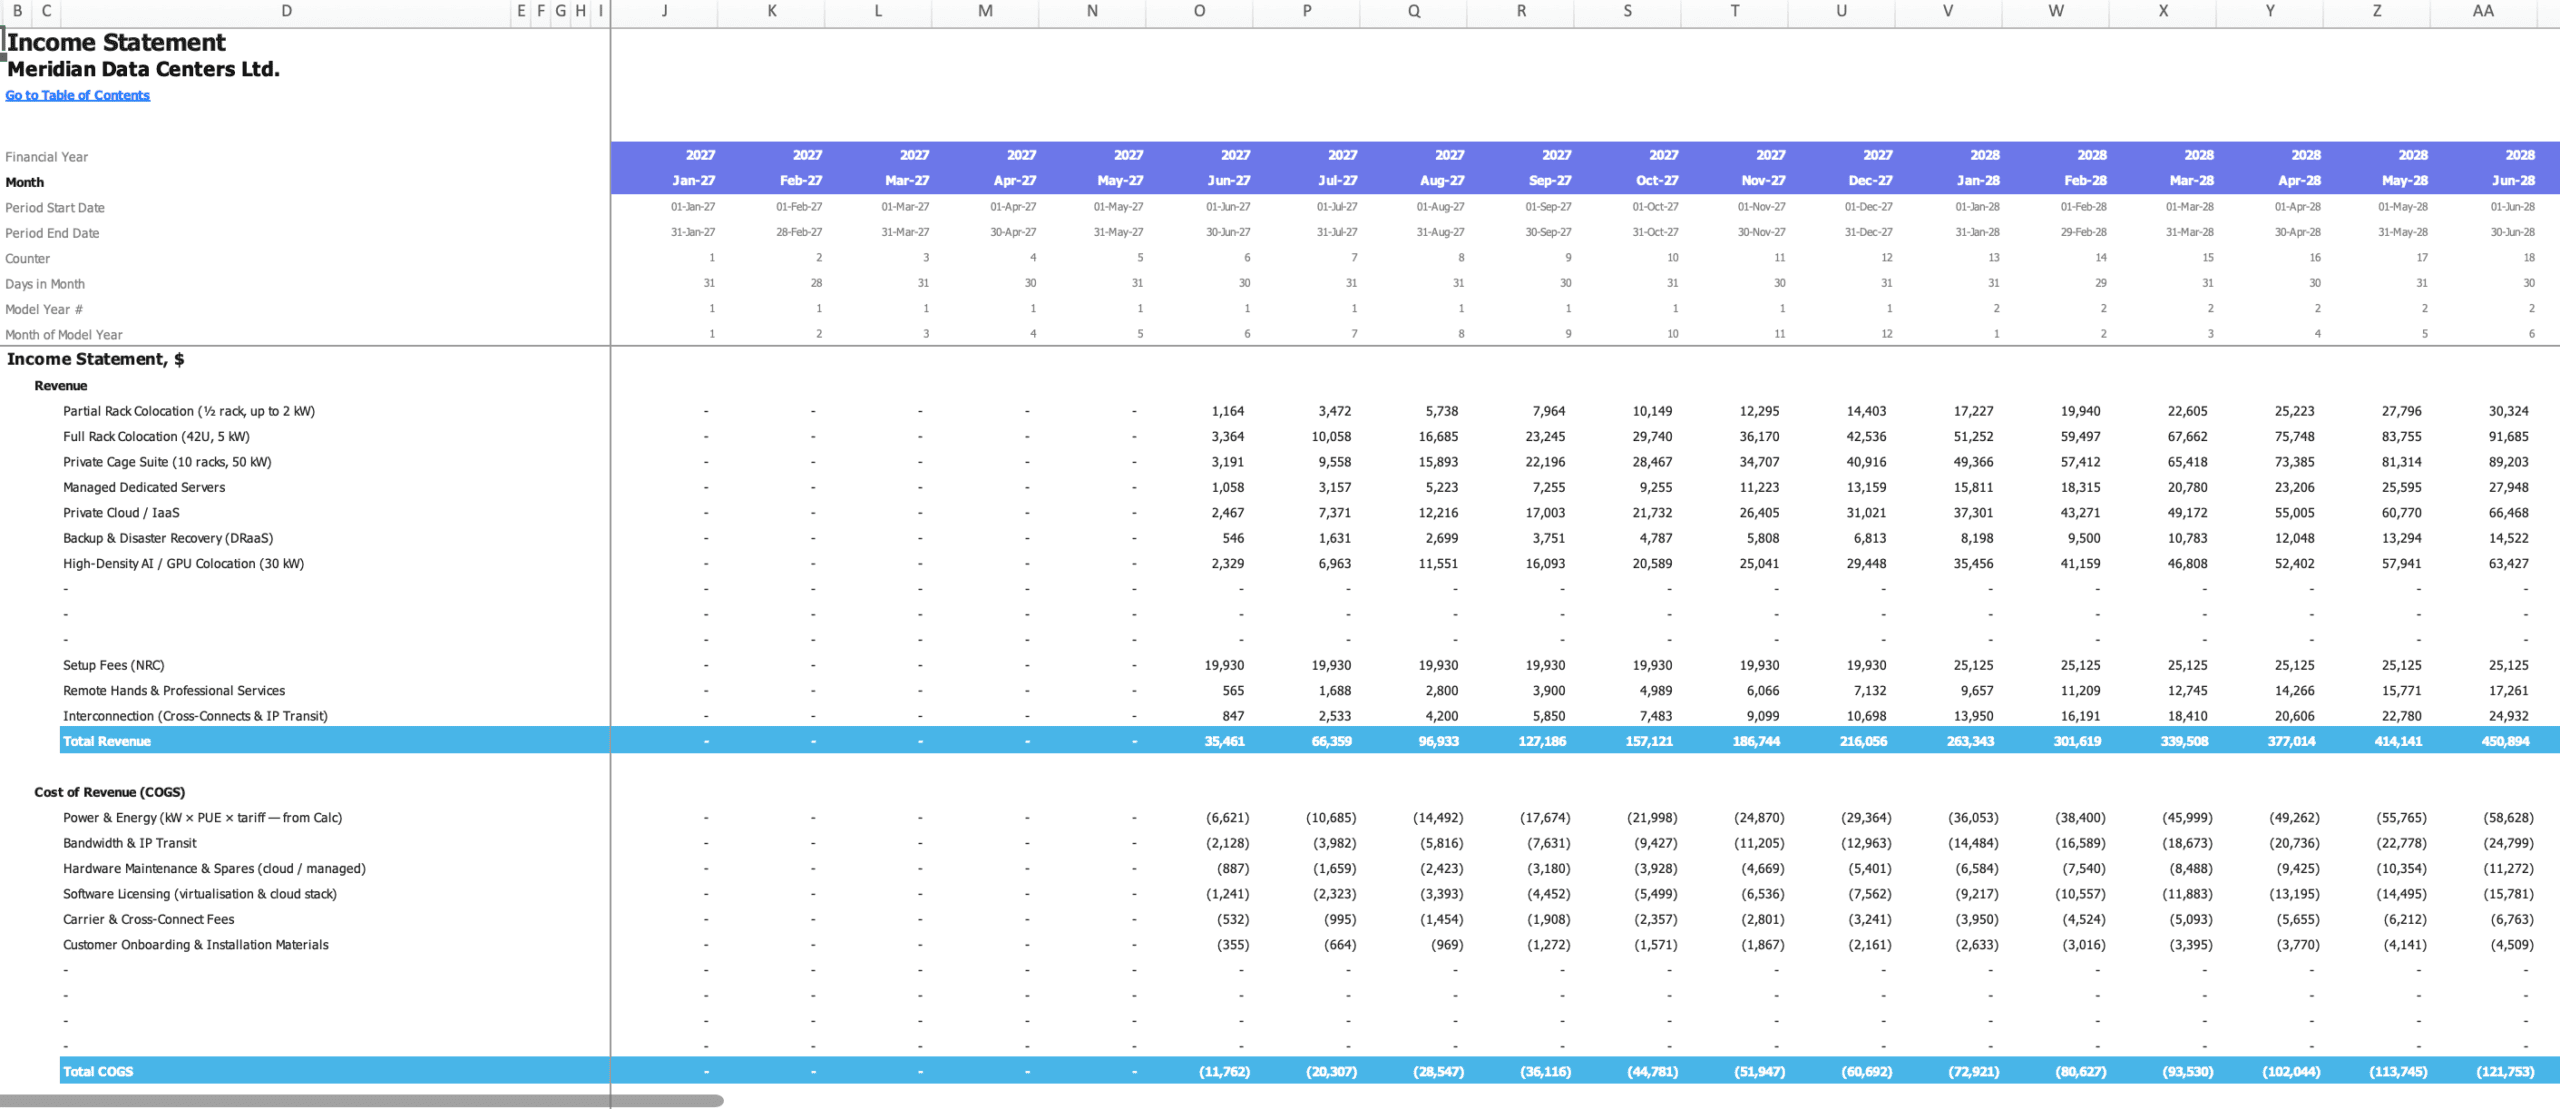
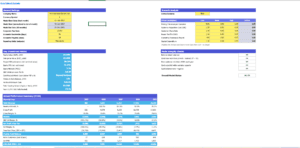
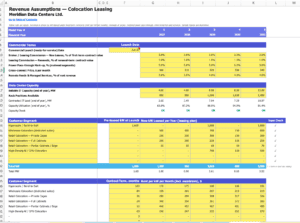
Model each data center revenue stream with its own volume, pricing and growth assumptions. Typical streams include colocation revenue per rack or per kW, wholesale and powered-shell lease income, power pass-through and metered power charges, cross-connect fees, bandwidth and IP transit, managed services, cloud and hosting services, and remote hands support. Annual assumptions are spread into monthly values using seasonality weights, so you can model capacity ramp-up and customer onboarding realistically.
COGS & OPEX
Capture every direct and operating cost of running a data center. Direct costs include electricity and power costs (driven by PUE), cooling, connectivity and network costs, and equipment maintenance. Operating expenses cover rent or property costs, insurance, physical security, software and monitoring tools, sales and marketing, professional fees, and general and administrative costs. Costs can be fixed, variable or tied to revenue.
Payroll
Build a detailed headcount plan by role: facility managers, critical facilities engineers, NOC technicians, security staff, sales and account managers, and executive team. Set salaries, start dates, annual raises and employer benefits and taxes. Payroll costs feed automatically into the income statement and cash flow.
CAPEX
Plan your data center capital expenditure by asset class and timing: land acquisition, building and shell construction, electrical infrastructure (substations, switchgear, UPS systems, backup generators), mechanical and cooling systems (chillers, CRAH/CRAC units, liquid cooling), fire suppression, security systems, racks, cabling and IT equipment. Each asset gets its own useful life, and the model calculates depreciation schedules and net book value automatically.
Cap Table
Track equity funding rounds over time. Enter investment amounts, share prices and round dates, and the model calculates shares issued, pre-money and post-money valuation, and each shareholder’s ownership percentage after every round.
Capital
Summarizes all funding sources over time, including equity injections from the cap table, loan drawdowns, interest payments and principal repayments, so you can see exactly how the project is financed month by month.
Financial Statements
Income Statement (IS)
A monthly and annual profit and loss statement showing revenue, cost of goods sold, gross profit, operating expenses, payroll, EBITDA, depreciation, EBIT, interest expense, income tax and net income. Scenario multipliers and currency settings are applied automatically.
Cash Flow Statement (CF)
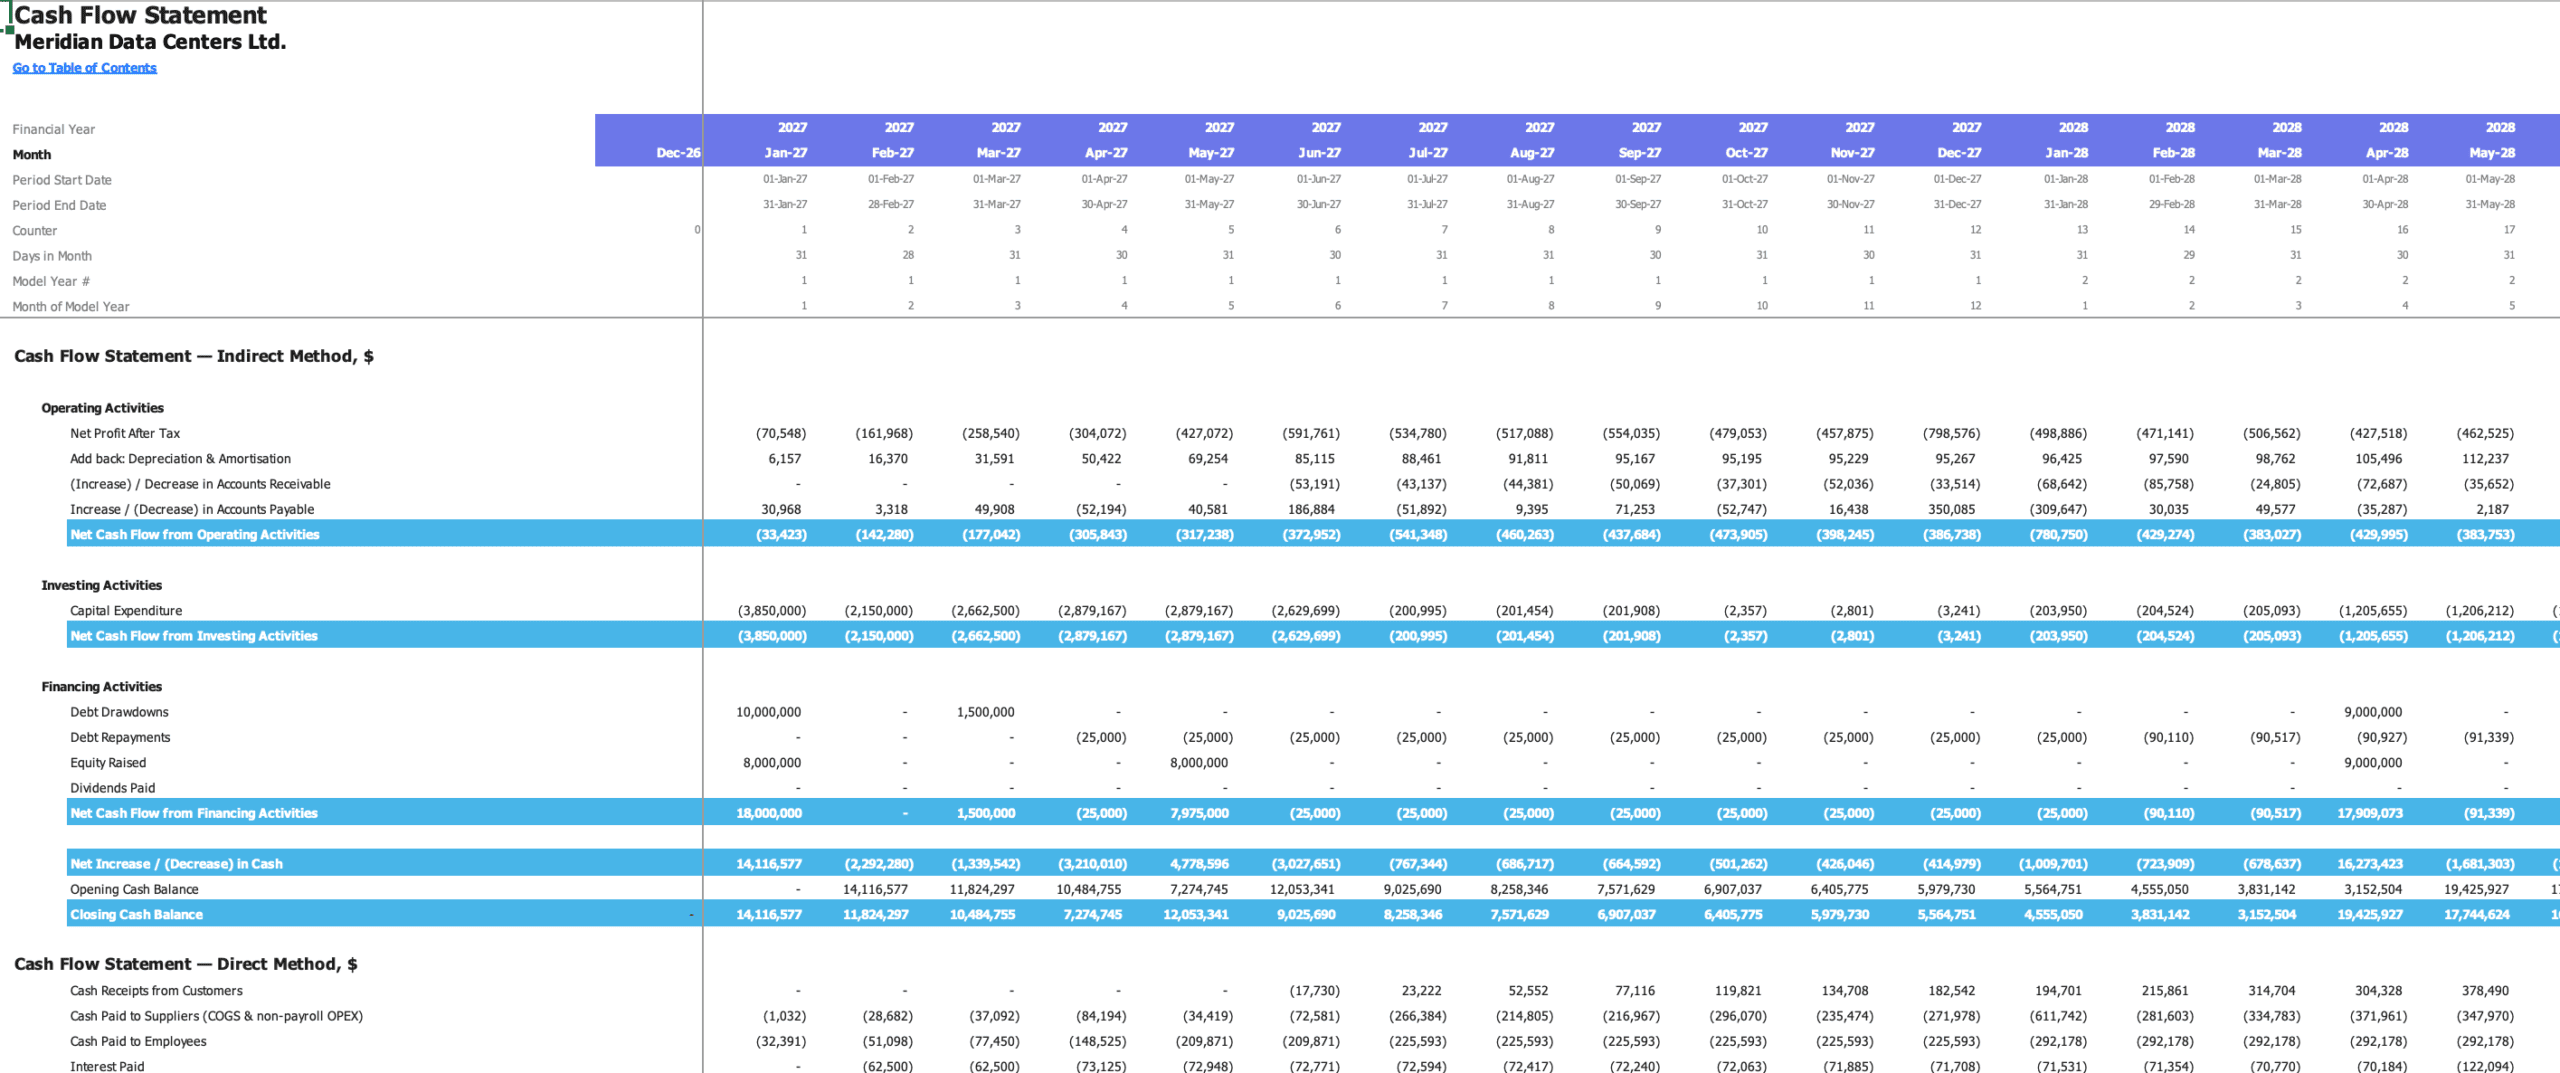
Shows cash from operating, investing and financing activities, the net change in cash and the closing cash balance every month. It identifies your funding requirement, minimum cash point, breakeven month and payback month, which are critical figures for any data center investor.
Balance Sheet (BS)
A fully balanced balance sheet covering cash, receivables, inventory, fixed assets net of depreciation, payables, debt, paid-in capital and retained earnings. A built-in check confirms the balance sheet balances in every period.
Analysis and Reporting Sheets
Summary
An executive overview of annual and monthly performance: revenue, revenue growth, costs, gross margin, EBITDA and EBITDA margin, net income and cash flow, laid out for quick review.
Scenarios
Compare Base, Best and Worst case results side by side. See how changes in revenue and costs affect profitability, cash needs and valuation, so you can show investors you’ve planned for downside risk.
Top Revenue
Ranks your largest revenue streams and shows each one’s share of total revenue by year.
Top Expenses
Shows your four largest expense categories, with all other costs grouped as “Other,” so you can focus cost control where it matters most, usually power, payroll and maintenance in a data center.
Breakeven Analysis (BE)
Compares total revenue against total costs to calculate the breakeven point, in both revenue terms and the month when the data center becomes cash-flow positive.
ROIC
Calculates return on invested capital year by year, along with the payback period, showing how efficiently the capital invested in the facility generates returns.
Valuation (DCF)
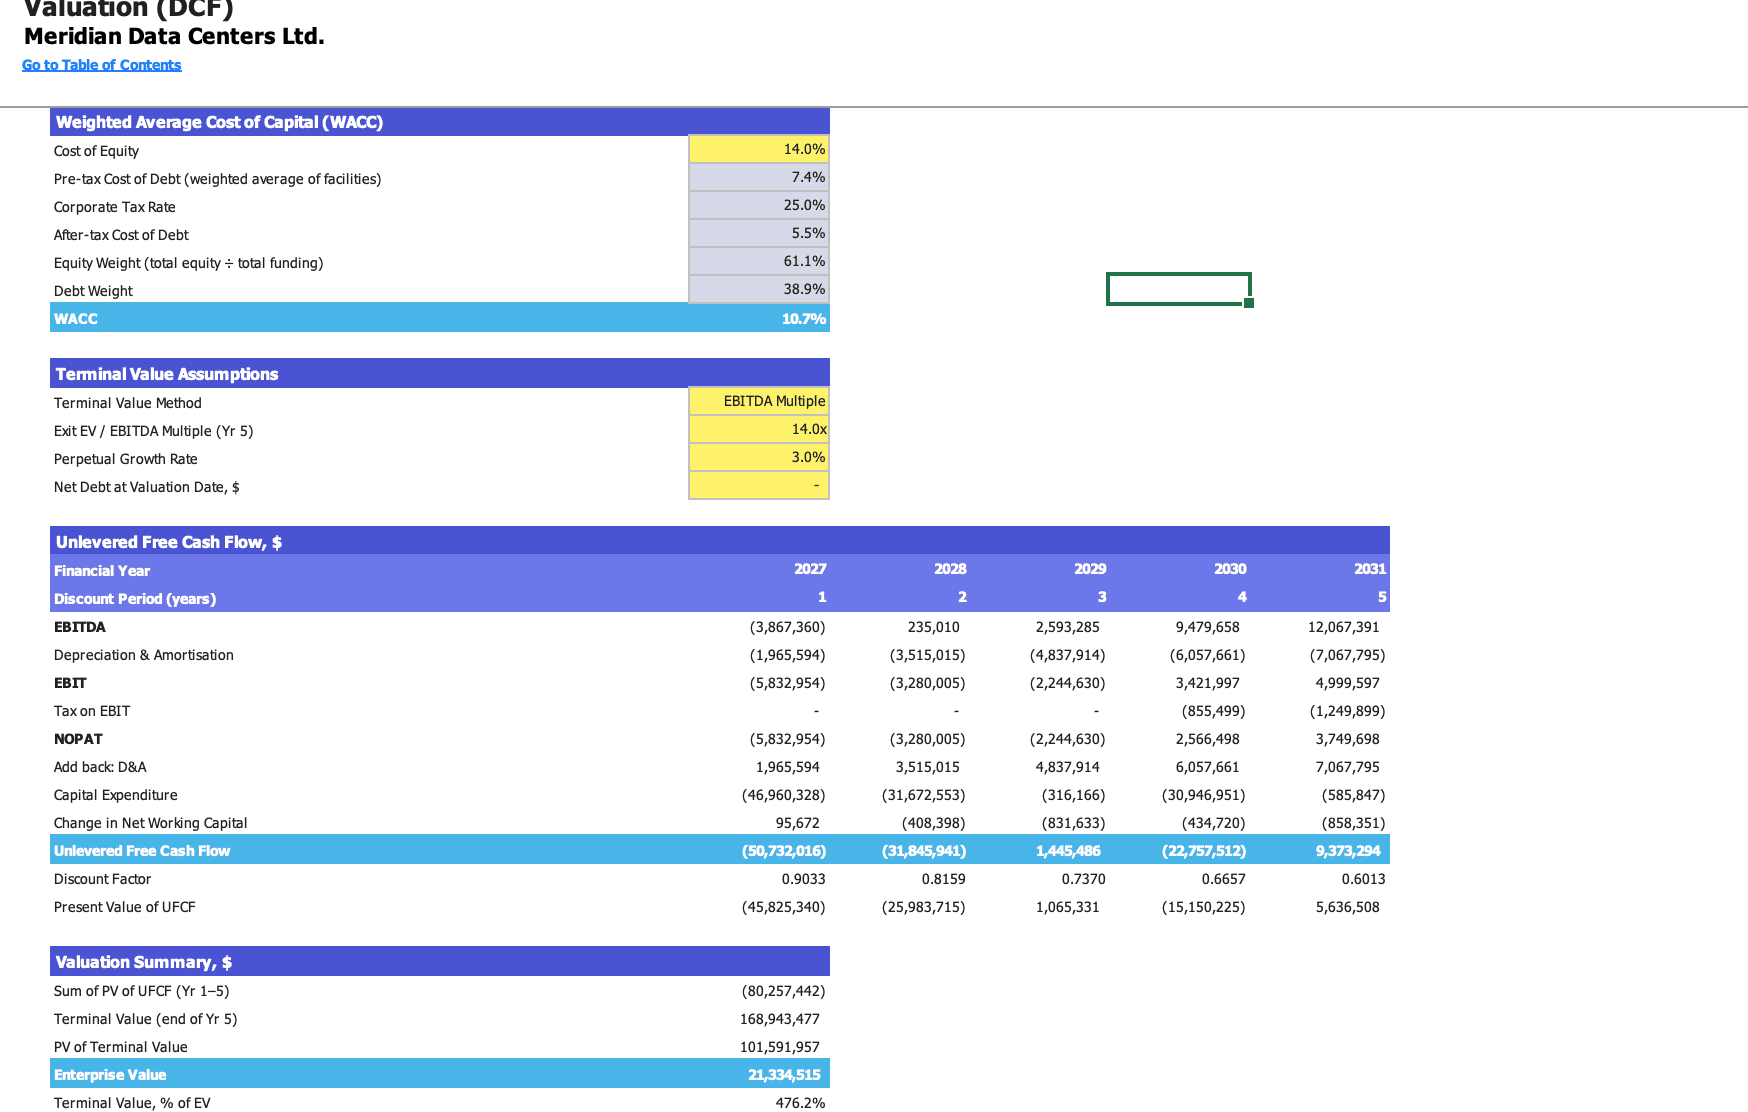
A complete discounted cash flow valuation. The model calculates the weighted average cost of capital (WACC) from the cost of equity, the cost of debt, the capital structure and the tax shield, then discounts free cash flows and adds a terminal value to arrive at enterprise value and equity value.
Sources & Uses
Shows where the funding comes from (equity and debt) and how it’s spent (capex, operating losses, working capital and cash reserves) over a period you choose. Lenders and investors expect this summary.
Ratios
Annual financial ratios covering profitability (gross margin, EBITDA margin, net margin, return on equity, return on assets), liquidity (current ratio, cash ratio), leverage (debt-to-equity, interest coverage) and efficiency (asset turnover, working capital days).
DuPont Analysis
Breaks return on equity into profit margin, asset turnover and financial leverage, so you can see what really drives shareholder returns.
KPIs
A weighted key performance indicator scorecard. Set your own weights for metrics such as revenue growth, gross margin, EBITDA margin and net margin, and track overall performance year by year.
Charts
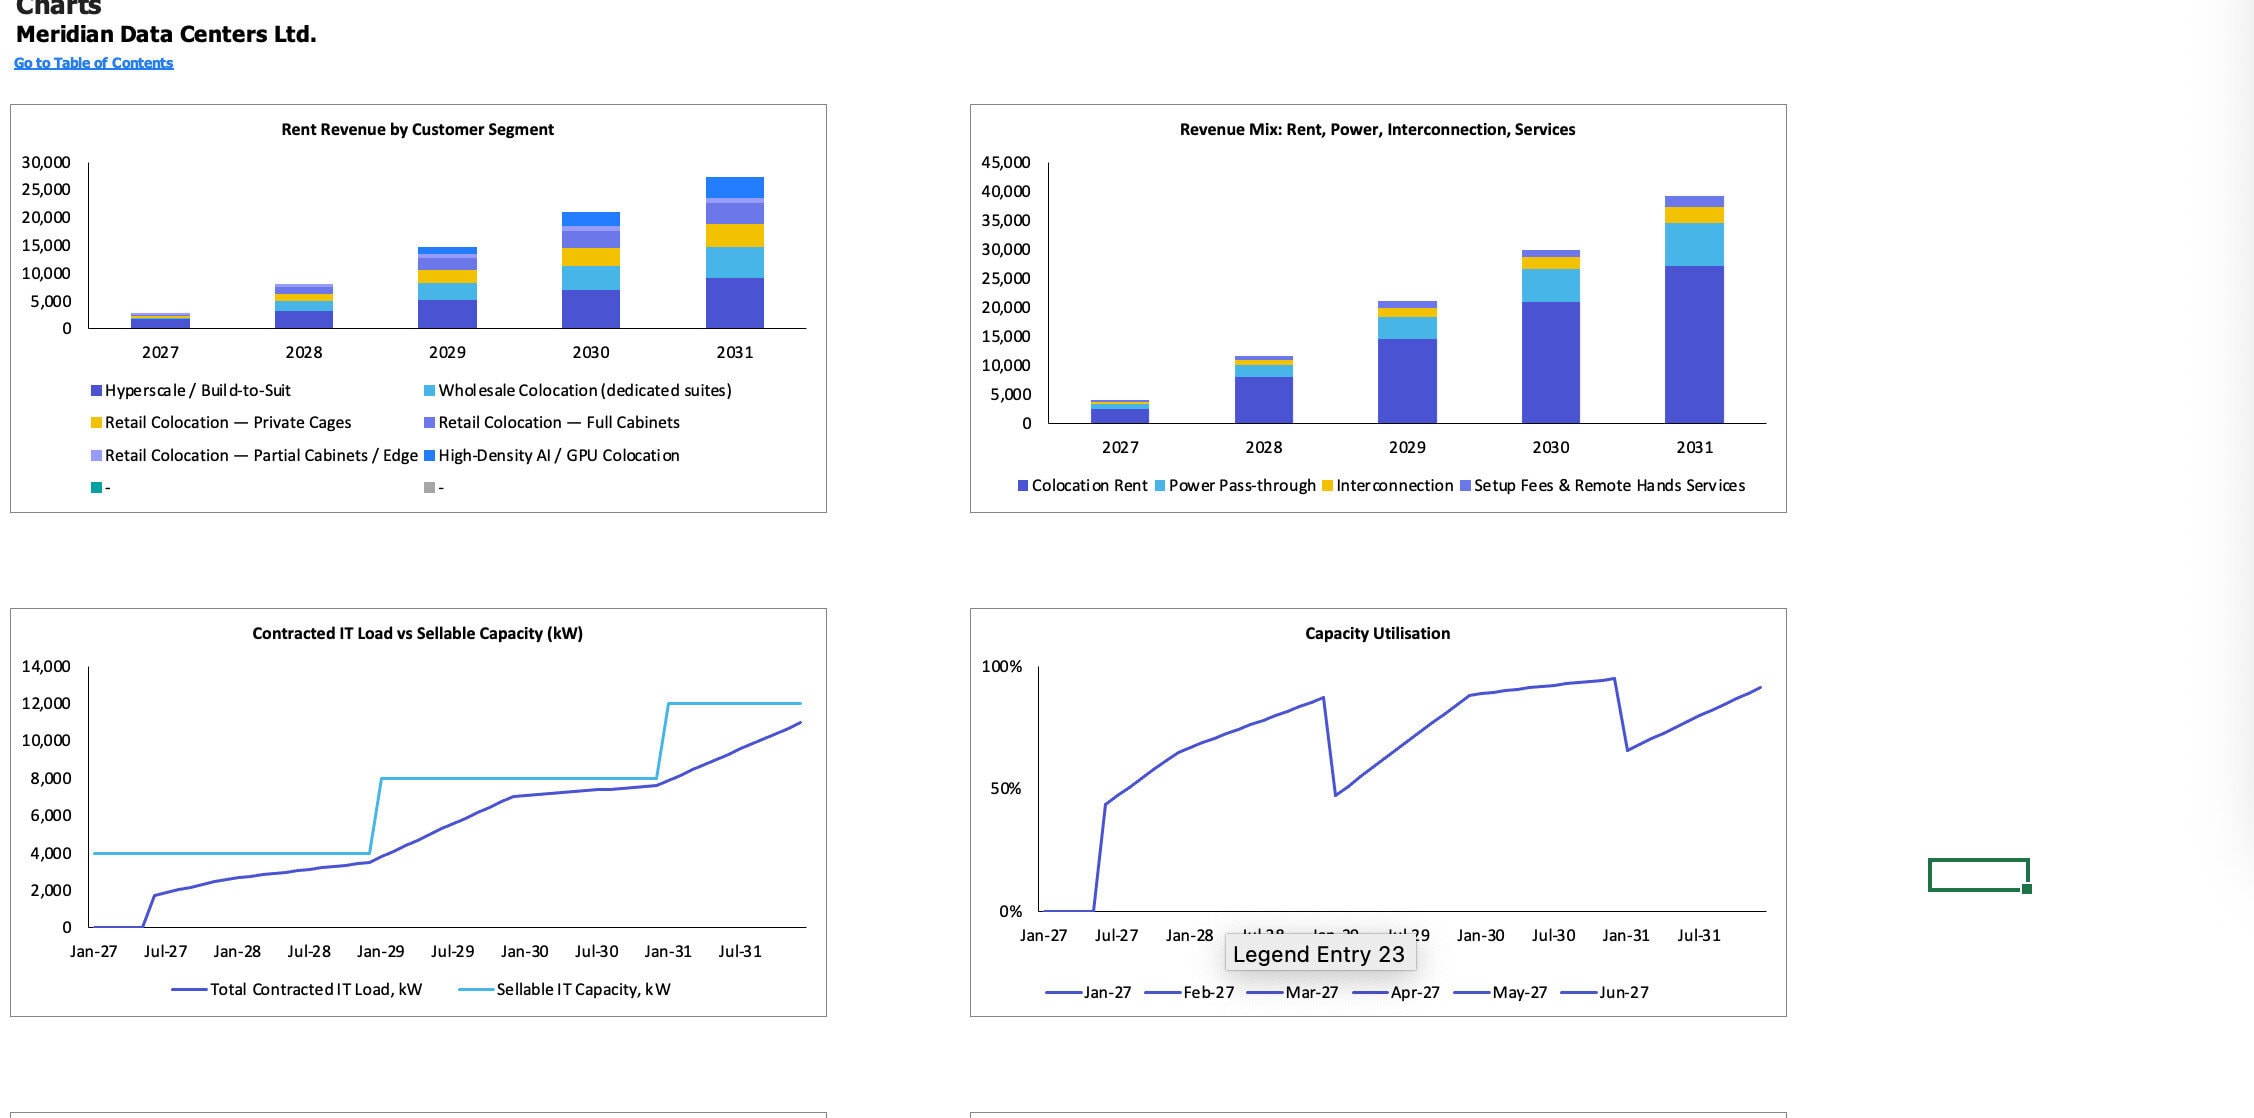
Ready-made charts for revenue, expenses, EBITDA, net income, cash balance and profitability trends. Copy them straight into your data center pitch deck, investment memo or board presentation.
Data Center Metrics You Can Model
- Revenue per kW and revenue per rack
- IT load capacity (MW) and utilization or occupancy ramp-up
- Power usage effectiveness (PUE) and energy costs
- Capex per MW and total development cost
- EBITDA and EBITDA margin
- Free cash flow and cash runway
- Breakeven month and payback period
- ROIC, ROE and ROA
- Enterprise value and equity value
Key Outputs You’ll Get
- 5-year data center financial projections (monthly and annual)
- Projected revenue, gross profit, EBITDA and net income
- Total funding requirement and timing of cash needs
- Enterprise value and equity value from the DCF
- Investor ownership and dilution after each funding round
- Breakeven point, payback period and ROIC
- Lender-ready ratios and a Sources & Uses summary
- Professional charts and an executive summary for presentations
How to Use the Model in 5 Simple Steps
- Set up the basics: enter your company name, start date, currency, language and fiscal year on the Dashboard.
- Enter revenue assumptions: add your services, pricing per kW or rack, capacity and occupancy ramp-up.
- Add costs, payroll and capex: enter power costs, operating expenses, headcount and your construction and equipment budget.
- Define your funding: enter equity rounds in the Cap Table and loan terms on the Dashboard.
- Review the results: check the statements, valuation, breakeven, ratios and charts, then switch scenarios to stress-test your plan.
Why Choose This Data Center Financial Model?
- Saves weeks of work: a structured, tested framework you can customize in hours
- Investor-grade structure: follows financial modeling best practice with clear inputs, linked calculations and balanced statements
- Built for capital-intensive infrastructure: handles large upfront capex, phased construction, depreciation and debt financing
- Flexible: adapts to colocation, wholesale, edge, enterprise and AI data center business models
- Transparent: no hidden hard-codes, macros or locked formulas
- Global-ready: three languages, any currency and any fiscal year-end
File Details
- Format: Microsoft Excel (.xlsx)
- Compatibility: Windows, Mac and Google Sheets
- Forecast period: 5 years, monthly
- Languages: English, Spanish and French
- Currency: any, user-selectable
- Macros: none
- Editable: fully unlocked and customizable
Frequently Asked Questions
What is a data center financial model?
It’s a spreadsheet that forecasts a data center’s revenue, operating costs, capital expenditure, financing, cash flow and valuation. Founders, investors and lenders use it to decide whether a data center project is financially viable.
Can I use this model for a colocation data center?
Yes. You can model colocation revenue per rack or per kW, along with cross-connects, power pass-through and managed services.
Does it work for AI, GPU or hyperscale data centers?
Yes. The revenue, cost and capex sheets are flexible enough for high-density AI compute, wholesale hyperscale leases and powered-shell projects.
Do I need advanced Excel skills?
No. You only edit the input cells. Every calculation, statement, chart and valuation updates automatically.
Does the model include a valuation?
Yes. It includes a full DCF valuation with WACC, terminal value, enterprise value and equity value, plus a cap table showing investor ownership.
Can I model debt financing?
Yes. Enter the loan amount, interest rate, term and repayment type, and the model calculates interest, principal repayments and the effect on cash flow and the balance sheet.
Is it suitable for bank loans and project finance?
Yes. The cash flow statement, ratios, breakeven analysis and Sources & Uses summary give lenders the information they need to assess repayment ability.
Does it work on Windows, Mac and Google Sheets?
Yes. The model is a standard Excel file with no macros, so it opens in Excel for Windows, Excel for Mac and Google Sheets.
Can I change the currency and language?
Yes. Choose any currency symbol and switch the whole model between English, Spanish and French from the Dashboard.
Start Planning Your Data Center Today
Whether you’re developing your first facility, raising capital for an AI data center or evaluating an acquisition, this data center financial model gives you the clarity and credibility you need. Download it now and turn your assumptions into an investor-ready data center business plan, financial forecast and valuation.
Similar ProductsOther customers were also interested in...


 eFinancialModels
Electric Vehicle (EV) Charging Station Financial M...
With this comprehensive 5- or 10-year monthly tool, investors can assess the viability of setting up... Read more

Financial Model for Mobile App | Mobile App Busine...
The Mobile App Financial Plan Template in Excel allows you to develop financial projections when lau... Read more

 HenrySheykin
Food Truck Financial Model Excel Template
The Food Truck Financial Model helps entrepreneurs, founders, business owners, consultants, and anal... Read more

Green Hydrogen Production from Wind Energy Financi...
The Green Hydrogen from Wind Financial Model aims to comprehensively forecast a horizon of 40 years ... Read more

Simple Mutual Non-Disclosure Agreement Template
Protect your business secrets with ease using our Simple Mutual Non-Disclosure Agreement Template. S... Read more

Solar Energy Financial Model
The Solar Energy Financial Model Spreadsheet Template in Excel assists you in preparing a sophistica... Read more

 Peter Graf
The Customer-Centric Financial Model for Restauran...
Starting a restaurant without a financial plan is like driving a car blindfolded. You wouldn´t do i... Read more
You must log in to submit a review.